Wayne J. Camara, Dongmei Li, Deborah J. Harris,
Benjamin Andrews, Qing Yi, and Yong He
ACT Research Explains New ACT® Test Writing Scores
and Their Relationship to Other Test Scores

2
ACT Research Explains New ACT
®
Test Writing Scores and Their Relationship to Other Test Scores
Introduction
The ACT test has included an optional writing assessment since 2005. In September 2015, ACT
introduced changes to the design of this writing test, with modifications to the writing task, scoring
rubric, and score reports. The changes resulted from more than a decade of research into the
connection between writing skills and college and career success.
The changes are not extensive; many elements of the writing task remain similar to the previous
task. For example, both tasks emphasize argumentative writing skills that are essential for college
and career success. However, the new writing task is more consistent with the writing skills
emphasized in the Common Core State Standards (CCSS), the ACT College and Career Readiness
Standards, the 2011 NAEP Writing Framework,
1
and ACT’s own research findings.
The new task does include a much broader range of subject matter,
2
allows students to do more
planning before they write, and asks students to analyze multiple perspectives on a given issue in
relation to their own perspective. Because the new task calls on more complex thinking and writing
skills, students are given 40 minutes to complete this task instead of the previous 30-minute
timeframe.
3
To better measure these complex skills, the new test makes use of an analytic rubric.
This rubric allows raters to evaluate student essays for the evidence they provide of four central
writing competencies, and to assign each of these competencies its own score.
As a result, new score reports include four “domain” scores, which replace the single “holistic” score
provided by previous reports. Along with the new domain scores, ACT has also introduced a subject-
level writing score, which is reported on the familiar 1–36 scale. While these changes to scoring and
reporting represent efforts to offer users more and better information, the new scores have given
rise to a number of important questions. This paper will seek to answer these questions by reviewing
the new scores, examining their relationship to the other subject tests, and discussing productive
interpretations.
New ACT writing test scores
While the previous version of the ACT writing test was scored using a holistic rubric, the ACT writing
test is now scored using an analytic rubric that measures student competency in four separate
domains of writing. The change from a single overall or holistic score is also consistent with
contemporary practices in writing instruction and assessment. The new rubric and score reports are
intended to delineate critical writing skills and provide targeted score information about each skill.
These four scores, which are illustrated in Table 1, result from two trained raters scoring each essay
on a 1–6 scale in each of the four domains. Final domain scores are reported on the scale of 2–12;
these scores represent the sum of the scores assigned by the two raters. When ratings in any
domain are not in agreement or adjacent, the essay is sent to a third expert reader for adjudication.
1
Also developed by ACT.
2
The previous writing task asked students to write on issues around school-themes, while the current task presents broader and more
contemporary issues beyond school experience.
3
Key differences between the previous and current ACT writing tests can be found at www.actstudent.org/writing/enhancements/.
3
This currently occurs for fewer than one out of 10 essays and research suggests these rates will
decrease further as raters become more familiar with the rubrics and quality of writing for each
scorepoint and domain.
4
The resulting four domain scores are totaled (the score range for the total domain score is 8–48).
This score is then converted to a scaled score on a 1–36 scale. While all four of the domain scores
are reported, the greatest attention will likely be placed on the scale score.
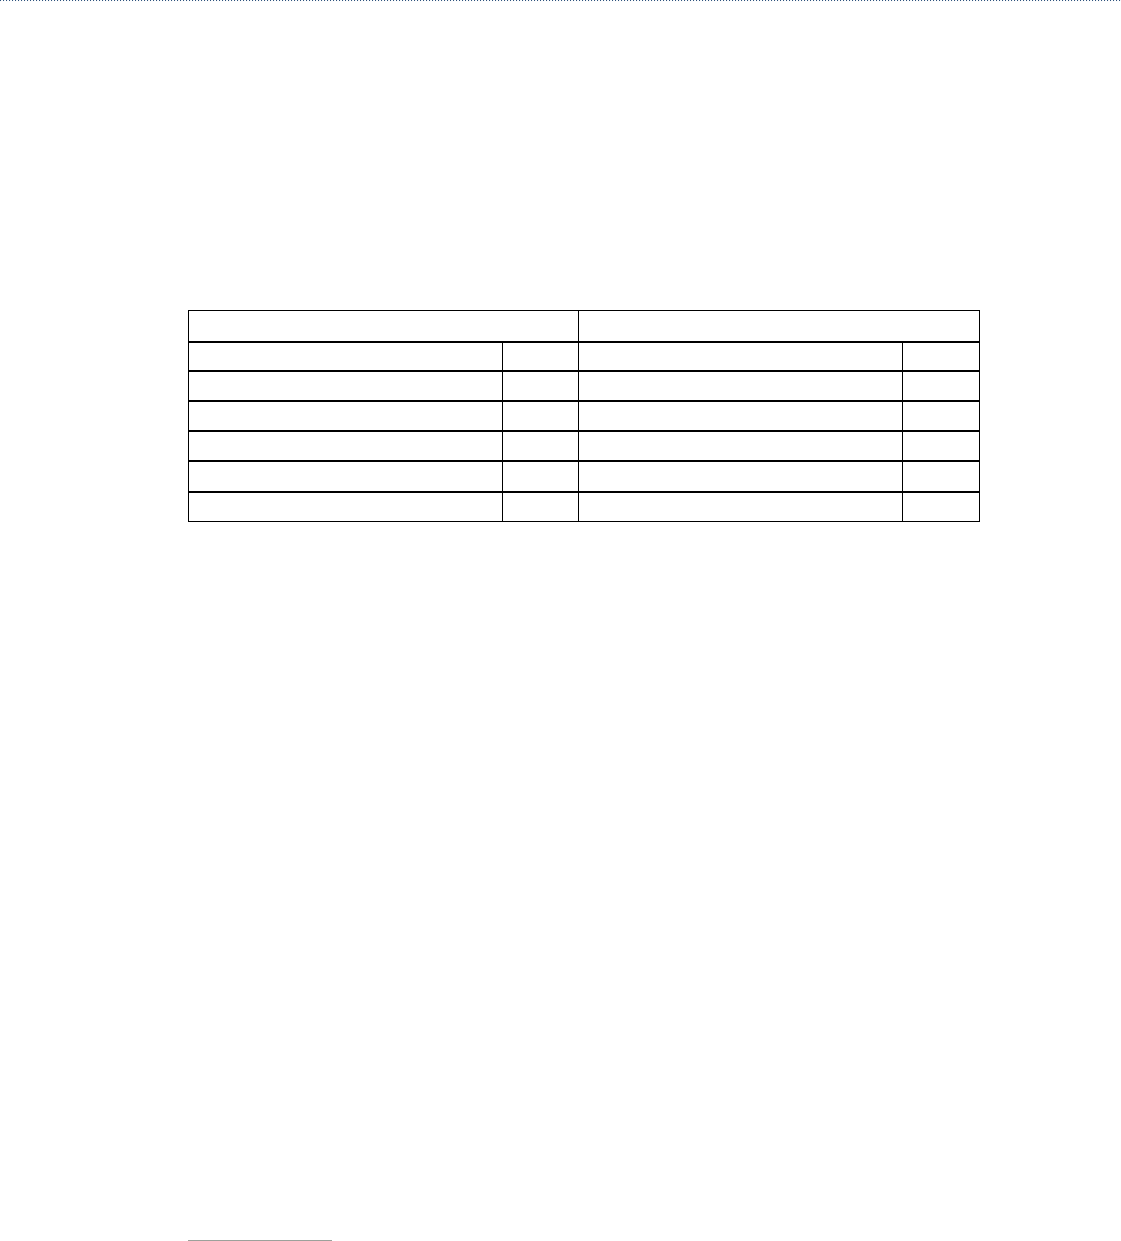
Table 1. Comparing the Previous ACT Writing Score with the New ACT Writing Score
Previous ACT Writing Score New ACT Writing Score
Holistic Writing Score 2–12 Subject Level Writing Score 1–36
Domain Scores
1. Ideas and Analysis
2–12
2. Development and Support
2–12
3. Organization
2–12
4. Language Use and Conventions
2–12
There have been a number of inquiries about the new writing test since its release in September
2015. The most frequent questions concern differences in scores between the new subject-level
writing score and other scores on the ACT. The specific concern appears to be that students with
extremely high ACT scores in English, reading, or even the ACT Composite may be receiving
noticeably lower scores in writing. Additionally, some have posed questions about the reliability
of the writing test and whether it is more difficult than the previous writing test. This paper briefly
addresses these issues using data from the September and October 2015 administrations and data
from the previous ACT writing test.
Are scores on the ACT subject-level writing test lower than scores
on ACT English and the ACT Composite? If so, why?
Some educators have found instances where a student receives a substantially lower writing score
in comparison to the Composite score (or English score). They have sometimes found similar scores
across the four subjects and Composite score, but a noticeably lower writing score. This example
has been cited most often for students with relatively high ACT Composite scores.
It is true that scores on the writing test were on average 3 or more points lower than the Composite
and English scores for the same percentile rank during September and October 2015.
5
Some
students may have had even larger differences between scores. This is not unexpected or an
indication of a problem with the test. However, the expectation that the same or similar scores
across ACT tests indicate the same or similar level of performance does signal that ACT needs
to better communicate what test scores mean and how to appropriately interpret the scores. This
document is one effort to begin to address this issue head on.
4
The weighted kappa coefficient (Cohen, 1968) is a measure of agreement between raters for categories (e.g., 1, 2, 3…) and is .65
for the September and October administrations. Spearman’s rank correlation coefficient assesses the relationship between two
categorical scores and is reported at .63 for the September and October administrations.
5
See Figure 1a and 1b.

4
ACT Research Explains New ACT
®
Test Writing Scores and Their Relationship to Other Test Scores
Comparing ACT subject scores without referencing the percentile ranks (i.e., norms) can lead to
misinterpretation and misuse. That is true for nearly all educational tests that report scores for
different subjects. A higher score on one test or subtest doesn’t necessarily mean that a student
performed better on that test, and the difference in scores across tests does not provide a basis for
evaluating strengths and weaknesses unless additional information is considered.
A score of 30 on the ACT math test doesn’t represent the same performance as a score of 30 on
ACT reading. A score of 30 would place a student at the 95th percentile on the ACT math test
(meaning that student’s score is as high or higher than 95% of high school graduates who took the
ACT in the past three years) as opposed to the 89th percentile on the ACT reading test, or 92
nd
percentile on the ACT English test. A student who received a science score of 24 and a reading
score of 25 may assume that reading was his or her “best score.” However, a reading score of 25
corresponds to the 75th percentile while the science score of 24 corresponds to a higher percentile
(77th percentile). The same phenomenon occurs on virtually all tests that produce separate scores,
including state assessments and other national tests used in admissions or educational achievement.
Even larger differences are found when comparing percentiles between the new ACT subject-level
writing score and the other ACT scores. For example, a score of 30 on the ACT writing test places
that same student at the 98th percentile, a full 9% higher performance than the reading score.
Similarly, an ACT subject-level writing score of 22 is over about 10 percentiles above the Composite
or other ACT scores. Table 2 below illustrates how the same scale score represents different
percentiles and norms for ACT test takers.
Table 2 also reveals that there are differences between the percentiles associated with the same
score across all tests, but differences are largest for writing. Prior to September 2015, a student’s
writing scores were reported on a 2–12 scale, which prevented direct comparisons with all other
ACT scores, which were reported on the 1–36 scale. However, the new writing test combines the
four domain scores, which are also reported to students, into an overall summary score on the 1–36
scale, making comparisons with other scores much more tempting. Perhaps too tempting! As you
can easily see in Table 2, percentiles associated with writing and the new combined ELA Score
6
consistently represent a higher percentile than the same score on other ACT tests.
Table 2. Sample Percentiles Associated with ACT Scale Scores
7
ACT
Score
English Math Reading Science Composite ELA Writing
33 97 98 97 98 99 99 99
30 92 95 89 95 95 98 98
26 82 84 78 87 83 90 93
22 64 62 61 63 63 72 80
18 40 43 36 33 36 46 58
14 21 6 16 13 12 19 35
6
The ELA score is a weighted composite based on the English, reading, and writing scores and only reported when students take the
optional writing test.
7
The reported percentiles are based on a three-year rolling average across ACT test takers. However, because the writing test and ELA
scores were introduced in September 2015, those norms were based on a special study conducted with 3,196 test takers in spring
2015. See www.actstudent.org/scores/norms.html for details about the norms.

5
Another way to look at this issue is to determine what score would represent the same percentile
across ACT scores. Table 3 illustrates that significant difference in scores often represents the same
percentile in the normative samples. For example, the 95th percentiles are set at a score of 32 in
English, 30 in science and 27 in writing.
Table 3 also illustrates the danger of assuming the same scale score represents the same rank order
or performance level across different scores. For example, students need a score of 32 on ACT
English to be at the 95th percentile, but a lower score of 30 on the ACT Composite, or 27 on ACT
writing places them in the exact same percentile or rank order. A casual observer may assume that a
student who received a score of 32 on ACT English, ACT Composite, and ACT writing demonstrated
consistent performance, but that would be incorrect. Rather, a score of 32 across those three tests
would represent significantly higher performance in comparison to peers in ACT writing, followed by
ACT Composite. The correct interpretation would be that a score of 32 on ACT math is equivalent
to scores of 30 and 27 on ACT Composite and ACT writing, respectively, in terms of percentiles
and rank order. There is a 5-point difference between the ACT English and ACT writing test scores
that result in the same percentile rank. Comparisons of ACT scores across different tests should
not be made on the basis of the actual score but on the basis of the percentile associated with that
score. This has always been true and is evident in comparisons of English with reading or math with
science as well. This is not unique to the ACT, but can be found on virtually any test which uses
the same score scale across different subjects or domains, including state assessments and other
achievement or admissions tests.
Table 3. Differences in ACT Scores at the Same Percentile
8
Percentile English Math Reading Science Composite ELA Writing
95th
percentile
32 30 32 30 30 28 27–28
80th
percentile
25–26 25–26 26–27 24–25 25–26 23–24 22
60th
percentile
21–22 21–22 21–22 21–22 21–22 20–21 18–19
50th
percentile
19–20 19–20 20–21 20–21 20 18–19 16–17
35th
percentile
16–17 16–17 17–18 18–19 17–18 16–17 14
20th
percentile
13–14 15–16 14–15 15–16 15–16 14–15 11–12
Why does this occur? There are a number of reasons why different scores (e.g., English, math,
writing) represent different percentile ranks. First, subject tests are primarily designed to maintain
score comparability across the various forms and administrations not across subjects. That is, scores
on the ACT math test or any ACT subject tests are equated so that they retain the same meaning
whether a student tested in October of 2015 or June of 2013. Tests are not designed to ensure
8
The reported percentiles are based on a three-year rolling average across ACT test takers. However, because the writing test and ELA
scores were introduced in September 2015, those norms were based on a special study conducted with 3,196 test takers in spring
2015. See www.actstudent.org/scores/norms.html for details about the norms.
ACT Research Explains New ACT
®
Test Writing Scores and Their Relationship to Other Test Scores
that a score of 25 means the same thing on ACT math as it does for ACT science or reading.
Second, norms or percentile ranks provide the best means of comparing different subject scores,
because they indicate the rank order of a student in terms of a reference population. The reference
populations (norms) for the ACT are based on a three-year rolling average of ACT test takers.
However, the self-selected population of students who take the ACT writing test is different than all
students who take the ACT. Students who take the ACT writing test are generally of higher ability.
Table 4 shows the mean ACT scores for the 2015 graduating class of students who took the ACT
and the ACT with writing.
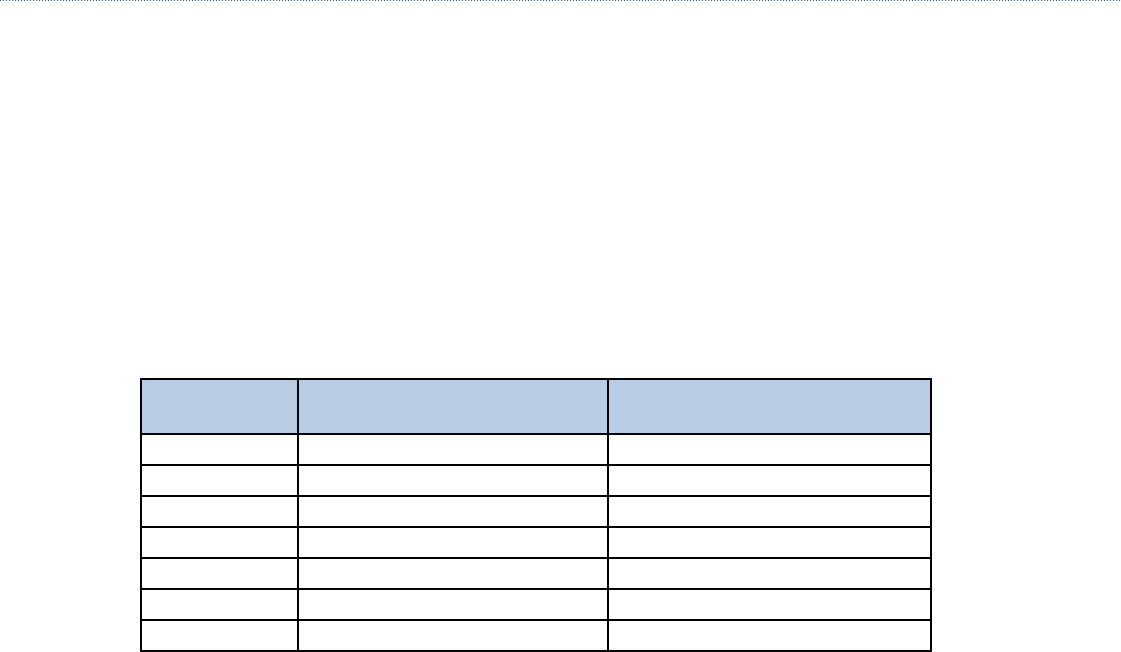
Table 4. Mean ACT Scores for the 2015 Graduating Cohort for Students Taking the ACT and
Students Taking the ACT with the Optional Writing Test
ACT Graduating
Cohort 2015
ACT Graduating Cohort of
Students Taking ACT with Writing
N
1,924,436 1,108,908
English
20.4 21.0
Mathematics
20.8 21.5
Reading
21.4 22.0
Science
20.9 21.4
Composite
21.0 21.6
Writing
NA 6.9 (2–12 scale)
Statistical processes, referred to as “equating,” are used to ensure that scores from the same test
(e.g., ACT math, ACT English) are comparable across administrations and students, so there is no
advantage in taking a test in one administration (e.g., October 2015) over another administration
(e.g., May 2013). But equating ensures that all math scores or all English scores are comparable and
doesn’t have any impact on comparisons of math and science scores or writing and English scores
(math versus writing; ELA versus science). The ACT includes measures of five distinct academic
skills: English, math, reading, science, and writing. It is natural to attempt to compare strengths and
weaknesses by looking at one’s highest and lowest scores, but we have already discussed why such
an interpretation is misleading and inappropriate with most tests, not just the ACT. The same scale
score will often result in large and significant differences on performance levels and the percentile
rank of students on state and national assessments, including other admissions tests. If one wished
to compare performance across different skills, or in the case of the ACT, across five different tests’
percentile ranks, representing where a student ranks in relation to a reference population, that would
provide a more useful and appropriate metric than test scores. For example, a score at the 60th
percentile represents higher normative standing than a score at the 45th percentile.
The ACT score scales of 1–36 are a well-established and trusted source of information and can be
used to monitor longitudinal trends and comparisons of different groups. Longitudinal trends have
been maintained because ACT has always introduced change incrementally and avoided radical
changes to the format of the test, the content of the test, and the types of items on the test. It is
legitimate to compare the ACT scores of a graduating class across years, or to compare student
performance in a state to national norms. However, comparisons of different scale scores across
tests (e.g., science versus writing; English versus math) are not generally appropriate and will result
in misinterpretations.
6

7
Writing scores are lower than other scores and seem less
consistent with other scores
Writing scores are generally lower than other scores—on average performance at the same
percentile is associated with a writing score which is 3–4 points lower than the ACT Composite
or English scores. However, reading scores on average have consistently been the highest score
across groups and such variations are common across different aggregate scores on many
standardized tests. It is not just the lower scores but the larger than expected gap between writing
scores which has led to questions from the field. So, let’s discuss this gap in more detail.
Each test score includes some level of imprecision—and every observed test score is comprised of
both a true score, reflecting an individual’s actual skill or knowledge and the expected variation from
that score.
9
The standard error of measurement (SEM) is a metric for reporting the extent that a
typical observed score varies from the true score. The SEM is used to calculate a score range that
represents an individual’s true score with a specific level of precision. For example, if a student were
to take the same test repeatedly, with no change in the student’s knowledge or skill, some scores
would be slightly higher or slightly lower than the student’s true score. In this hypothetical example,
the small differences between the standard deviation of the student’s observed scores and the
student’s highest or lowest score are known as the SEM. The SEM for ACT test scores is about
1 point for the ACT Composite and about 2 points for English, math, reading, and science, but the
SEM for the writing test is about double that, at about 4 points on the 1–36 scale. The SEM can be
used to aid in interpreting test scores as follows:
Given a student’s observed score of X, there is a two-out-of-three chance that the student’s true
score is between the lowest and highest score in the range. For the ACT, that information would be
based on the reported score.
• A score of 20 on the ACT Composite would indicate that there is a two-out-of-three chance that
the student’s true score would be between 19 and 21.
• A score of 20 on ACT math, English, reading or science would indicate that there is a two-out-of-
three chance that the student’s true score would be between 18 and 22.
• A score of 20 on ACT writing would indicate that there is a two-out-of-three chance that the
student’s true score would be between 16 and 24.
Therefore, the writing test does have significantly greater variation than other scores because it is a
single task, evaluated by raters using a 6-point interval scale, while other ACT tests are comprised of
40 to 75 questions.
This is no different from the former writing test, but the lower reliability associated with the old
writing score was not as evident because scores (on the 2–12 scale) were not as easily compared
to scores on the 1–36 scale. There have been anecdotal reports of large differences between
the score students have received on ACT writing and their ACT English or ACT Composite score.
Differences of 10 or more points have been reported. So the question is how frequently are such
differences occurring and does such a difference indicate there is a problem with the scale or
norms? Figure 2a presents the percent of observed difference scores between students’ writing
scores and their English, reading, or the Composite scores. The difference scores were obtained by
subtracting students’ English, reading, or Composite scores from their writing scores. It shows that
9
See Harvill, L. M. Standard Error of Measurement (1991), National Council on Measurement in Education, as one of many sources for
explaining this issue in more detail.

8
ACT Research Explains New ACT
®
Test Writing Scores and Their Relationship to Other Test Scores
students’ writing scores are most often lower than their reading scores. It also shows that about 5%
of the students had reading scores that were 8 points higher than their writing scores. The average
difference between writing scores and English, reading, and Composite scores for the first two
administrations of the new writing test were 2.9, 3.5, and 3.2, respectively. Only 10% of students had
writing scores that were lower than their Composite scores by 10 points or more, and only one out of
every 71 students had scores that were lower by 15 or more points. Of course, it is still important to
understand that score differences do not represent differences in percentile ranks. Because writing
scores are typically 3–4 points lower than English and Composite scores at similar percentile ranks,
looking at score differences will exaggerate the perception that writing scores are lower and do not
provide an appropriate method for comparing student performance across tests.
Old and new writing score distributions are not directly comparable because of differences in the
rubric and scale, which were described earlier. However, because the new writing domain scores are
on a 2–12 scale, as is the old writing holistic score, we can look at the rounded average of the four
domain scores (domain mean) as a rough way to compare the rater scores. For example, the domain
mean can be compared with the old writing holistic scores in the following way:
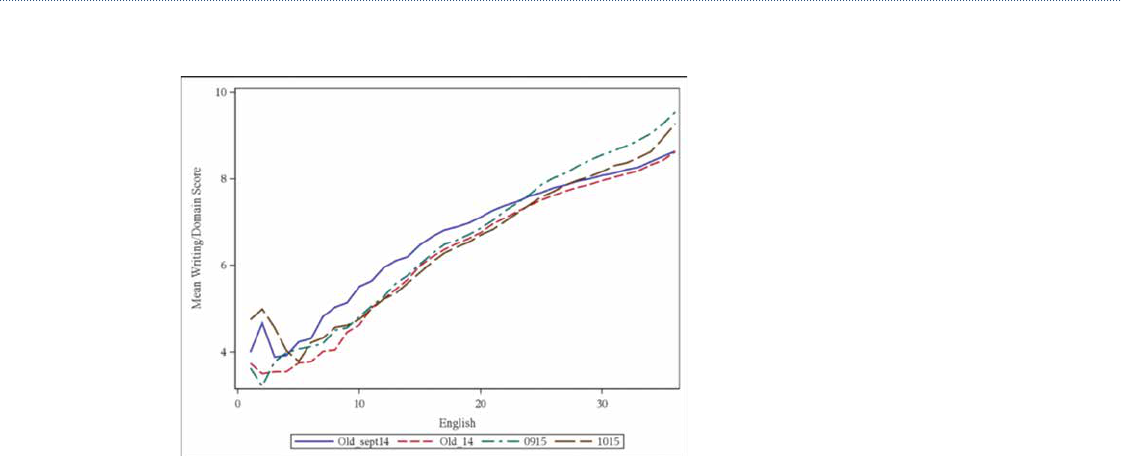
Figure 2b provides a plot of the mean of the new writing “domain mean” scores from September
2015 (0915) and October 2015 (1015) compared with the means of the old writing scores based on
the September 2014 data alone (Old_sept14) and means based on data from the entire 2014–15
testing year (Old_14), all conditioned on English scale scores. If September 2015 is compared with
September 2014 only, September 2015 writing means are lower than September 2014 means for
students receiving low to moderate English scale scores. However, the September 2015 domain
mean is higher than September 2014 for students with high English scale scores. When September
or October 2015 conditional means are compared with 2014 full year data, 2015 writing means are
comparable to 2014 means for the majority of English scale scores and higher than 2014 means
for high English scale scores. These results show that the new writing test is not necessarily harder
than the old writing test, at least from the perspective of domain scores compared with old writing
holistic scores. Furthermore, this provides some evidence that high-performing students, in terms of
overall ELA skills, are actually being more effectively recognized and rewarded with higher scores
on the new writing task than they were under the previous writing task, which was a chief goal of the
redesign effort.
Another way to examine changes between the previous and new writing scores pertains to their
relationship with other test scores. Table 5 provides a correlation matrix of the new writing score
and the previous writing score with other ACT test scores. Results show that the new writing test
has a slightly stronger relationship with ACT English, math, reading, and science scores. This finding
supports arguments that scores from the new writing test are as related to overall ACT performance
as the previous writing test, but changes to how the writing score is reported (currently on the 1–36
scale versus a 2–12 scale) may have inadvertently reinforced an expectation that subject scores are
more similar than they have been on either of the writing tests.
Table 5. Correlations of Writing Scores with ACT Subject Test Scores
English Math Reading Science
New ACT Writing
(N = 521,578)
0.61 0.52 0.57 0.54
Previous ACT Writing
(N = 2,195,223)
0.56 0.50 0.51 0.51

9
A final question concerns the reliability of the new ACT writing score compared to that of the
previous ACT writing score. In 2008, a reliability study was conducted on the previous writing test
where two different sets of prompts (25 in one set, 15 in the other) were administered to a group
of examinees. Each student responded to two different prompts and the order of the prompts was
counterbalanced. The correlation between the scores on the first occasion and on the second can
be considered a parallel forms estimate of reliability. The reliability estimate for these data was .67.
A similar process was followed for the new writing test using the 2014 writing field test data. In this
study, prompts were also split into two sets and administered in a counterbalanced order to students
on two separate occasions. After equating, students had scale scores on two different forms. The
parallel forms reliability for these data was .68. Though on different scales, the reliability estimates
(taking into account both rater and prompt variability) were similar between old writing and new
writing scale scores.
The SEMs between the previous writing and new writing scale scores are hard to compare because
of the scale difference. The new writing scale score (1–36) is a nonlinear transformation of the sum
of the two 1–to–6 rater scores on four domain scores (8–48), whereas the previous writing score
was simply a sum of the two 1–to–6 holistic rater scores (2–12). Nonetheless, the ratio of SEM
to observed standard deviation is similar for the previous and the new writing scores. For example,
the standard deviation (SD) of September 14 writing was about 1.42 and that of the September 15
writing was about 5.31. The ratio of previous writing SEM to SD is 1.01/1.42 = .71, and the ratio of
new writing SEM to SD is 3.88/5.31 = .73. When looking at the individual domain scores we find
that the SEM of the third domain is about the same and the SEM of the fourth domain is lower than
the overall SEM of the old writing test. The SEMs of the first two domains are slightly higher than
the old writing. Initial differences in the percent of exact agreement between raters is evident for the
first two administrations of the new writing test, but this has been offset by the increase in adjacent
agreement. Again, as raters become more familiar and experienced in scoring with the new domain-
based rubrics, these issues will be mitigated.
Conclusion
In September 2015, ACT made changes to the prompt, rubric, and reported scores on the optional
writing test. The changes included moving from a single holistic score to four domain scores.
Together all of these changes brought the new writing task closer to the writing skills emphasized
in the Common Core State Standards (CCSS), the ACT College and Career Readiness Standards,
the 2011 NAEP Writing Framework,
10
and the results of a decade of research and experience on
how writing skills relate to college and career success. Several research studies were conducted to
establish the score scale, to examine the reliability of the scores and raters, to examine subgroup
differences, and to assess other technical issues associated with the test. All findings from the
research studies and the first two administrations of the ACT writing test indicate that the new
writing test has similar reliability, precision, and difficulty as the previous writing test. Subgroup
differences in terms of reported score and variance did not change. However, the reported score
scale did change, and placing the writing score on the ACT 1–36 scale has led many test users to
compare the score to other ACT scores placed on the 1–36 scale.
While all four ACT subject scores and the ACT Composite have always been reported on the 1–36
scale, scores across subjects are not strictly interchangeable and should not be compared. Each
10
Also developed by ACT.
10
ACT Research Explains New ACT
®
Test Writing Scores and Their Relationship to Other Test Scores
test has slightly different statistical specifications and percentiles, and a higher scale score on one
test may actually result in a lower percentile rank than a lower scale score on another test. These
differences have largely been minor. Additionally, users were unable to make comparisons between
the previous writing score and other ACT scores because that score was only reported on a 2–12
scale.
The writing test is comprised of a single task, which is scored on four domains, but it is still a single
task (or a single item). The reliability of a single writing task is significantly lower than the reliability
of multiple-choice sections on any test, including the ACT. The greater variability of writing scores
means that there may be up to an 18-point difference between the percentile rank associated with
the same score for ACT writing and ACT English. Similar differences can be found with the ACT
Composite, which means that students performing at the same percentile will often receive a writing
score which is 3 or more points below other scores. Users wishing to compare ACT scores from
different subjects (e.g., math versus science; writing versus English) should not use the scale score,
but refer to the percentiles or norms. In addition, ACT percentiles (norms) are based on all students
who take the ACT test over a three-year period, while percentiles for the writing test are based on
only those students who complete the writing test and there are differences in these populations
that make precision comparisons of scores difficult.
Test users should be cautious in using the writing score alone for important decisions. ACT advises
users to consider the ELA score for such decisions because it is comprised of English, reading,
and writing scores, which will support its use for admissions, placement, accountability, and course
exemptions decisions. ACT is working to improve communications with score users about the
limitations of different scale scores and to provide additional advice and support to minimize
confusion and potential unintended consequences.
Finally, students are only beginning to get experience with the new writing prompt. Research
suggests that as students become increasingly familiar with the new prompt, scores may increase
and users will better understand the distribution of scores and how they correspond to the
percentiles and predicted success in college.
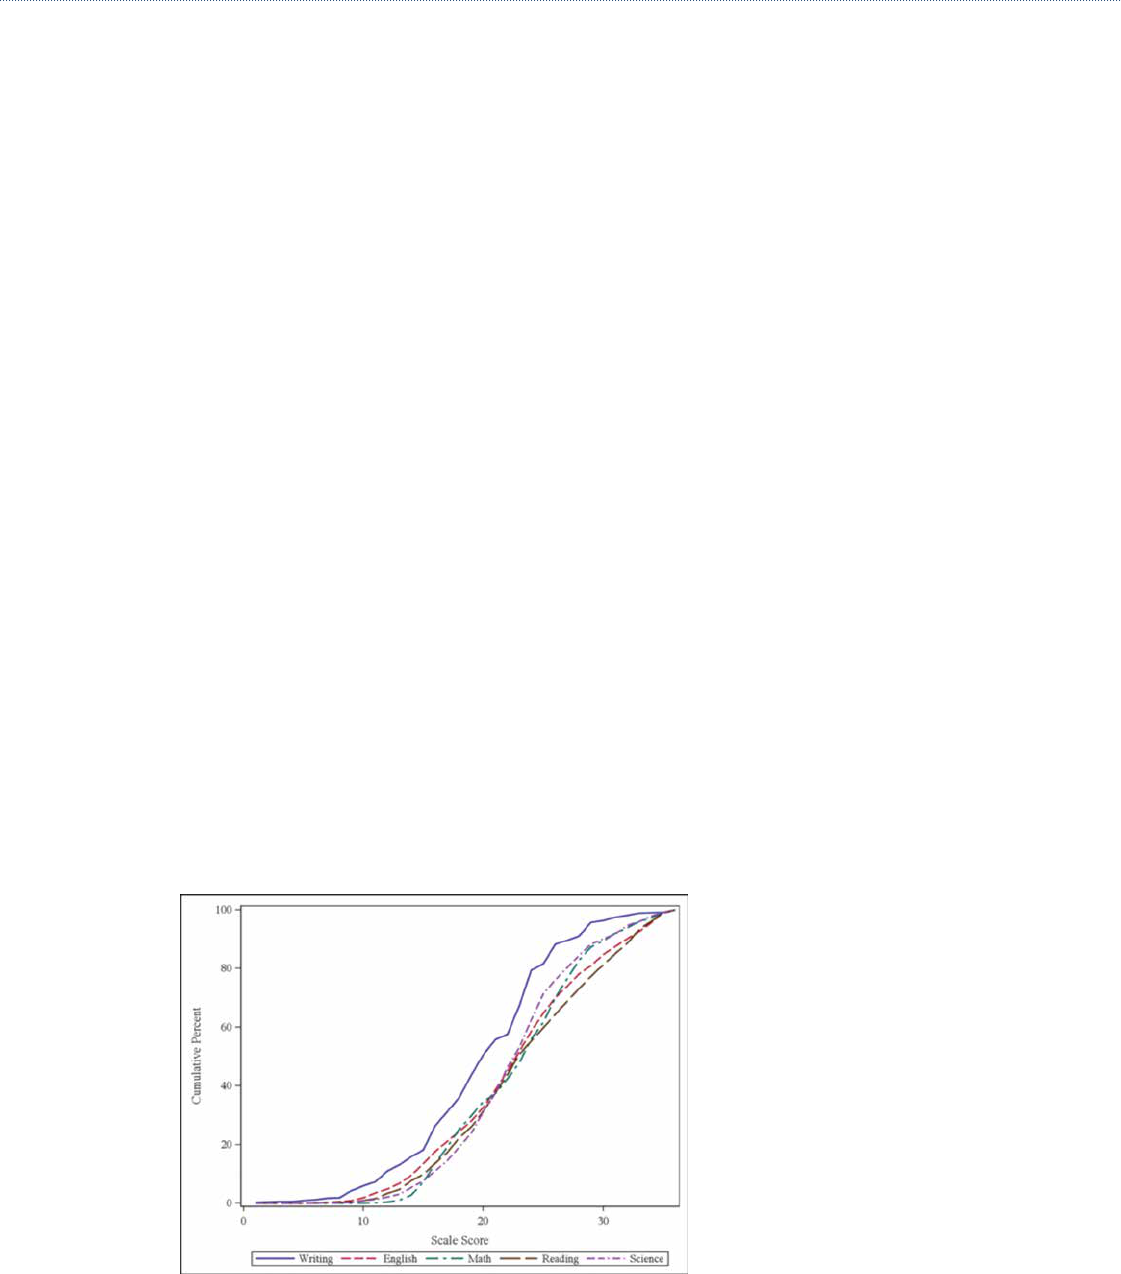
Figure 1a. Writing scale score distribution and other ACT scores from the September and
October 2015 administrations

11
Figure 1b. Writing, Composite, and ELA scale score distribution from the September and
October 2015 administrations
Figure 2a. Distribution of the difference between writing and English, reading, or ACT
Composite scores
12
ACT Research Explains New ACT
®
Test Writing Scores and Their Relationship to Other Test Scores
Figure 2b. September and October 2015 writing mean of the average of all four domain
scores compared with the old ACT writing mean scale scores conditioned on the English
scale score