
2023
Adams County
Real Estate Market Report
Prepared by:
901 Smile Way
York, PA 17404
Phone: (717) 843-7891
Fax: (717) 854-0720
www.rayac.com
www.OpenThisWeek.com
Find us on Facebook and Twitter!

2023 Adams County Real Estate Market Report
The Realtors® Association of York & Adams Counties (RAYAC) represents over
1,300 Realtor® members who work for the best interest of consumers - home
buyers and sellers - and advocate for private property rights. RAYAC
members also include commercial Realtors®, property managers and
appraisers.
This annual report provides an overview of Adams County’s real estate market as
well as housing trends for each of the six school districts. The data was derived
from the Multiple Listing Service of the Realtors® Association of York &
Adams Counties and Bright MLS. The statistics do not represent every real estate
transaction in the County. It does not include private real estate transactions or
new construction that did not involve a Realtor®.
Housing continues to be a significant economic sector within our community. It
is the source of direct employment for a variety of trades and professions such as
construction, finance and insurance. Housing sales also create a huge and often
unrecognized impact on the larger economy because it unleashes additional
spending as buyers transform a house into their home to reflect their tastes and
interests.
Thank you for reading this report and please contact RAYAC with any questions
you might have.
901 Smile Way
York, PA 17404
Phone: (717) 843-7891
Fax: (717) 854-0720
www.rayac.com

2
Table of Contents
Adams County Housing Market 3
Adams County Months Supply of Inventory 7
Adams County Foreclosure Filings 8
Adams County New Construction Market 9
Adams County School District Map 10
Bermudian Springs School District 11
Conewago Valley School District 13
Fairfield Area School District 15
Gettysburg Area School District 17
Littlestown Area School District 19
Upper Adams School District 21
3
Adams County Housing Market Snapshot

4
Adams County Housing Market:
Number of Homes Sold
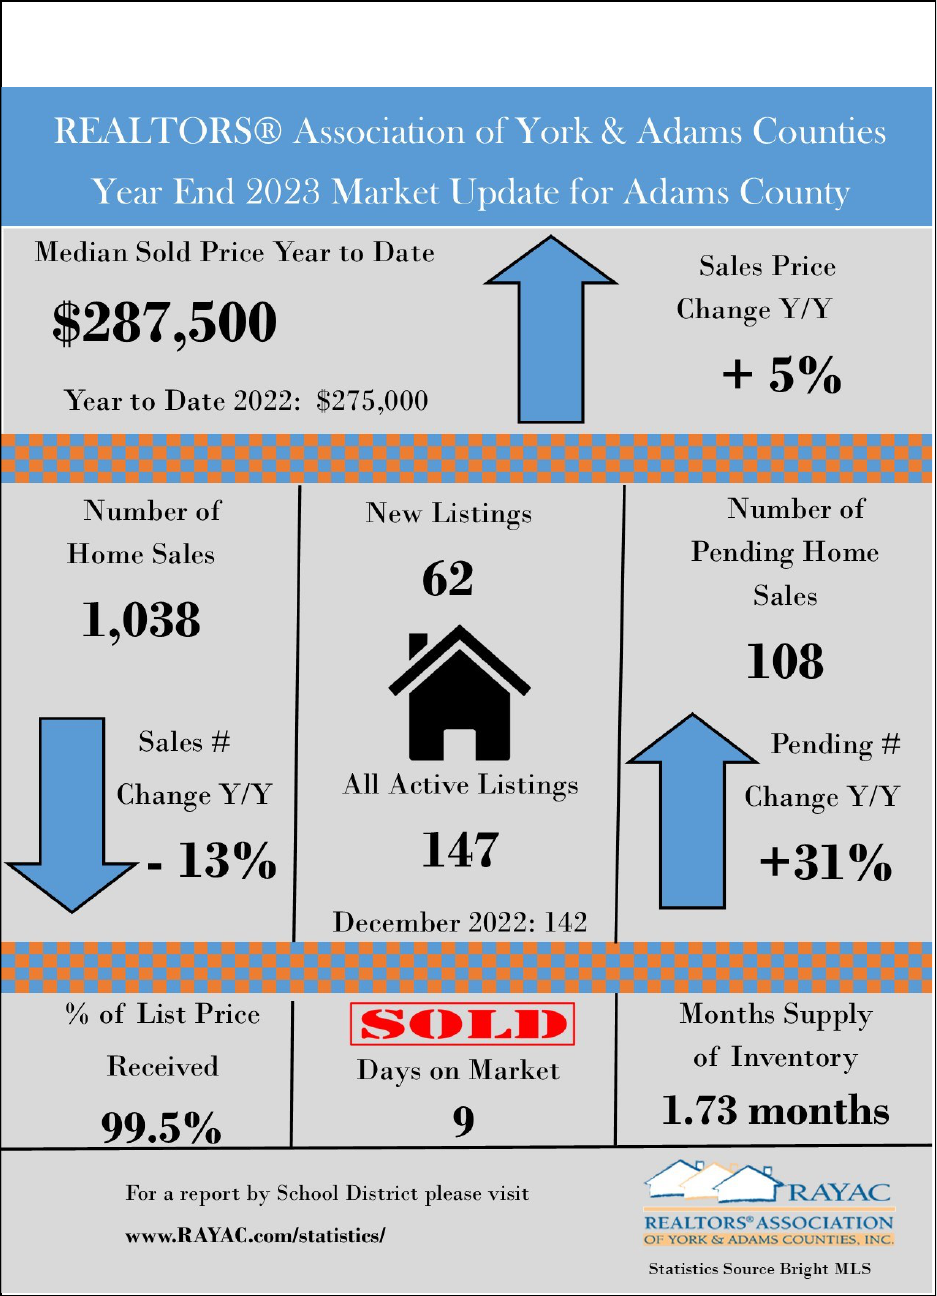
In 2023 Realtors® sold 1,038 homes in Adams County. This reflects a 13% decrease in
the number of homes sold compared to 2022.
The total dollar volume sold in 2023 was over $327 million. This reflects a 9%
decrease in total dollar volume from 2022 sales.
School District
2023 Sold 2022 Sold 2018 Sold 2013 Sold
% Change
over 1
Year
% Change
over 5
Years
% Change
over 10
Years
Bermudian Springs 115 137 161 126 -16% -29% -9%
Conewago Valley 256 300 352 240 -15% -27% 7%
Fairfield 86 110 112 86 -22% -23% 0%
Gettysburg 328 346 348 238 -5% -6% 38%
Littlestown 157 209 183 197 -25% -14% -20%
Upper Adams 96 86 105 97 12% -9% -1%
Total Adams County 1038 1188 1261 984 -13% -18% 5%
5
Adams County Housing Market:
Median Home Sale Price
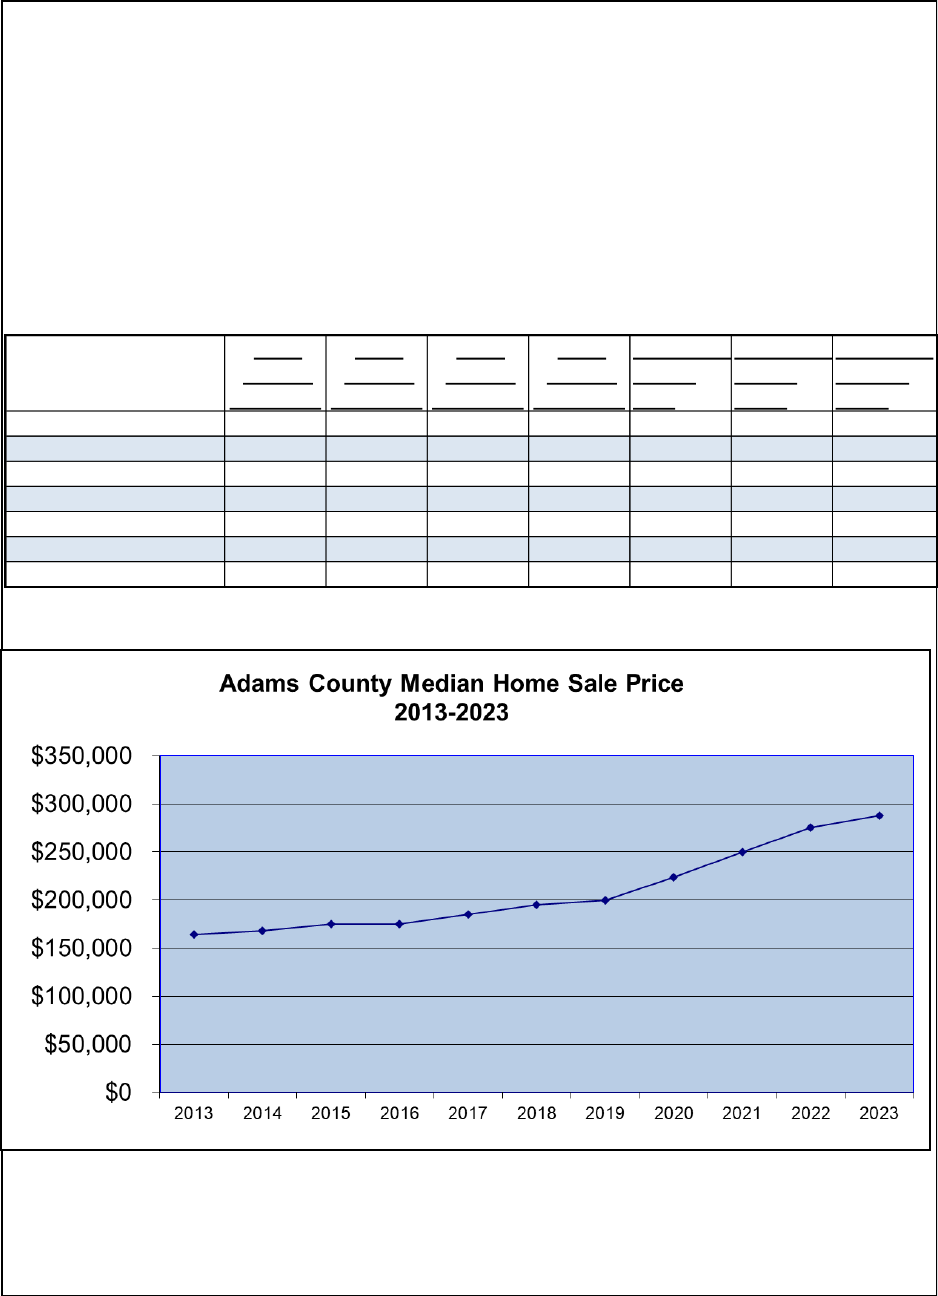
In Adams County the median home sale price was $287,500, this reflects a 5% increase
over 2022 sales. The 2023 median home sale price in Adams County is the highest
median home sale price in Adams County history. The median sold price in Adams
County increased 47% in five years and increased 75% over the past 10 years.
2023
Median
Sale Price
2022
Median
Sale Price
2018
Median
Sale Price
2013
Median
Sale Price
% Change
over 1
Year
% Change
over 5
Years
% Change
over 10
Years
Bermudian Springs $285,000 $290,000 $211,000 $152,500 -2% 35% 87%
Conewago Valley $251,650 $230,000 $170,900 $151,225 9% 47% 66%
Fairfield $317,500 $280,000 $204,500 $178,750 13% 55% 78%
Gettysburg $349,900 $307,495 $215,000 $194,250 14% 63% 80%
Littlestown $280,000 $270,000 $205,000 $167,000 4% 37% 68%
Upper Adams $272,450 $235,500 $151,000 $149,500 16% 80% 82%
Total Adams County $287,500 $275,000 $195,000 $164,095 5% 47% 75%

6
The median days on market for Adams County in 2023 was 9 days.
In 2023, 4% of the homes sold were under $100,000. Homes purchased
between $100,000-$199,999 were 13% of the market. Homes purchased
between $200,000-$299,999 were 36% of the market and 47% of the homes
sold were priced over $300,000.
Adams County Housing Market by Price Range

7
Adams County: Months Supply of Inventory
The months supply of inventory indicates how many months it would take for all the
current homes for sale on the market to sell, given a monthly sales volume. Six months
supply of inventory is considered a balanced market. The lower the number indicates
there are more buyers than sellers in the market.

8
Adams County: Foreclosure Filings
Source: Prothonotary of Adams County
A short sale is when the proceeds from a sale of real estate will fall short from paying the
balance of the liens on the property but the lien holder agrees to release the lien and accept
less than the amount owed on the debt. An REO Sale is a Real Estate Owned Sale which is
a class of property typically owned by a bank or government entity as a result of a
foreclosure on a property.

9
Adams County: New Construction
The RAYAC Multi-List System only captures a part of the new home construction market.
Only transactions which involved a real estate agent are recorded.
Year
Number
Sold
Median Sold
Price
Median
Finished
Sq FT
$/Sq Ft
2023 87 $ 399,990 1973 $ 203
2022 117 $ 420,000 2039 $ 206
2021 52 $ 365,000 2053 $ 178
2020 23 $ 299,900 2040 $ 147
2019 30 $ 321,600 2000 $ 161
2018 36 $ 289,000 1986 $ 146
Single Family Detached
2023 2022 2021 2020 2019 2018
Bermudian Springs 8 15 8 9 10 6
Conewago Valley 15 31 33 10 21 39
Fairfield 5 2 2 4 5 6
Gettysburg 71 69 12 10 12 19
Littlestown 8 13 5 3 4 7
Upper Adams 1 2 5 1 1 0
Total Adams County 108 132 65 37 53 77
Adams County Number of New Home Sales by School District
Year
Number
Sold
Median Sold
Price
Median
Finished
Sq FT
$/Sq Ft
2023 21 $ 385,803 1594 $ 242
2022 15 $ 383,180 1664 $ 230
2021 13 $ 328,490 1945 $ 169
2020 14 $ 238,950 1765 $ 135
2019 23 $ 202,000 1749 $ 115
2018 41 $ 181,300 1452 $ 125
Condominium and Town Home

10
Real Estate Activity by School District

11
Bermudian Springs School District
In the Bermudian Springs School District there were 115 homes sold in 2023 for a total dollar
volume of $36.4 million. The number of homes sold in 2023 decreased by 16% over 2022
sales.
The median home sale price was $285,000 in 2023. This home sale price reflects a 2%
decrease over 2022 sales, a 35% increase over 5 years, and a 87% increase over 10 years.

12
Bermudian Springs School District
The charts below reflect the median days on market and
the number of units sold in in each price range.
Type No. Sold Median Price Median Days on Market
Detached 111 287,500$ 7
Twin/Semi-Detached
0 -$ 0
Row/Townhouse
2 147,500$ 4
Mobile Home w/ Land 2 172,000$ 17
Grand Total 115
$ 285,000 6

13
Conewago Valley School District
In the Conewago Valley School District there were 256 homes sold in 2023 for a total dollar
volume of $73.3 million. The number of homes sold in 2023 decreased by 15% over 2022
sales.
The median home sale price was $251,650 in 2023. This home sale price reflects a 9%
increase compared to 2022 a 47% increase over 5 years, and a 66% increase over 10 years.

14
Conewago Valley School District
The charts below reflect the median days on market and
the number of units sold in in each price range.
Type No. Sold Median Price Median Days on Market
Detached 197 275,000$ 7
Twin/Semi-Detached
32 217,500$ 6
Row/Townhouse
16 196,500$ 10
Mobile Home w/ Land
11 85,000$ 35
Grand Total
256 $ 251,650 7

15
Fairfield Area School District
In the Fairfield Area School District there were 86 homes sold in 2023 for a total dollar
volume of $26.8 million. The number of homes sold in 2023 decreased by 22% over 2022
sales.
The median home sale price was $317,500 in 2023. This home sale price reflects a 13%
increase compared to 2022 sales, 55% increase over 5 years, and a 78% increase over 10 years.

16
Fairfield Area School District
The charts below reflect the median days on market and
the number of units sold in in each price range.
Type No. Sold Median Price Median Days on Market
Detached
83 325,000$ 13
Twin/Semi-Detached 2 249,900$
4
Row/Townhouse 0 -$
0
Mobile Home w/ Land 1 125,000$
23
Grand Total 86 317,500$ 13
17
Gettysburg Area School District
In the Gettysburg Area School District there were 328 homes sold in 2023 for a total dollar
volume of $114.7 million. The number of homes sold in 2023 decreased by 5% over 2022
sales.
The median home sale price was $349,900 in 2023. This home sale price reflects a 14%
increase over 2022 sales, a 63% increase over 5 years, and a 80% increase over 10 years.

18
Gettysburg Area School District
The charts below reflect the median days on market and
the number of units sold in in each price range.
Type No. Sold Median Price Median Days on Market
Detached 265 378,000$ 13
Twin/Semi-Detached 15 249,900$
20
Row/Townhouse 33 250,000$
8
Mobile Home w/ Land 15 65,000$ 19
Grand Total 328 349,900$ 12
19
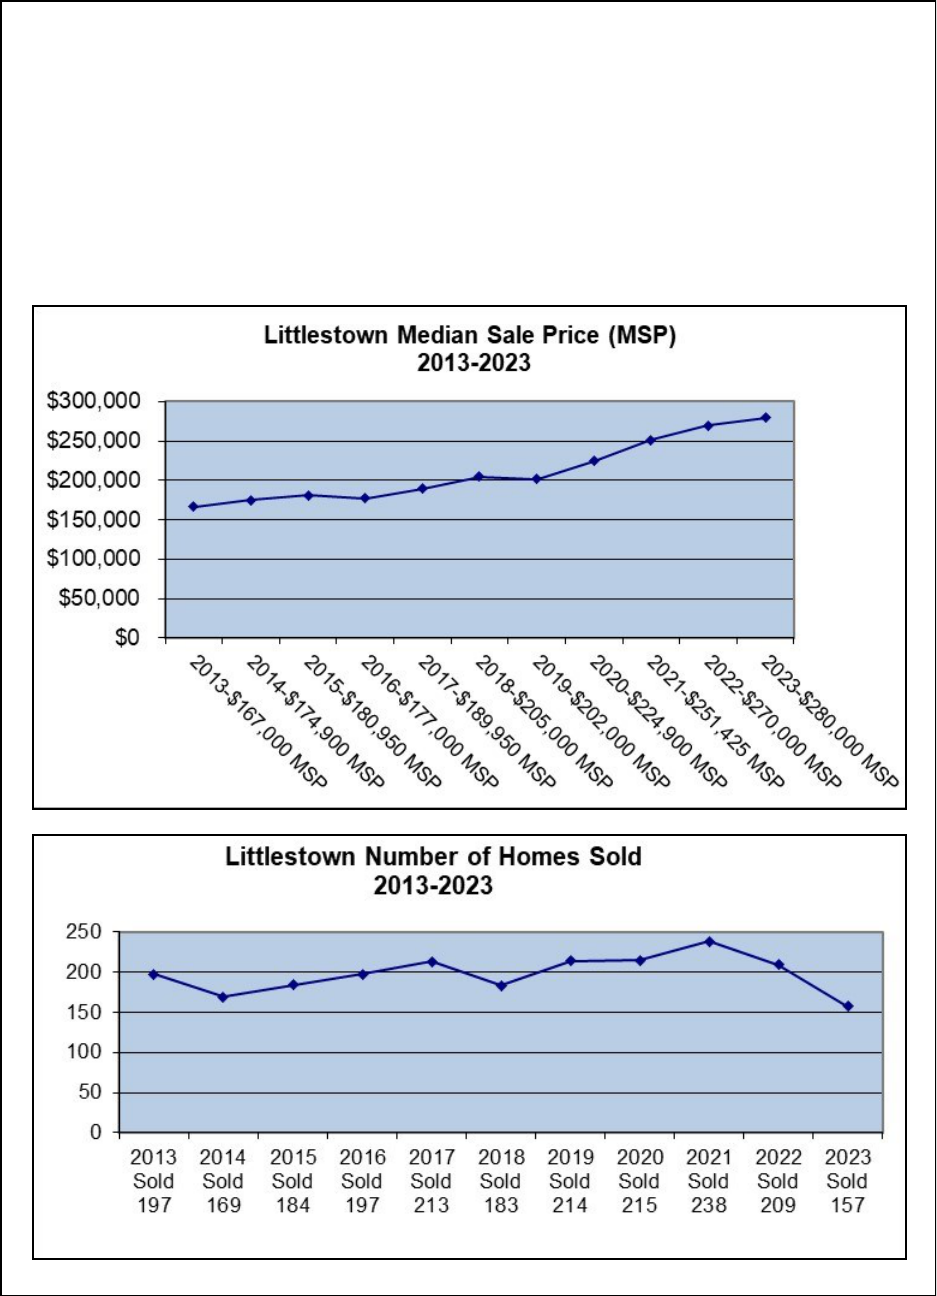
Littlestown Area School District
In the Littlestown Area School District there were 157 homes sold in 2023 for a total dollar
volume of $48.4 million. The number of homes sold in 2023 decreased by 25% over 2022
sales.
The median home sale price was $280,000 in 2023. This home sale price reflects a 4%
increase compared to 2022 sales, a 37% increase over 5 years and a 68% increase over 10 years.

20
Littlestown Area School District
The charts below reflect the median days on market and
the number of units sold in in each price range.
Type No. Sold Median Price Median Days on Market
Detached 133 285,000$
9
Twin/Semi-Detached
8 407,408$ 83
Row/Townhouse
12 220,000$ 12
Mobile Home w/ Land 4 137,500$
7
Grand Total 157 280,000$
10

21
Upper Adams School District
In the Upper Adams Area School District there were 96 homes sold in 2023 for a total dollar
volume of $27.7 million. The number of homes sold in 2023 increased by 12% over 2022
sales.
The median home sale price was $272,450 in 2023. This home sale price is a 16% increase
compared to 2022 sales, a 80% increase over 5 years, and a 82% increase over 10 years.

22
Upper Adams School District
The charts below reflect the average days on market and
the number of units sold in in each price range.
Type No. Sold Median Price Median Days on Market
Detached 86 276,000$
12
Twin/Semi-Detached 0 -$
0
Row/Townhouse 3 189,900$
4
Mobile Home w/ Land 7 190,000$ 19
Grand Total 96 272,450$
12
