Planned Parenthood by the Numbers
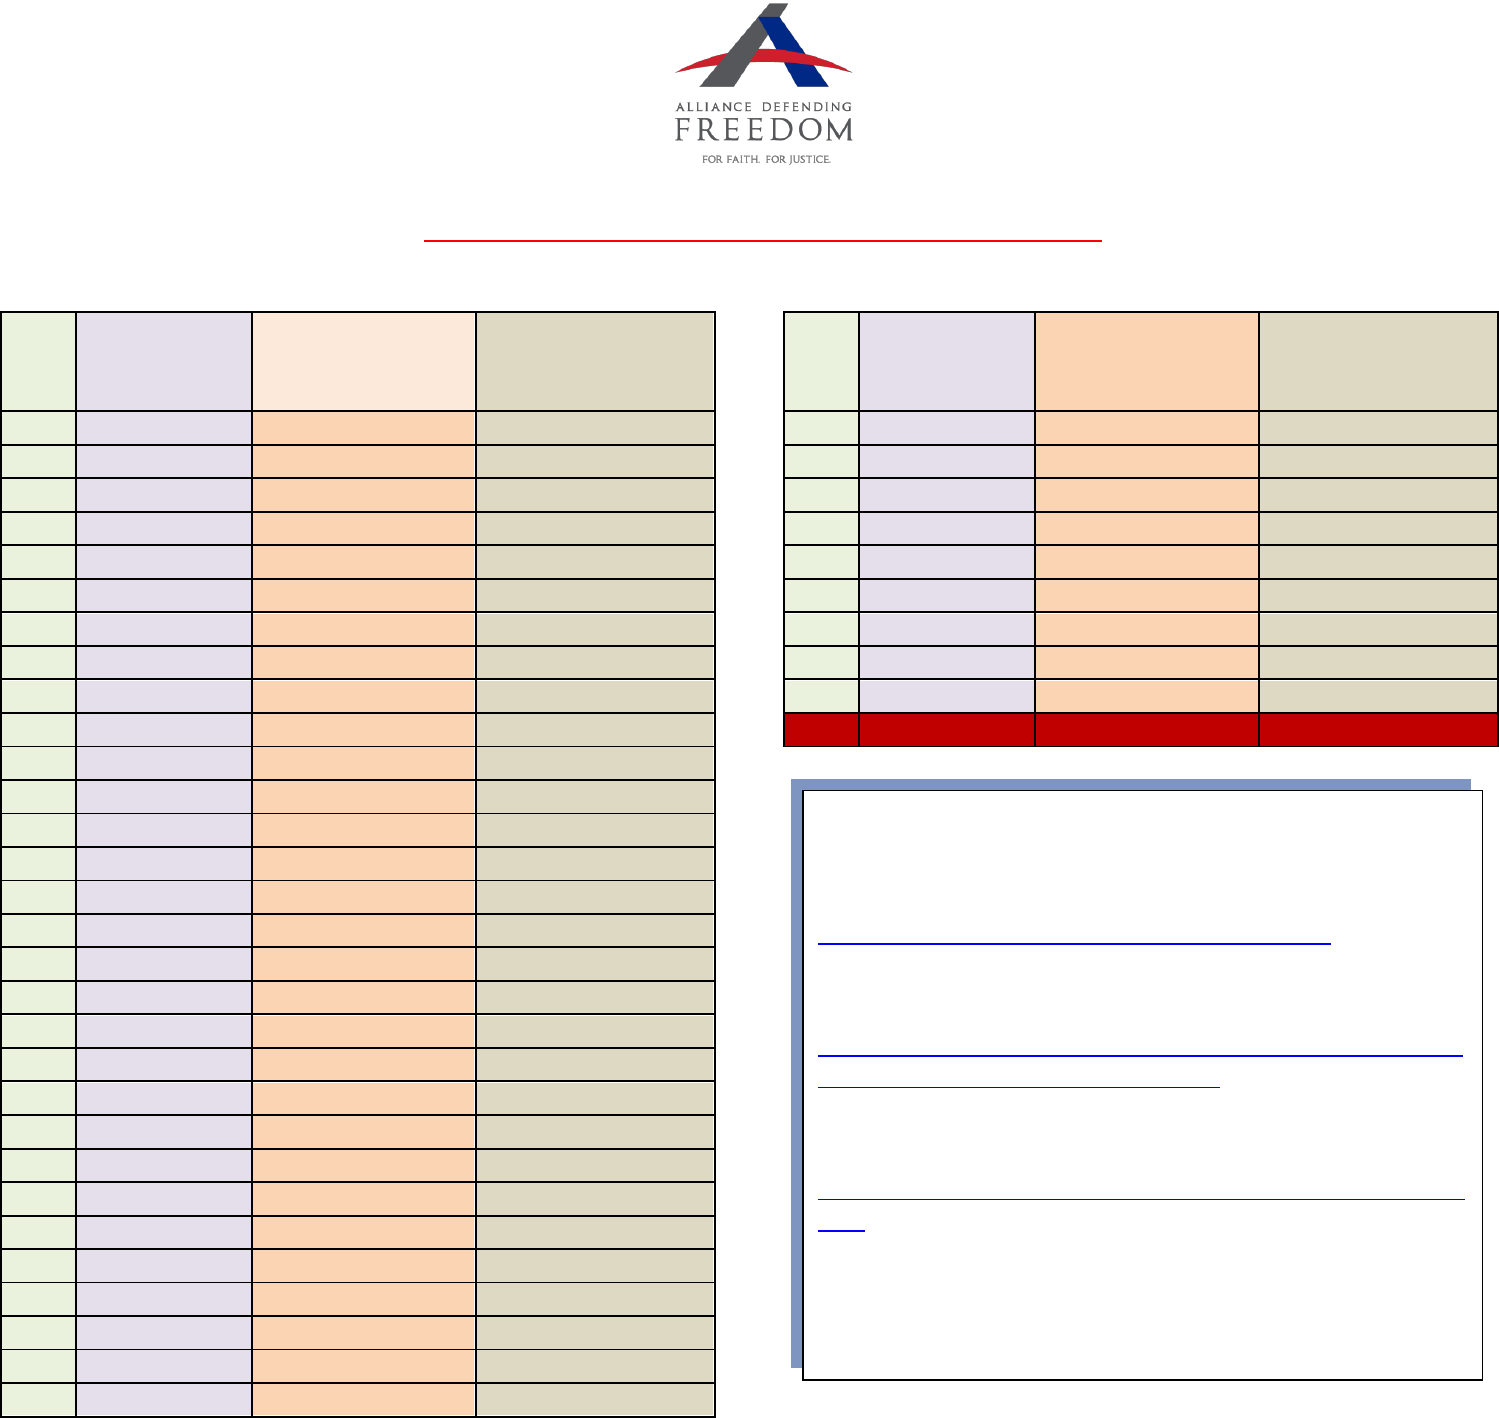
Table 1 – Percentage of U.S. Abortions Performed By Planned Parenthood since Roe v. Wade - 1973-2012
YEAR
# OF ABORTIONS
PERFORMED
# OF ABORTIONS
PERFORMED BY
PLANNED
PARENTHOOD
% OF OVERALL
ABORTIONS PERFORMED
BY PLANNED
PARENTHOOD
2003
1,250,000
236,500
18.92%
2004
1,222,100
240,998
19.72%
2005
1,206,200
264,943
21.97%
2006
1,242,200
289,750
23.33%
2007
1,209,600
305,310
25.24%
2008
1,212,400
324,008
26.72%
2009
1,159,000
331,796
28.63%
2010
1,126,000
329,445
29.26%
2011
1,057,000
333,946
31.59%
TOTAL
52,675,300
5,953,918
YEAR
# OF ABORTIONS
PERFORMED
# OF ABORTIONS
PERFORMED BY
PLANNED
PARENTHOOD
% OF OVERALL
ABORTIONS PERFORMED
BY PLANNED
PARENTHOOD
1973
744,600
4,988
0.67%
1974
898,600
9,974
1.11%
1975
1,034,200
19,960
1.93%
1976
1,179,300
39,978
3.39%
1977
1,316,700
58,724
4.46%
1978
1,409,600
70,057
4.97%
1979
1,497,700
66,947
4.47%
1980
1,553,900
59,980
3.86%
1981
1,577,300
79,969
5.07%
1982
1,573,900
79,954
5.08%
1983
1,575,000
85,207
5.41%
1984
1,577,200
88,796
5.63%
1985
1,588,600
91,026
5.73%
1986
1,574,000
98,689
6.27%
1987
1,559,100
104,459
6.70%
1988
1,590,800
111,196
6.99%
1989
1,566,900
122,218
7.80%
1990
1,608,600
129,170
8.03%
1991
1,556,500
133,152
8.55%
1992
1,528,900
130,873
8.56%
1993
1,495,000
134,251
8.98%
1994
1,423,000
133,335
9.37%
1995
1,359,400
139,882
10.29%
1996
1,360,200
153,294
11.27%
1997
1,335,000
165,139
12.37%
1998
1,319,000
168,568
12.78%
1999
1,314,800
182,888
13.91%
2000
1,313,000
197,081
15.01%
2001
1,291,000
211,078
16.35%
2002
1,269,000
226,389
17.84%
Sources
Rachel Jones and Kathryn Kooista, “Abortion Incidence and Access to
Services in the United States, 2008,” Alan Guttmacher Institute.
http://onlinelibrary.wiley.com/doi/10.1363/4304111/pdf
“Planned Parenthood Clinic Abortion Totals Defy National Trends,”
Family Research Council.
http://culturallegacy.org/clientimages/25220/pdffiles/plannedparentho
odclinicabortiontotalsdefynationaltrends.pdf
“Reported Annual Abortions: 1973-2008,” Abortion Statistics, United
States Data and Trends, National Right to Life Committee.
http://alt.coxnewsweb.com/statesman/politifact/020111_righttolife201
1.pdf
Planned Parenthood Federation of America Annual Reports 2004/2005-
2011/2012 and Planned Parenthood Federation of America Services Fact
Sheet, 2008 and 2009.

Planned Parenthood Chapter Revenues
Taken from IRS 990 Forms at http://www.guidestar.org/
CHAPTER
NON-
GOVERNMENT
CLINIC REVENUE
TOTAL % OF NON-
GOVERNMENT
CLINICAL REVENUE
GOVERNMENT
GRANTS (Title X,
etc)
% OF REVENUE
FROM
GOVERNMENT
GRANTS
MEDICAID AND
OTHER
GOVERNMENT
FUNDING
% OF REVENUE
FROM MEDICAID
AND OTHER
GOVERNMENT
FUNDING
TOTAL
GOVERNMENT
REVENUE
TOTAL % OF REVENUE
FROM ALL
GOVERNMENT SOURCES
TOTAL REVENUE
YEAR
GOVERNMENT
REVENUE
GREATER THAN
30%?
Arizona
Planned Parenthood Arizona
$7,289,953.00
83.68%
$1,422,167.00
16.32%
0.00%
$1,422,167.00
16.32%
$8,712,120.00
2012
Arkansas
Planned Parenthood Of Arkansas And Eastern
Oklahoma
$3,819,442.00
52.00%
$3,525,873.00
48.00%
0.00%
$3,525,873.00
48.00%
$7,345,315.00
2011
ATTENTION
California
Planned Parenthood-Orange & San Bernardino
County
$32,085,067.00
87.34%
$4,651,678.00
12.66%
0.00%
$4,651,678.00
12.66%
$36,736,745.00
2011
Planned Parenthood Mar Monte
$25,650,191.00
26.72%
$3,963,823.00
4.13%
$66,393,372.00
69.15%
$70,357,195.00
73.28%
$96,007,386.00
2011
ATTENTION
Planned Parenthood of the Pacific Southwest
$15,571,258.00
27.86%
$727,137.00
1.30%
$39,599,437.00
70.84%
$40,326,574.00
72.14%
$55,897,832.00
2011
ATTENTION
Planned Parenthood Los Angeles
$49,918,485.00
96.75%
$1,676,459.00
3.25%
0.00%
$1,676,459.00
3.25%
$51,594,944.00
2012
Planned Parenthood of Santa Barbara, Ventura
and San Luis Obispo Counties
$3,561,761.00
23.27%
$347,308.00
2.27%
$11,397,830.00
74.46%
$11,745,138.00
76.73%
$15,306,899.00
2012
ATTENTION
Planned Parenthood Pasadena and San Gabriel
Valley
$8,381,678.00
97.37%
$226,422.00
2.63%
0.00%
$226,422.00
2.63%
$8,608,100.00
2011
Planned Parenthood Shasta Diablo
$4,907,163.00
13.36%
$3,002,959.00
8.18%
$28,810,517.00
78.46%
$31,813,476.00
86.64%
$36,720,639.00
2011
ATTENTION
Six Rivers Planned Parenthood
$2,963,113.00
91.55%
$273,582.00
8.45%
0.00%
$273,582.00
8.45%
$3,236,695.00
2012
Colorado
Planned Parenthood Of The Rocky Mountains
$26,888,878.00
92.23%
$2,265,782.00
7.77%
0.00%
$2,265,782.00
7.77%
$29,154,660.00
2011
Connecticut
Planned Parenthood of Southern New England
$23,610,502.00
80.62%
$5,675,539.00
19.38%
0.00%
$5,675,539.00
19.38%
$29,286,041.00
2012
Delaware
Planned Parenthood of Delaware
$2,860,067.00
69.54%
$839,365.00
20.41%
$413,594.00
10.06%
$1,252,959.00
30.46%
$4,113,026.00
2012
ATTENTION
Florida
Planned Parenthood of South Florida and the
Treasure Coast
$9,015,586.00
85.46%
$1,533,425.00
14.54%
0.00%
$1,533,425.00
14.54%
$10,549,011.00
2011
Planned Parenthood of Southwest and Central
Florida
$8,342,669.00
99.10%
$76,148.00
0.90%
0.00%
$76,148.00
0.90%
$8,418,817.00
2011
Planned Parenthood of Collier County
$4,244,262.00
100.00%
0.00%
0.00%
$0.00
0.00%
$4,244,262.00
2011
Planned Parenthood Of Greater Orlando
$2,945,301.00
88.34%
$388,831.00
11.66%
0.00%
$388,831.00
11.66%
$3,334,132.00
2011
Planned Parenthood of North Florida
$1,992,315.00
99.49%
$10,124.00
0.51%
0.00%
$10,124.00
0.51%
$2,002,439.00
2011
Georgia
Planned Parenthood Southeast
$7,487,579.00
94.48%
$437,650.00
5.52%
0.00%
$437,650.00
5.52%
$7,925,229.00
2012
Hawaii
$7,487,579.00
94.48%
$437,651.00
5.52%
$437,651.00
5.52%
$7,925,230.00
Planned Parenthood of Hawaii
$2,857,128.00
76.24%
$890,458.00
23.76%
0.00%
$890,458.00
23.76%
$3,747,586.00
2011
Illinois
Planned Parenthood of Illinois
$21,847,718.00
88.85%
$2,742,510.00
11.15%
0.00%
$2,742,510.00
11.15%
$24,590,228.00
2012
Indiana
Planned Parenthood of Greater Indiana
$12,256,484.00
79.84%
$1,680,887.00
10.95%
$1,413,968.00
9.21%
$3,094,855.00
20.16%
$15,351,339.00
2011
Iowa

Planned Parenthood of the Heartland
$26,002,423.00
93.07%
$1,934,912.00
6.93%
0.00%
$1,934,912.00
6.93%
$27,937,335.00
2011
Kansas
Comprehensive Health Of Planned Parenthood
Of Mid-Missouri and Kansas
$3,481,085.00
100.00%
0.00%
0.00%
$0.00
0.00%
$3,481,085.00
2011
Planned Parenthood of Kansas & Mid-Missouri
$4,276,372.00
82.65%
$897,929.00
17.35%
0.00%
$897,929.00
17.35%
$5,174,301.00
2011
Kentucky
Planned Parenthood Of Louisville
$1,183,110.00
72.26%
$454,277.00
27.74%
0.00%
$454,277.00
27.74%
$1,637,387.00
2011
Maryland
Planned Parenthood of Maryland
$8,453,941.00
81.48%
$1,921,119.00
18.52%
0.00%
$1,921,119.00
18.52%
$10,375,060.00
2011
Massachusetts
Planned Parenthood League of Massachusetts
$19,183,896.00
93.57%
0.00%
$1,317,729.00
6.43%
$1,317,729.00
6.43%
$20,501,625.00
2011
Michigan
Planned Parenthood Mid and South Michigan
$8,797,825.00
73.92%
$3,103,454.00
26.08%
0.00%
$3,103,454.00
26.08%
$11,901,279.00
2011
Planned Parenthood of West and Northern
Michigan
$2,464,620.00
53.72%
0.00%
$2,122,967.00
46.28%
$2,122,967.00
46.28%
$4,587,587.00
2011
ATTENTION
Planned Parenthood of South Central Michigan
$2,759,273.00
80.99%
$647,834.00
19.01%
0.00%
$647,834.00
19.01%
$3,407,107.00
2011
Minnesota
Planned Parenthood Minnesota North Dakota
and South Dakota
$25,061,660.00
83.95%
$4,792,178.00
16.05%
0.00%
$4,792,178.00
16.05%
$29,853,838.00
2011
Missouri
Planned Parenthood of the St. Louis Region
$14,046,036.00
91.29%
0.00%
$1,340,929.00
8.71%
$1,340,929.00
8.71%
$15,386,965.00
2012
Reproductive Health Services of Planned
Parenthood Of St. Louis Region
$2,962,497.00
100.00%
0.00%
0.00%
$0.00
0.00%
$2,962,497.00
2012
Montana
Intermountain Planned Parenthood
$3,704,946.00
66.41%
$1,873,669.00
33.59%
0.00%
$1,873,669.00
33.59%
$5,578,615.00
2012
ATTENTION
New Jersey
Planned Parenthood Central and Greater
Northern New Jersey
$6,734,130.00
62.66%
$2,597,696.00
24.17%
$1,414,523.00
13.16%
$4,012,219.00
37.34%
$10,746,349.00
2011
ATTENTION
Planned Parenthood Association of the Mercer
Area
$2,597,684.00
80.02%
$648,534.00
19.98%
0.00%
$648,534.00
19.98%
$3,246,218.00
2011
Planned Parenthood of Metropolitan New
Jersey
$2,702,013.00
48.04%
$2,028,413.00
36.06%
$894,449.00
15.90%
$2,922,862.00
51.96%
$5,624,875.00
2011
ATTENTION
Planned Parenthood of Southern New Jersey
$2,042,584.00
51.63%
$1,913,968.00
48.37%
0.00%
$1,913,968.00
48.37%
$3,956,552.00
2011
ATTENTION
Planned Parenthood of Central New Jersey
$2,095,848.00
62.82%
$1,240,574.00
37.18%
0.00%
$1,240,574.00
37.18%
$3,336,422.00
2011
ATTENTION
New Mexico
Planned Parenthood of New Mexico
$2,231,737.00
61.10%
$240,069.00
6.57%
$1,180,547.00
32.32%
$1,420,616.00
38.90%
$3,652,353.00
2011
ATTENTION
New York
Planned Parenthood of Western New York
$3,199,117.00
52.68%
$2,874,087.00
47.32%
0.00%
$2,874,087.00
47.32%
$6,073,204.00
2011
ATTENTION
Planned Parenthood Of New York City
$26,180,732.00
60.79%
$8,459,082.00
19.64%
$8,424,206.00
19.56%
$16,883,288.00
39.21%
$43,064,020.00
2011
ATTENTION
Planned Parenthood of Nassau County
$3,539,766.00
54.38%
$1,914,092.00
29.41%
$1,055,164.00
16.21%
$2,969,256.00
45.62%
$6,509,022.00
2011
ATTENTION
Planned Parenthood Of The Mid-Hudson Valley
$2,518,295.00
34.77%
$2,461,313.00
33.98%
$2,262,746.00
31.24%
$4,724,059.00
65.23%
$7,242,354.00
2011
ATTENTION
Planned Parenthood Hudson Peconic
$8,573,308.00
52.35%
$4,939,530.00
30.16%
$2,862,802.00
17.48%
$7,802,332.00
47.65%
$16,375,640.00
2011
ATTENTION
Upper Hudson Planned Parenthood
$3,101,781.00
68.68%
$1,414,799.00
31.32%
0.00%
$1,414,799.00
31.32%
$4,516,580.00
2011
ATTENTION
Planned Parenthood of the North Country New
York
$1,376,416.00
28.97%
$2,434,005.00
51.23%
$941,015.00
19.80%
$3,375,020.00
71.03%
$4,751,436.00
2011
ATTENTION
Planned Parenthood Mohawk Hudson
$7,807,104.00
61.55%
$4,204,449.00
33.15%
$673,262.00
5.31%
$4,877,711.00
38.45%
$12,684,815.00
2011
ATTENTION

Planned Parenthood of the Rochester Syracuse
Region
$7,399,213.00
66.32%
0.00%
$3,757,130.00
33.68%
$3,757,130.00
33.68%
$11,156,343.00
2011
ATTENTION
Planned Parenthood of the Southern Finger
Lakes
$2,586,922.00
44.13%
$1,896,492.00
32.35%
$1,378,442.00
23.52%
$3,274,934.00
55.87%
$5,861,856.00
2011
ATTENTION
North Carolina
Planned Parenthood of Central North Carolina
$4,851,401.00
94.89%
$261,331.00
5.11%
0.00%
$261,331.00
5.11%
$5,112,732.00
2012
Planned Parenthood Health Systems
$9,415,015.00
93.60%
0.00%
$643,410.00
6.40%
$643,410.00
6.40%
$10,058,425.00
2012
Ohio
Planned Parenthood of Northeast Ohio
$8,341,481.00
60.11%
$2,690,841.00
19.39%
$2,844,631.00
20.50%
$5,535,472.00
39.89%
$13,876,953.00
2011
ATTENTION
Planned Parenthood of Central Ohio
$1,851,909.00
68.23%
$862,479.00
31.77%
0.00%
$862,479.00
31.77%
$2,714,388.00
2011
ATTENTION
Planned Parenthood Southwest Ohio Region
$5,709,917.00
83.10%
$1,161,145.00
16.90%
0.00%
$1,161,145.00
16.90%
$6,871,062.00
2011
Planned Parenthood of Northwest Ohio
$621,147.00
55.04%
$507,350.00
44.96%
0.00%
$507,350.00
44.96%
$1,128,497.00
2011
ATTENTION
Planned Parenthood of Southeast Ohio
$248,403.00
63.93%
$140,155.00
36.07%
0.00%
$140,155.00
36.07%
$388,558.00
2011
ATTENTION
Oklahoma
Planned Parenthood of Central Oklahoma
$2,129,638.00
100.00%
0.00%
0.00%
$0.00
0.00%
$2,129,638.00
2011
Planned Parenthood of Arkansas and Eastern
Oklahoma
$3,819,442.00
52.00%
$3,525,873.00
48.00%
0.00%
$3,525,873.00
48.00%
$7,345,315.00
2011
ATTENTION
Oregon
Planned Parenthood Of The Columbia
Willamette
$20,340,164.00
100.00%
0.00%
0.00%
$0.00
0.00%
$20,340,164.00
2011
Planned Parenthood Health Services Of
Southwestern Oregon
$2,979,500.00
35.33%
$264,886.00
3.14%
$5,188,439.00
61.53%
$5,453,325.00
64.67%
$8,432,825.00
2011
ATTENTION
Pennsylvania
Planned Parenthood of North East Pennsylvania
$3,538,905.00
54.72%
$1,166,558.00
18.04%
$1,761,498.00
27.24%
$2,928,056.00
45.28%
$6,466,961.00
2012
ATTENTION
Planned Parenthood of Western Pennsylvania
$3,826,764.00
89.91%
$429,682.00
10.09%
0.00%
$429,682.00
10.09%
$4,256,446.00
2011
Planned Parenthood Southeastern PA
$16,958,166.00
91.57%
$1,560,604.00
8.43%
0.00%
$1,560,604.00
8.43%
$18,518,770.00
2011
Planned Parenthood Bucks County
$2,465,198.00
77.40%
$719,983.00
22.60%
0.00%
$719,983.00
22.60%
$3,185,181.00
Planned Parenthood of Central Pennsylvania
$2,571,536.00
100.00%
0.00%
0.00%
$0.00
0.00%
$2,571,536.00
2012
Tennessee
Planned Parenthood of Middle & East
Tennessee
$3,069,199.00
98.31%
$52,805.00
1.69%
0.00%
$52,805.00
1.69%
$3,122,004.00
2012
Planned Parenthood Greater Memphis Region
$2,458,166.00
91.53%
$227,427.00
8.47%
0.00%
$227,427.00
8.47%
$2,685,593.00
2012
Texas
Planned Parenthood of North Texas
$14,548,124.00
65.25%
$4,083,608.00
18.32%
$3,664,562.00
16.44%
$7,748,170.00
34.75%
$22,296,294.00
2011
ATTENTION
Planned Parenthood of the Texas Capital Region
$4,982,534.00
100.00%
0.00%
0.00%
$0.00
0.00%
$4,982,534.00
2011
Planned Parenthood of Central Texas
$855,208.00
42.75%
$185,758.00
9.29%
$959,533.00
47.96%
$1,145,291.00
57.25%
$2,000,499.00
2011
ATTENTION
Planned Parenthood of Austin Family Planning
$882,918.00
67.01%
0.00%
$434,670.00
32.99%
$434,670.00
32.99%
$1,317,588.00
2011
ATTENTION
Planned Parenthood of Waco
$869,404.00
100.00%
0.00%
0.00%
$0.00
0.00%
$869,404.00
2011
Planned Parenthood of Austin Surgical and
Sexual Health Services
$4,001,540.00
100.00%
0.00%
0.00%
$0.00
0.00%
$4,001,540.00
2011
Planned Parenthood of West Texas
$1,061,061.00
33.72%
0.00%
$2,085,707.00
66.28%
$2,085,707.00
66.28%
$3,146,768.00
2011
ATTENTION
Planned Parenthood of Greater Texas Surgical
and Health Services
$2,018,191.00
100.00%
0.00%
0.00%
$0.00
0.00%
$2,018,191.00
2011
Planned Parenthood Gulf Coast
$10,498,306.00
50.76%
$837,719.00
4.05%
$9,344,425.00
45.18%
$10,182,144.00
49.24%
$20,680,450.00
2011
ATTENTION
Planned Parenthood Association of Hidalgo
County Texas Mission Unit
$1,059,596.00
24.47%
$3,270,536.00
75.53%
0.00%
$3,270,536.00
75.53%
$4,330,132.00
2011
ATTENTION
Planned Parenthood Center for Choice
$3,892,281.00
100.00%
0.00%
0.00%
$0.00
0.00%
$3,892,281.00
2011
Planned Parenthood Choice
$781,589.00
100.00%
0.00%
0.00%
$0.00
0.00%
$781,589.00
2011

Planned Parenthood Women’s Health Center
$533,532.00
100.00%
0.00%
0.00%
$0.00
0.00%
$533,532.00
2012
Planned Parenthood
$477,944.00
100.00%
0.00%
0.00%
$0.00
0.00%
$477,944.00
2012
Planned Parenthood Sexual Healthcare Services
$2,183,555.00
96.76%
0.00%
$73,207.00
3.24%
$73,207.00
3.24%
$2,256,762.00
2011
Planned Parenthood Association of Cameron
and Willacy Counties
$795,833.00
44.34%
$457,748.00
25.50%
$541,408.00
30.16%
$999,156.00
55.66%
$1,794,989.00
2011
ATTENTION
Utah
Planned Parenthood Association of Utah
$2,701,769.00
37.09%
$2,255,248.00
30.96%
$2,328,090.00
31.96%
$4,583,338.00
62.91%
$7,285,107.00
2012
ATTENTION
Vermont
Planned Parenthood of Northern New England
$18,730,353.00
99.84%
$30,314.00
0.16%
0.00%
$30,314.00
0.16%
$18,760,667.00
2011
Virginia
Planned Parenthood of Southeastern Virginia
$2,527,532.00
100.00%
0.00%
0.00%
$0.00
0.00%
$2,527,532.00
2011
Virginia League For Planned Parenthood
$2,740,096.00
100.00%
0.00%
0.00%
$0.00
0.00%
$2,740,096.00
2012
Washington
Planned Parenthood of Western Washington
$40,318,244.00
100.00%
0.00%
0.00%
$0.00
0.00%
$40,318,244.00
2011
Mt. Baker Planned Parenthood
$3,292,739.00
73.69%
$1,175,537.00
26.31%
0.00%
$1,175,537.00
26.31%
$4,468,276.00
2011
Planned Parenthood of Greater Washington and
North Idaho
$10,803,846.00
77.91%
$3,063,631.00
22.09%
0.00%
$3,063,631.00
22.09%
$13,867,477.00
2011
Washington D.C.
Planned Parenthood Association of
Metropolitan Washington DC
$7,598,465.00
91.19%
$733,863.00
8.81%
0.00%
$733,863.00
8.81%
$8,332,328.00
2011
Wisconsin
Planned Parenthood of Wisconsin
$21,130,619.00
81.00%
$4,955,794.00
19.00%
0.00%
$4,955,794.00
19.00%
$26,086,413.00
2011
TOTALS
$747,529,743.00
$126,309,128.00
$207,524,209.00
$333,833,337.00
$1,081,363,080.00
