
HEAS DEPARTMENT, UD, RTU
KOTA
Engineering Chemistry Laboratory
Manual
Page No.:
Engineering Physics Laboratory
Manual
(Common for All B. Tech Courses)
HEAS Department
University Department
Rajasthan Technical University, Kota

HEAS DEPARTMENT, UD, RTU
KOTA
Engineering Physics Laboratory
Manual
Vision of HEAS Department
To provide a sound foundation to the undergraduate
students by giving Quality education in basic
sciences along with moral ethics and effective
communication skills to become competent engineers
of tomorrow’s to serve the society.
Mission of HEAS Department
The Department is committed to train the young
graduates in basic sciences and inculcate ethical
values and social responsibilities through an
innovative teaching and learning methodology.

HEAS DEPARTMENT, UD, RTU
KOTA
Engineering Physics Laboratory
Manual
CO’s and CO’s - PO’s Mapping
Credit: 1 Max. Marks: 75
0L+0T+2P (IA: 50, ETE: 25)
Course Outcome for Engineering Physics Laboratory Classes
The students should be able to:
CO1
Develop the experimental skills and thinking capabilities.
CO2
Describe different phenomenon related to optics, Electronics and
material science through experimentation.
CO3
Implement the theoretical concepts of optics and electronics
through experimentation.
CO-PO Mapping for Engineering Physics Laboratory
Classes
(3-Strong, 2- Moderate and 1-
Weak)
CO
PO1
PO2
PO3
PO4
PO5
PO6
PO7
PO8
PO9
PO10
PO11
PO12
CO1
3
2
-
-
-
1
-
-
-
-
-
1
CO2
3
2
-
-
-
1
-
-
-
-
-
1
CO3
3
2
-
-
-
1
-
-
-
-
-
1

HEAS DEPARTMENT, UD, RTU KOTA
Engineering Physics Laboratory Manual
Program Outcomes (POs) (Common to all Branches):
PO1
Engineering knowledge: Apply the knowledge of mathematics, science,
engineering fundamentals, and an engineering specialization to the
solution of complex engineering problems.
PO2
Problem analysis: Identify, formulate, review research literature, and
analyze complex engineering problems reaching substantiated
conclusions using first principles of mathematics, natural sciences, and
engineering sciences.
PO3
Design/development of solutions: Design solutions for complex
engineering problems and design system components or processes that
meet the specified needs with appropriate consideration for the public
health and safety, and the cultural, societal, and environmental
considerations.
PO4
Conduct investigations of complex problems: Use research-based
knowledge and research methods including design of experiments,
analysis and interpretation of data, and synthesis of the information to
provide valid conclusions.
PO5
Modern tool usage: Create, select, and apply appropriate techniques,
resources, and modern engineering and IT tools including prediction and
modeling to complex engineering activities with an understanding of the
limitations.
PO6
The engineer and society: Apply reasoning informed by the contextual
knowledge to assess societal, health, safety, legal and cultural issues and
the consequent responsibilities relevant to the professional engineering
practice.
PO7
Environment and sustainability: Understand the impact of the
professional engineering solutions in societal and environmental
contexts, and demonstrate the knowledge of, and need for sustainable
development.
PO8
Ethics: Apply ethical principles and commit to professional ethics and
responsibilities and norms of the engineering practice.
PO9
Individual and team work: Function effectively as an individual, and as a
member or leader in diverse teams, and in multidisciplinary settings.
PO10
Communication: Communicate effectively on complex engineering
activities with the engineering community and with society at large, such
as, being able to comprehend and write effective report sanded sign
documentation, make effective presentations and give and receive clear
instructions.
PO11
Project management and finance: Demonstrate knowledge and
Understanding of the engineering and management principles and apply
these to one‘s own work, as a member and leader in a team, to manage
projects and in multidisciplinary environments.
PO12
Life-long learning: Recognize the need for, and have the preparation and
ability to engage in independent and life-long learning in the broadest
context of technological change.

HEAS DEPARTMENT, UD, RTU KOTA
Engineering Physics Laboratory Manual
Instructions for the students
Students are required to prepare two identical Physics practical note books.
One shall be day to day note book in which one has to record observations
(observation book) and another shall be usual one for recording the complete
experiment (Record Book). It is the Record Book which is to be signed by the
teacher after the completion of the practical where a after recording
observation of the practical observation book is to be signed by Lab.
Assistant/Teacher.
Students are required to bring their practical record books (Both) at every
turn, failing which they may not to be permitted to perform the experiment.
The details of both the notebooks are as follows :
OBSERVATION NOTE BOOK:
For each Experiment
(i) Write Object
(ii) Write Experiment number
(iii) Make all observation tables in which observations are to be recorded.
(iv) Before leaving the laboratory at each time, do not ever forget to get the
recorded observations signed by the Lab Assistant / Teacher.
RECORD BOOK:
(a) Write down the complete list of experiment to be performed in the
laboratory, at the start of the book.
(b) After completing each experiment, record it as follows :
(c) Experiment number and Date
(d) Object
(e) Apparatus
(f) Illustrated formula with notification explained and unit in which quantities
are measured.
(g) Labeled figures / diagrams/circuit diagrams (on first left hand page and to
be drawn by pencil.)
(h) Observation Tables.
(i) Calculation.
(j) Result with unit.
(k) Precautions, Comments (actually taken) and Criticism
Note: Method / Procedure are not to be written in record book.

Fill in the index of the record book for the experiment to be checked.
Grade on the index page of the record book will be awarded on the quality of
work and knowledge acquired.
Get the book signed by the teacher and obtains the grade for each experiment
on index page of the book.
Students will be allotted new experiment one turn earlier. They should read
about the experiment and precaution there in before starting the experiment.
Students will not be allowed to do next experiment if the previous experiment
has not been completed in all respect.
The write ups of all experiments are available in the lab. These write ups are
only guidelines to help the student to perform the experiment.
Students are required to get issued the apparatus and experiment write ups
from the Laboratory attendant by producing a slip mentioning the name of
experiment and write ups required by the student. The apparatus and write-ups
are to be returned back before leaving the lab.
Students shall handle the apparatus carefully and they should know the details
of the apparatus they are using. Mishandling the apparatus careless work or
stealing goods shall induce penal action.
Students should not touch the optical surfaces of the optical instruments i.e.
that of Prism Grating surfaces Lenses eye pieces etc.
Students are not allowed to displace/interchange /remove any apparatus from
their normal position without prior permission.
Students are required to disconnect electrical connection after completion of
the experiment. While using primary cell, please take out emulated zinc rod
from the cell when not in use.
Students are expected to perform all practical given in the list. Please note
carefully that in examination no change of practical is allowed.

7
HEAS DEPARTMENT, UD, RTU
KOTA
Engineering Physics Laboratory
Manual
LIST OF EXPERIMENTS
1. To determine the wave length of monochromatic light with the help of
Michelson’s interferometer. [K3 Level; CO3]
2. To determine the wave length of sodium light by Newton’s Ring. [K3 Level;
CO3]
3. To determine the wave length of prominent lines of mercury by plane
diffraction grating with the help of spectrometer. [K3 Level; CO2]
4. Determination of band gap using a P-N junction diode. [K3 Level; CO1]
5. To determine the height of given object with the help of sextant. [K3 Level;
CO1]
6. To determine the dispersive power of material of a prism with the help of
spectrometer. [K3 Level; CO3]
7. To study the charge and discharge of a condenser and hence determine the
same constant (both current and voltage graphs are to be plotted). [K1 Level;
CO2]
8. To determine the coherence length and coherence time of laser using He – Ne
laser. [K3 Level; CO1]
9. To measure the numerical aperture of an optical fibre. [K3 Level; CO3]
10. To study the Hall Effect and determine the Hall Voltage and Hall coefficients.
[K3 Level; CO1]

8
HEAS DEPARTMENT, UD, RTU
KOTA
Engineering Physics Laboratory
Manual
EXPERIMENT-1
OBJECT: To determine the wavelength of sodium light using Michelson’s
interferometer.
APPERATUS: Michelson’s Interferometer, sodium lamp, convex lens and reading
lamp.
DIAGRAM:
THEORY & FORMULA:
The interference developed by Michelson’s interferometer is by division of amplitude of
ray generated from a monochromatic source of light. The wavelength of sodium light can
be determined by the following formula
Where x
1
= Initial position of mirror M
1
of Michelson’s interferometer in cm.
x
2
= Final position of mirror M
1
of Michelson’s Interferometer in cm.
N= Number of fringes crossing the field of view of eyepiece.

9
HEAS DEPARTMENT, UD, RTU
KOTA
Engineering Physics Laboratory
Manual
PROCEDURE:
1. Using a scale make the distance of mirror M
1
and M
2
from point O nearly equal.
2. Place a cardboard with a pin hole between sodium lamp and glass plate G
1
. Now
see through the telescopic eye piece to observe two pair of images, one due to
partial reflection at the unsilvered face of G
1
and the mirrors M
1
and M
2
respectively and another due to partial reflection at the half silvered surface of G
1
and reflection at mirrors M
1
and M
2
respectively. The second pair of images will
be brighter than first one.
3. Use the tilting screws attached to mirrors into proper directions to coincide
brighter images. Now remove the pinhole screen. To achieve the fringes adjust the
screws attached to mirror M
2
and get circular fringes.
4. The mirror M
1
is attached with a micrometer screw (Screw gauge). Note the least
count of this measuring device. Adjust the position of mirror M
1
to bring the
centre of fringes at the centre of cross wire of eyepiece. Note down this position
on the scale of micrometer screw.
5. Now shift the mirror M
1
to pass fringes in the field of view of eyepiece. Count the
number of fringes and measure the corresponding position of mirror M
1
from the
scale. This procedure can be continued for different number of fringes passing
through the field of view of eyepiece.
6. Calculate the distance by which mirror M
1
has been shifted for different number
of fringes as indicated in the observation table.
7. Finally use the formula to calculate wavelength from this data.
10
HEAS DEPARTMENT, UD, RTU
KOTA
Engineering Physics Laboratory
Manual
OBSERVATION TABLE:
Least count of micrometer screw = cm.
S.No.
Number of
fringes
Reading of micrometer screw
Value of x = x
1-
x
2
in cm
Initial position of mirror
M
1
(x
1
)
Final position of mirror
M
1
(x
2
)
MS(cm)
CS(cm)
Total
MS(cm)
VS(cm)
Total
1
2
3
4
5
6
7
8
9
10
CALCULATIONS:
RESULT:
The wavelength of sodium light is = cm = A
0
Standard value =
Percentage error =
PRECATIONS:
1. Do not touch the face of mirrors and glass plates.
2. While taking observations, micrometer screw should be turned in one
direction to avoid back lash error.
3. The centre of fringes shall be at the centre of cross wire of eyepiece.
11
HEAS DEPARTMENT, UD, RTU
KOTA
Engineering Physics Laboratory
Manual
EXPERIMENT-2
OBJECT: To determine the wavelength of sodium light by Newton’s ring.
APPARATUS: A plano convex lens of large radius of curvature, travelling microscope,
optical arrangement for Newton’s ring, Sodium lamp.
THEORY & FORMULA:
The mean wavelength of D1 and D2 lines of sodium light is given by
= (D
n+p
2
– D
n
2
) / 4 p R
Where
D
n+p
= Diameter of (n+p)th ring, D
n
= Diameter of nth ring
n and p = Integers, R = given radius of curvature
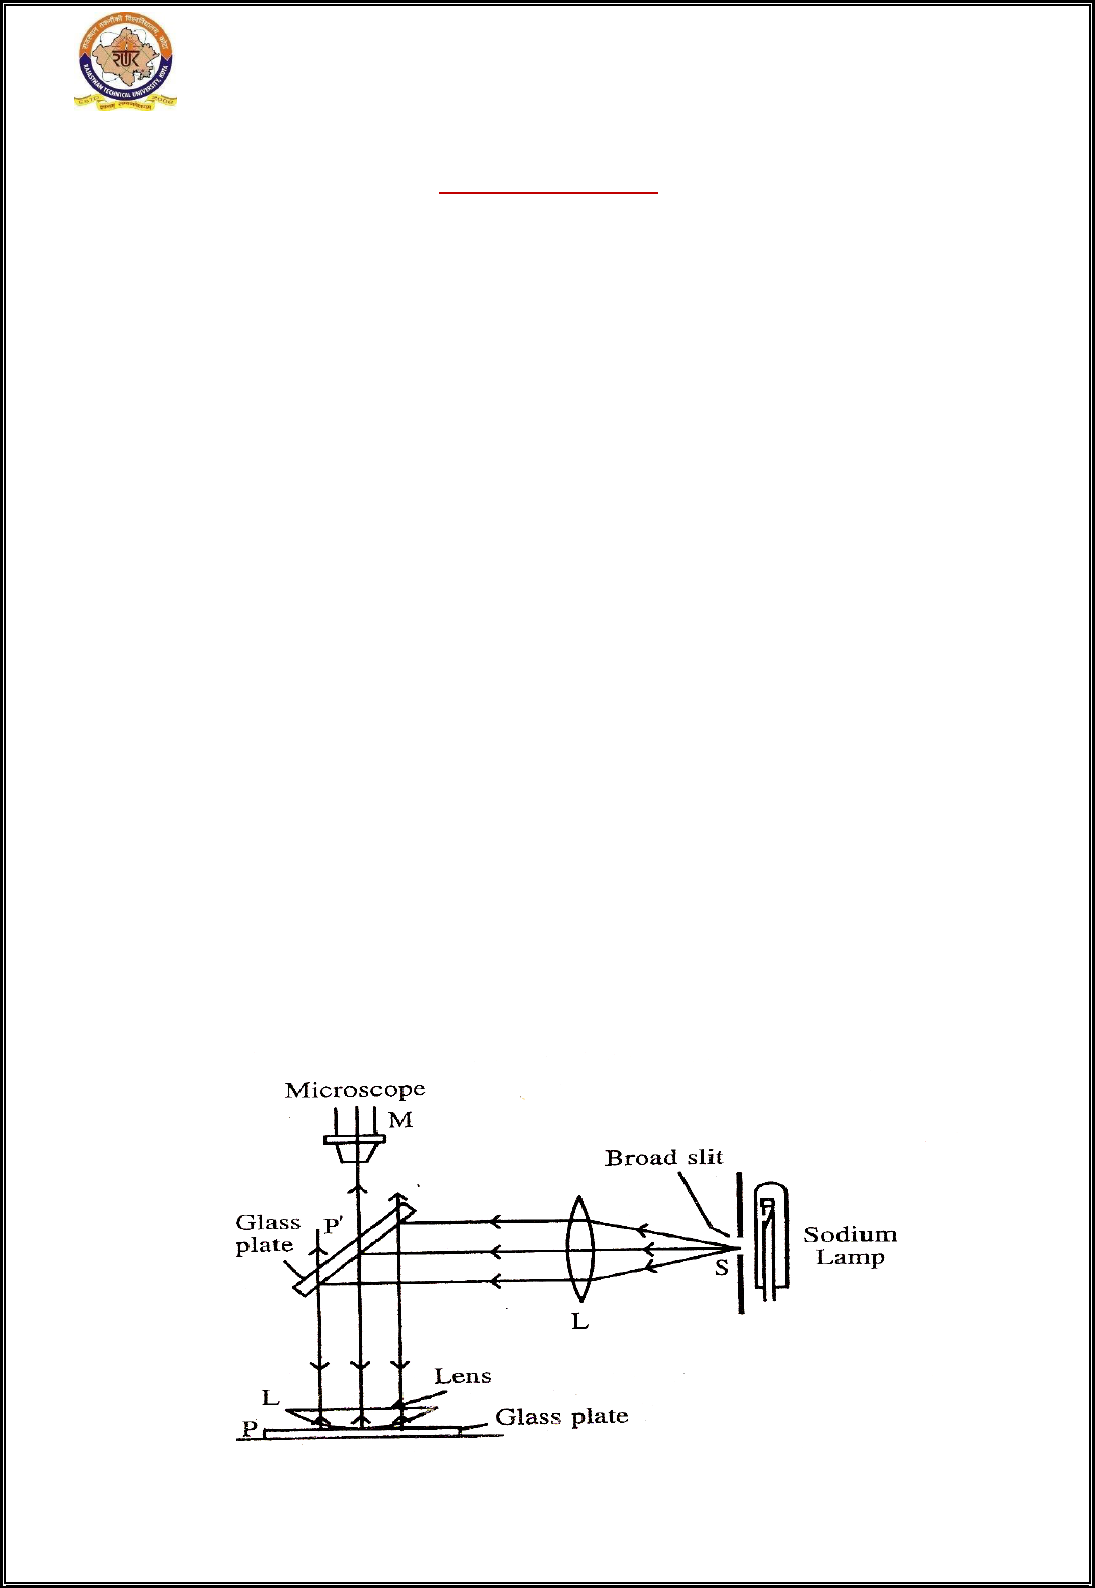
PROCEDURE & DIAGRAM:
1. The glass plate G in the Newton’s ring apparatus is set such that it makes an angle of
45 with the direction of incident light from the source and reflects the light on the
lens.
2. The Plano convex lens is placed below the microscope with its plane surface
upwards.
3. The microscope is moved in the vertical direction by means of rack and pinion
arrangement till the rings are seen distinctly.
Fig. 1

12
HEAS DEPARTMENT, UD, RTU
KOTA
Engineering Physics Laboratory
Manual
4. The centre of the fringes is brought symmetrically below the cross wires by adjusting
the position of the lens and the microscope. The microscope is moved in horizontal
direction to one side of the fringes such that one of the crosswire becomes tangential
to the 22nd ring. The reading on the scale is noted.
5. The microscope is moved and the cross wire is successively made tangential to the
20
th
, 18
th
and so on till the 22nd on the other side is reached. The reading on the scale
for all these position is noted.
Fig. 2
OBSERVATIONS:
One division of main scale x = 0.1cm
No of divisions on the vernier scale n = 100
Least count of the microscope x/n = 0.001 cm
S.
No
.
No. of
the
rings
Microscope reading
Diamet
er
D=a-b
cm
D
2
cm
2
(D
n+p
2
– D
n
2
)
cm
2
One end (a)
Other end (b)
m.s.
cm
v.s.
cm
Total
reading
a cm
m.s.
cm
v.s.
cm
Total
reading
b cm
1.
22
2.
20
3.
18
4.
16
5.
14
6.
12
7.
10
8.
8
Mean value of (D
n+p
2
– D
n
2
) = cm
2
for p = 8

13
HEAS DEPARTMENT, UD, RTU
KOTA
Engineering Physics Laboratory
Manual
CALCULATION:
= (D
n+p
2
– D
n
2
) / 4 p R
Where i) Radius of Curvature = 110 cm
ii) p = 8
RESULT:
Mean wavelength of sodium light = A
Standard value = 5893 A
Percentage error =
PRECAUTIONS:
1. The glass plate surface and the lens surface must be thoroughly cleaned otherwise
the fringes will not be bright and sharp
2. The microscope's eyepiece must be properly focused on its cross wire.
3. In order to avoid backlash error, the microscope should be given motion only
along one direction.
4. Number of fringes should be measured accurately

14
HEAS DEPARTMENT, UD, RTU
KOTA
Engineering Physics Laboratory
Manual
EXPERIMENT-3
OBJECT: To determine the wavelength of prominent lines of mercury by plane
diffraction grating with the help of spectrometer.
APPARATUS: Spectrometer, mercury lamp, diffraction grating, reading lens, spirit
level etc.
THEORY: The wavelength of light emitted by the source is given by
= {(e+b) Sin }/ n
Where
= Wavelength of light, e+b = Grating element
= angle of diffraction n = order of spectrum
PROCEDURE:
(A) Setting of the Spectrometer:
1. Setting of the Telescope
(a) The telescope is first turned towards some white wall; the eyepiece is
shifted w.r.t. The cross wires till a sharp image of the cross wires is
obtained. The eyepiece is now fixed.
(b) The telescope is focused on a distant object and the parallax between
the image and the cross wires is removed. Thus the telescope is set for
parallel rays.
2. Setting of the collimator
The position of the lens of the collimator is adjusted such that a sharp and
well-defined image is seen through the telescope.
3. Setting of the Prism table
The prism table is first made perfectly horizontal with the help of spirit
level and the leveling screws. The height of the prism table must be on the
axis of collimator and telescope.
15
HEAS DEPARTMENT, UD, RTU
KOTA
Engineering Physics Laboratory
Manual
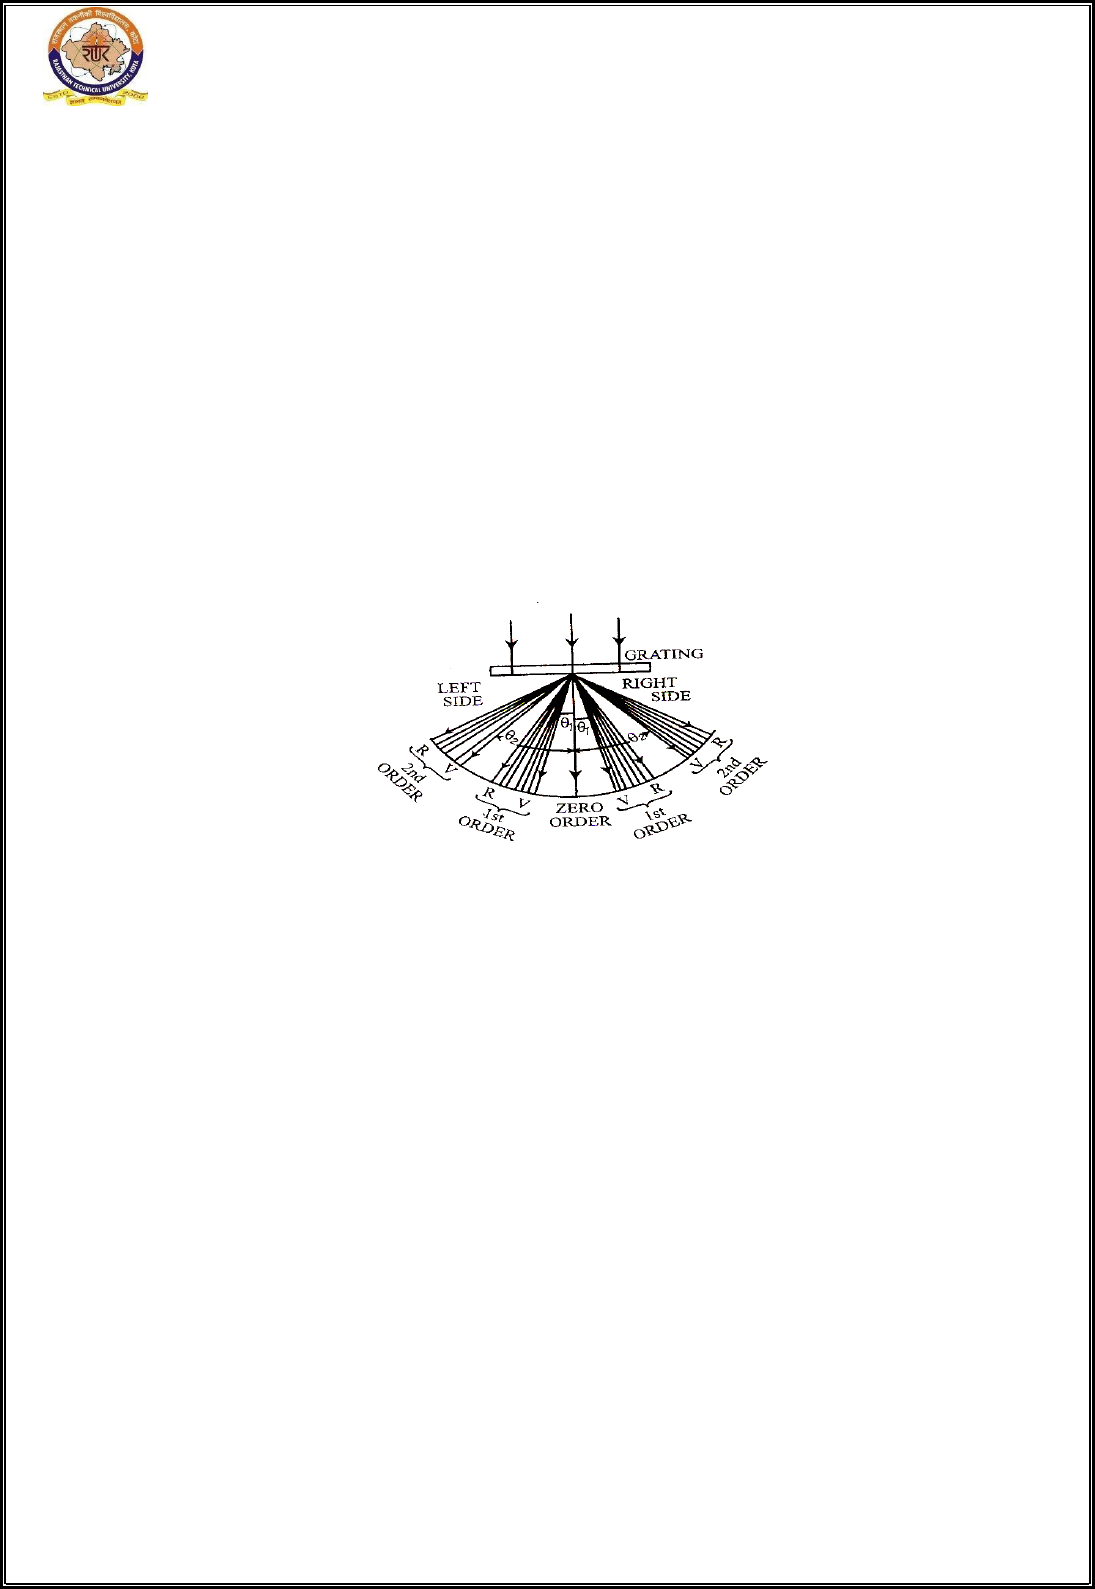
(B) Adjustment for determination of the angle of diffraction:
1. The telescope is turned towards left or right and the first line of first
order spectrum is seen on the cross wire. The angular position of the
telescope is determined with the help of both the verniers V1 and V2.
2. Now the telescope is turned in the opposite direction and again the first
line of the first order spectrum is viewed on the cross wire. Again the
angular position of the telescope is noted on both the verniers. The
difference of two verniers taken above is equal to twice the angle of
diffraction. Hence half of this difference gives the angle of diffraction .
Fig 1
3. The grating element is determined from the number of lines per inch
supplied by the manufacturer. Finally wavelength of each spectral line is
determined from (e +b), and n.
OBSERVATIONS:
(a) Determination the grating element:
Number of lines per inch on grating = 15,000
Grating element (e+b) = 2.54/15,000 = 1.69 10
-4
cm.
Order of spectrum = 1
(b)Determination the angle of diffraction:
Value of the one division of vernier scale = 0.5 degree
Total number of vernier divisions = 30
Least count of the vernier = 0.5 / 30 = 1/60 = 1min.

16
HEAS DEPARTMENT, UD, RTU
KOTA
Engineering Physics Laboratory
Manual
S.
No.
Colour
of light
Vernier
Towards right of
the central image
Towards left of
the central image
2 =
a-b
Mean
M.S.
V.S
.
T.R.
(a)
M.S.
V.S.
T.R.
(b)
1.
Violet
V1
V2
2.
Green
V1
V2
3.
Yellow
V1
V2
CALCULATIONS:
(A) For violet Colour,
V
= {(e+b) Sin }/ n =
(B) For green Colour,
G
= {(e+b) Sin }/ n =
(C) For yellow Colour,
Y
= {(e+b) Sin }/ n =
RESLUT:
Mean Wavelengths
V
=………….,
G
=………….,
Y
=…………..
Standard value:
V
= 4358 A,
G
= 5460A,
Y
= 5790A
Percentage error =
PRECAUTIONS:
1. The slit should be as narrow as possible but the knife-edges of the slit
should not touch each other.
2. The telescope and the collimator should be separately set for parallel
rays.
3. Grating should be set normal to the incident light
4. While taking observations the telescope and the prism table must be
clamped.

17
HEAS DEPARTMENT, UD, RTU
KOTA
Engineering Physics Laboratory
Manual
EXPERIMENT-4
OBJECT: Determination of band gap using a P-N junction diode.
APPARATUS: PN junction diode, micrometer (0-50) A, battery, thermometer and heater.
THEORY & FORMULA:
If I be the reverse current flowing through pn junction diode at temperature
T, then
I = A
s
exp [-q E
g
/ KT]
or log
10
I = log
10
A
s
– 5.036 (E
g
) 10
3
/T
Where E
g
in V.
The graph plotted between log
10
I and 10
3
/T comes out be a straight line as
shown in Fig. 2 whose slope is given by
AB / BC = 5.036 ( E
g
)
or ( E
g
) = 0.198 AB / BC
PROCEDURE:
1. The electrical connections are made as shown in the diagram Fig. (1). It
should be noted that positive terminal of the battery is connected to N
and negative terminal to P terminal of the diode for reverse bias.
2. Heater is heated in a calorimeter up to 70
o
-80
o
C. The temperature is
noted for various values of current as the diode cools down.

18
HEAS DEPARTMENT, UD, RTU
KOTA
Engineering Physics Laboratory
Manual
3. A graph is platted between (10
3
/T) along X-axis and log
10
I along Y-axis
and the slope of this line is determined from the graph.
Fig. 2
OBSERVATIONS TABLES:
S.
No.
Current I (A)
Temperature of diode
T
10
3
/T
log
10
I
in
o
C
in K
1
2
3
4
5
6
7
8
9
10
CALCULATIONS:
From the graph,
Slope = AB / BC =
Energy gap E
g
= 0.198 AB /BC = …………eV

19
HEAS DEPARTMENT, UD, RTU
KOTA
Engineering Physics Laboratory
Manual
RESULT & CONCLUSIONS:
The energy band gap for a given semiconductor = ……eV
Standard value for Germanium = 0.72 eV
Standard value for Silicon = 1.10 eV
Percentage error = ……
PRECAUTIONS:
1. The diode should be reverse biased.
2. The reverse bias should not be increased beyond a certain limit
otherwise it may get damaged.
3. The cooling rate should be slow so that the diode gets necessary time to
attain the temperature of the liquid.
4. The liquid should not be heated beyond 70
o
-80
o
C.

20
HEAS DEPARTMENT, UD, RTU
KOTA
Engineering Physics Laboratory
Manual
EXPERIMENT-5
OBJECT: To determine the height of given object with the help of sextant.
APPARATUS: A Sextant, Measuring Tape etc
DIAGRAM:
Fig. 1
Fig. 2
THEORY: If H is height of given object α and β are the angles subtended by the object
at two places Rand S in the same horizontal plane then by geometry of
figure, we can write.
tan α
And
tan β

21
HEAS DEPARTMENT, UD, RTU
KOTA
Engineering Physics Laboratory
Manual
Or h cot α = (PR)……………………………….1
And h cot β = (PR + d)…………………………….2
Subtracting (1) from (2), we get
D= h (cot β-cot α)………………………………….3
Or
PROCEDURE:
1 Determine the least count of circular and vernier scales.
2 Make a reference mark on the given object in level of your eyes
3 Move away from building by a considerable distance and select some place on
the ground. Mark the position on their place, (say R) Now standing there point
the telescope towards that reference mark. Direct image of marks will be
visible through the transparent part of half silver mirror. Rotate the arm of
sextant and get the reflected image of the reference mark by the mirror M. use
micrometer screw so that these two images coincide. Note down this reading
of vernier and main scale. It gives zero reading at that place.
4 Now rotate the arm so that rays from top of object fall on the mirror and after
reflection reach the telescope. In this position you will see two images (a) the
direct image of reference mark, (b) the doubly reflected image of the top of the
object. Clamp the arm by tangent screw and adjust arm so that these two image
completely coincide on the cross wires. Note down this reading. This gives the
angular elevation of top with respect to the reference mark. Add or subs tract
from it the zero reading as the case may be it gives the angle α.
5 Now move away from the reference mark, say through a distance of 3 to 5
meter at point S. Again find the zero reading at this place. Repeat steps 3 and 4
and get the new angular elevation β at this place.
6 Find out the distance between two places of observation (R&S) by using a
measuring tape.
7 Knowing α β and d determine h. This will be the height of given object from
the reference mark.
8 To get the set of readings, change d and similarly determine the values of h,
then determine the mean height.
OBSERVATION :
1 LEAST COUNT OF CIRCULAR SCALE: …………………
2 LEAST COUNT OF VERNIER SCALE: …………………..

22
HEAS DEPARTMENT, UD, RTU
KOTA
Engineering Physics Laboratory
Manual
OBSERVATION TABLE FOR α
OBSERVATION TABLE FOR β
S.No
Distance
between
two places
in cm(d)
Zero reading when
reference mark are
coinciding
Reading whe top is
coinciding with
reference mark
β =(b-a)
MS
CS
TOTAL
MS
CS
TOTAL
1
2
3
4
CALCULATIONS:
Using above formula the values of h can be determined from the measured values of d, α
and β. Height of given object h= ……m
S.No.
Zero reading when
reference mark are
coinciding
Reading whe top is
coinciding with reference
mark
α=(b-a)
Mean
α
MS
CS
TOTAL
MS
CS
TOTAL
1
2
3
4

23
HEAS DEPARTMENT, UD, RTU
KOTA
Engineering Physics Laboratory
Manual
RESULT: The height of given object above reference = …………..meters
Total height of given object from ground =height of reference + height with respect to
reference.
PRECAUTIONS:
1. Plane of index arm should be parallel to the moving arm and normal to the plane
of the circular arc.
2. At the position of zero reading both mirrors M
1
and M
2
should be parallel to
each other.
3. While taking reading the plane of the fixed arm and index arm should be kept
vertical.
4. The telescope should be directed towards the centre of horizon glass M
2
.
24
HEAS DEPARTMENT, UD, RTU
KOTA
Engineering Physics Laboratory
Manual
EXPERIMENT-6
OBJECT: To determine the dispersive power of material of a prism with the help of
spectrometer.
APPARATUS: A spectrometer, Mercury lamp in wooden box, Prism, sprit level,
Magnifying glass etc.
Diagram:
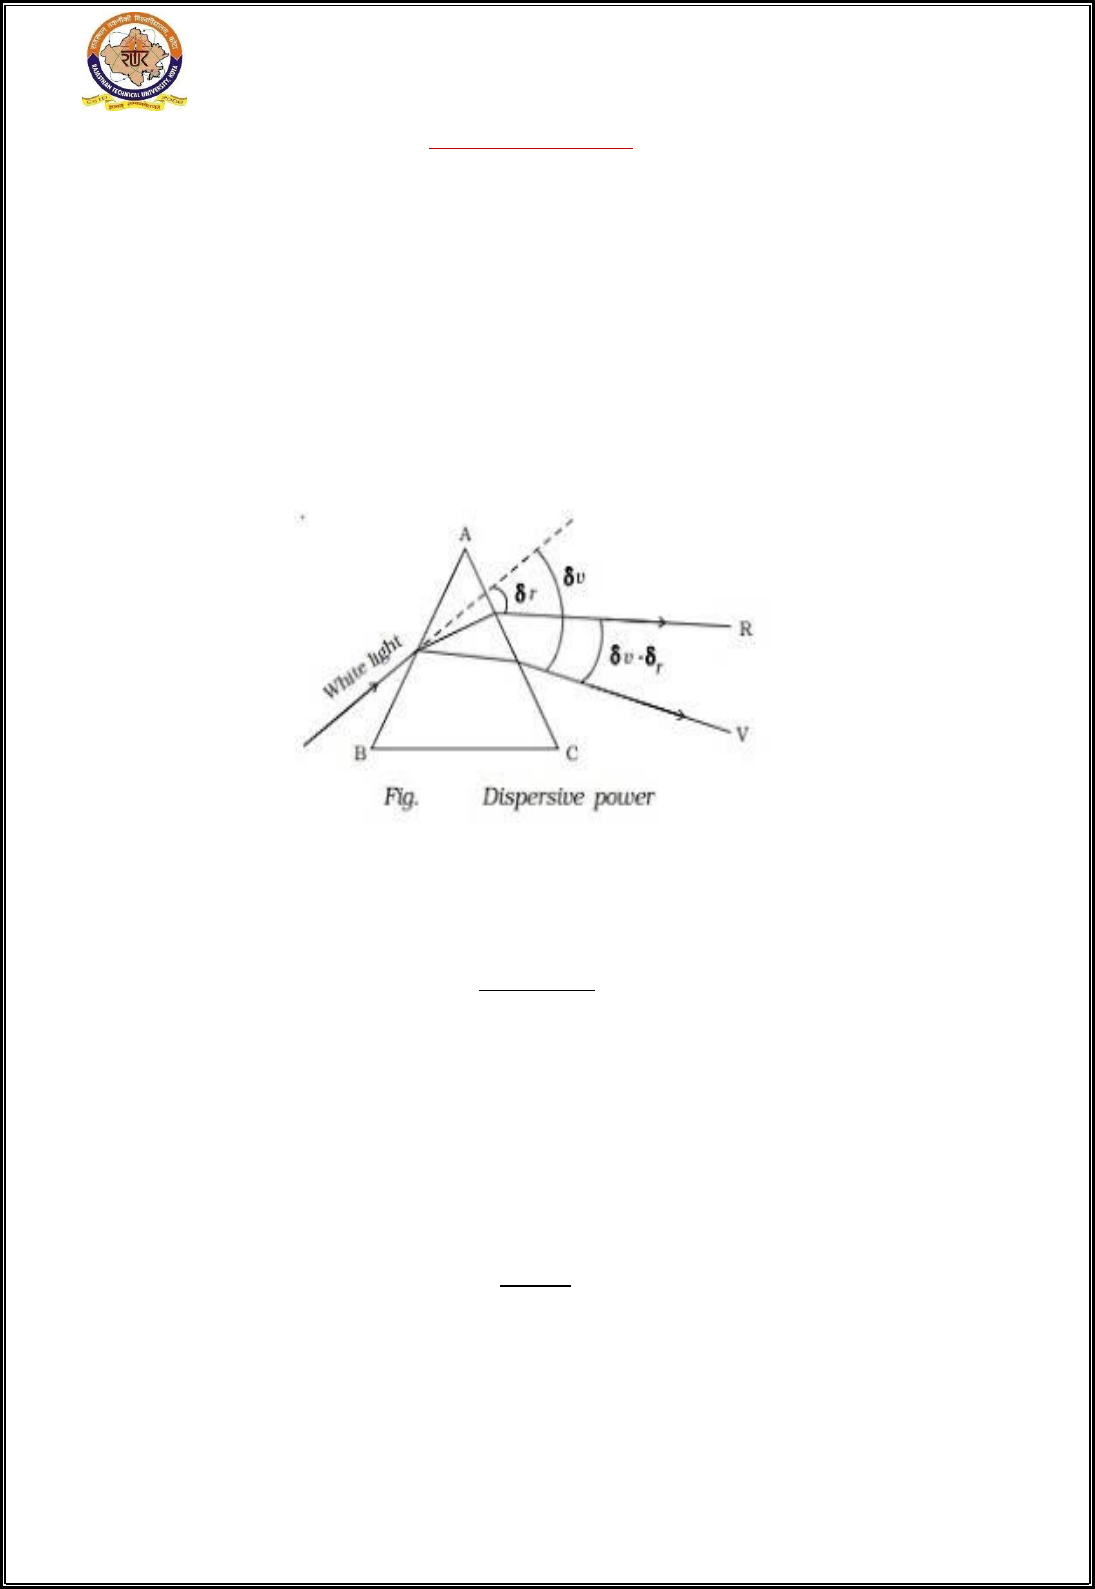
FORMULA: The refractive index can be defined by the following formula
μ
δ
Where
μ = Refractive index
A = Prism angle in degree
δm = Angle of minimum deviation in degree
The dispersive power of material of prism is expressed by following formula
ω =
μμ
μ
Where
ω = dispersive power
μ
V
= refractive index for violet color
μ
R
= refractive index for red color
μ
Y
= refractive index for yellow color

25
HEAS DEPARTMENT, UD, RTU
KOTA
Engineering Physics Laboratory
Manual
Method:
1. IIIuminate the slit with the mercury light and adjust the telescope for perfect image of
slit.
2. To measure the prism angle: First determine the least count of both the vernier scale of
spectrometer. Put the prism on prism table so that its edge A is kept turned towards the
collimator. Thus half of the light from collimator falls on faces AB and half on AC.
Now turn the telescope in the horizontal place and locate the image of slit reflected
from face AC. Note down the position of two vernier scale V
1
and V
2
. Now turn
telescope towards the other side of prism facing AB. Focus it on the image of slit.
Note down this position of two vernier scales V
1
and V
2
.
3. The difference between the two readings of same vernier taken on both side will give
the angles through which the telescope has been rotated. Let this angle be 2a. From the
figure above it is clear that half angle will be the angle of prism a. For more accurate
results repeat above procedure two to three times.
4. To determine the angle of minimum deviation δ
m
: Put the prism on table in such a way
that one of its reflecting surface AB lies normal to rays falling from collimator. Now
rotate the prism through a very small angle to view the spectrum in the field of view of
eyepiece.
5. Now rotate the prism in same direction and follows the image of red line through the
telescope. Due to rotating of prism, angle of incidence increases, decreasing the angle
of deviation. Slowly go on rotating the prism, the angle of deviation will go on
diminishing. A stage will come when angle of deviation and therefore the image of
line shall start turning back. This gives the position of minimum deviation. Note down
this position of telescope on both the various scales V
1
and V
2
. Let this position be
denoted by X.
6. Remove the prism and rotate the telescope after unclamping so that it directly face the
collimator. Clamp the telescope any by adjusting the tangent screw being the image of
slit cross wire. This direct reading gives the direction of incident rays. Note down the
position be denoted by Y.
7. To get the angle of minimum deviation calculate difference between two reading of
same vernier for two position of telescope i.e. δ
m
=(x-y). Determine mean δ
m
and
calculate the refractive index.
8. Similarly determine the angle of minimum deviation for other lines (for violet, yellow
lines). Similarly refractive index can be calculated for violet and yellow colors.
9. Knowing μv, μr and μy calculate dispersive power by using the formula:
ω =
μμ
μ

26
HEAS DEPARTMENT, UD, RTU
KOTA
Engineering Physics Laboratory
Manual
OBSERVATION:
Least Count of vernier Scale =...........................
Table for determination of A
S.
NO.
Vernier
Scale
reading
When reflection
take Place at the
face AC
When reflection
take place at the
face AB
Difference
of readings
of the same
vernier
Mean
θ
a
MS
VS
Total
MS
VS
Total
1.
V
1
2.
V
1
Table for determination of δ
m:
S.
NO.
Vernier
Scale
reading
Reading for
minimum deviation
position
Reading for direct
slit position
Difference of
readings of the
same vernier
Mean
θ
MS
VS
Total
MS
VS
Total
1.
V
1
V
2
2.
V
1
V
2
3.
V
1
V
2
Calculation:
i. Angle of prism A =..................................
ii. Angle of minimum deviation for Red color δ
mr
=...................................
iii. Angle of minimum deviation for yellow color δ
my
=...................................
iv. Angle of minimum deviation for violet color δ
mv
=...................................
Calculate refractive index μ
V,
μ
R,
μ
Y
μ
δ
Calculate dispersive power by using formula:
ω =
μμ
μ

27
HEAS DEPARTMENT, UD, RTU
KOTA
Engineering Physics Laboratory
Manual
RESULT: The dispersive power of the material of prism ω =...............................
PRECAUTIONS:
1. The slit should be as narrow as possible but two knife edges of the slit should not
touch each other.
2. The adjustments of the telescope, collimator and the prism table should be
accurately done.
3. The height of the prism table should be so adjusted that the light must fall on the
whole surface of the prism.
4. The prism table and the telescope must be clamped while taking readings.
1.
28
HEAS DEPARTMENT, UD, RTU
KOTA
Engineering Physics Laboratory
Manual
EXPERIMENT-7
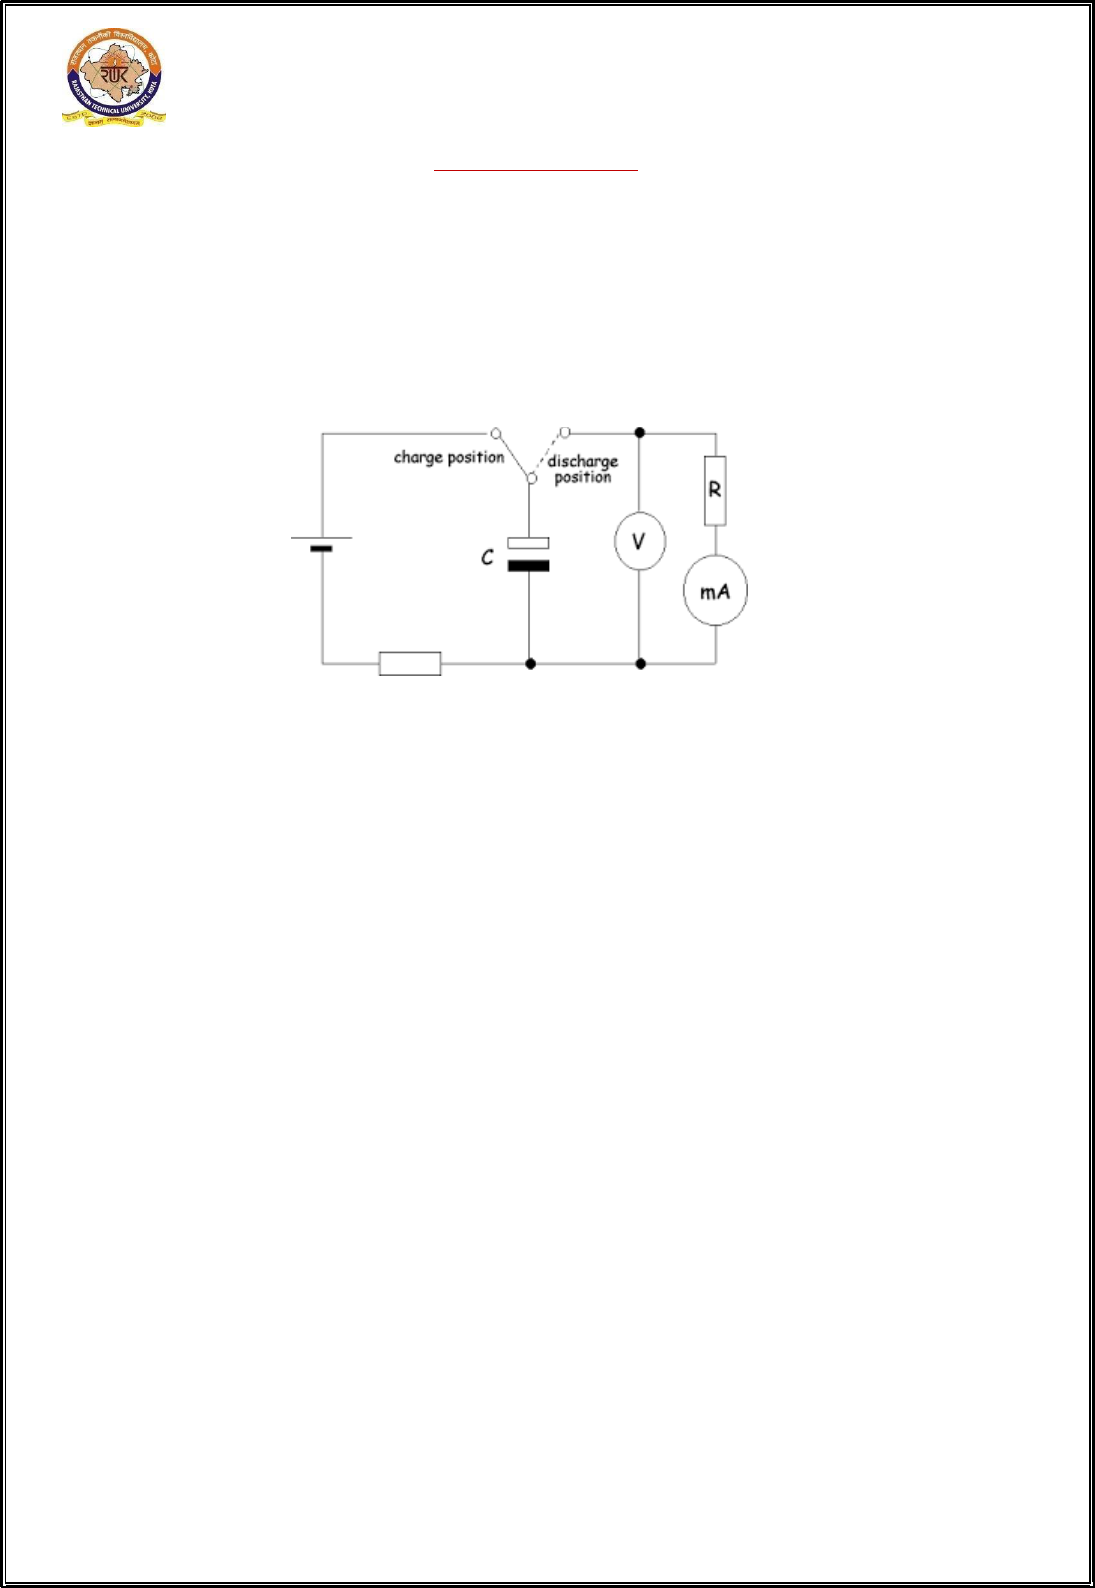
OBJECT: To study the charge and discharge of a condenser and hence determine the
time constant.
APPARATUS: Network board RC-2 with regulated power supply, connecting cable,
stop watch etc.
DIAGRAM:
FORMULA:
(a) The expression for charge voltage and current during charge and discharging of a
condenser C are as following
For Charging For Discharging
q = q
0
(1-e
-ţ/RC
) q= q
0
-e
-ţ/RC
V = V
0
(1-e
-ţ/RC
) V = V
0-
e
-ţ/RC
I = I
0
(1-e
-ţ/RC
) I = I
0
-e
-ţ/RC
(b) The Time constant = RC
Where q
0
and q are maximum and instantaneous values of charge in coulomb, V
0
and
V are maximum and instantaneous values of voltage in volt. I
0
and I are maximum
and instantaneous values of current in amps. Is time constant in seconds R is
resistance in ohms C is capacitance in farad.
PROCEDURE:
1 Select the value of R and C on network Board such that theoretical value of time
constant = RC is close to 100 sec. ( Chose as possible)
2 Connect the circuit as shown in figure where S
1
and S
2
both are open and capacitor
is fully charged.
3 Close switch S and immediately start a stop watch. This will start the charging of
the capacitor.

29
HEAS DEPARTMENT, UD, RTU
KOTA
Engineering Physics Laboratory
Manual
4 Reading in voltmeter will increase while current in millimeter will decrease.
Record reading of volt meter and millimeter after 15 sec. till voltage reaches a
maximum one becomes constant and current a minimum.
5 Now open switch Sand close switch s condenser will start discharging across R
reading in volt meter will decrease where as reading in millimeter will also start
decreasing in opposite direction. Take their readings after every 15 sec.
OBSERVATION:
Theoretical value of time constant = RC…….sec.
R = …………………….ohm, C = …………………….fared
Time
(T sec.)
0
1
5
30
45
60
75
90
105
120
135
150
CHARGE
(V volts)
(I mA)
DISCHARGE
(V volts)
(I mA)
Note: keep on taking the readings until the voltage becomes constant (Both charging
&discharging)
CALCULATION:
(a) For charging of condenser :
Plot a graph in volt and time and other in current and time (These graphs will
look like as bellow).

30
HEAS DEPARTMENT, UD, RTU
KOTA
Engineering Physics Laboratory
Manual
If maximum voltage reached is V
0
then time constant is the time corresponding to the
point where the voltage is 0.63 V
0
compair it with theoretical value RC.
(b) For discharging of condenser
Plot one graph in voltage and time and other in current and time (These graphs
will look like as above).
Find time constant which is the time corresponding to the point where voltage is 0.37 V
0
compare it with theoretical value.
RESULT:
Analyze your observations and graphs carefully to report following:
(1) The time constant for charging …………………….sec. (Calculated)
(2) The time constant for charging …………………….sec. (Graphical)
(3) The percentage error in time constant ………………(Sec)
(4) The time constant for discharging ……………..sec. (Calculated)
(5) The time constant for discharging ……………..sec. (Graphical)
(6) The percentage error in time constant ………………(Sec)

31
HEAS DEPARTMENT, UD, RTU
KOTA
Engineering Physics Laboratory
Manual
PRECAUTIONS:
1. The value of resistance R and capacity C must be so chosen that the time contant
of the circuit is large.
2. The pointer of the ammeter must be in the middle otherwise during discharge, it is
likely to break on account of deflection in the opposite direction.
3. For the measurement of time, a timer or metronome or a sensitive stop watch must
be used.
4. The charge on condenser also leaks through voltmeter. To reduce it, voltmeter of
high resistance i.e. high range must be used. The source voltage must also be high.
32
HEAS DEPARTMENT, UD, RTU
KOTA
Engineering Physics Laboratory
Manual
EXPERIMENT-8
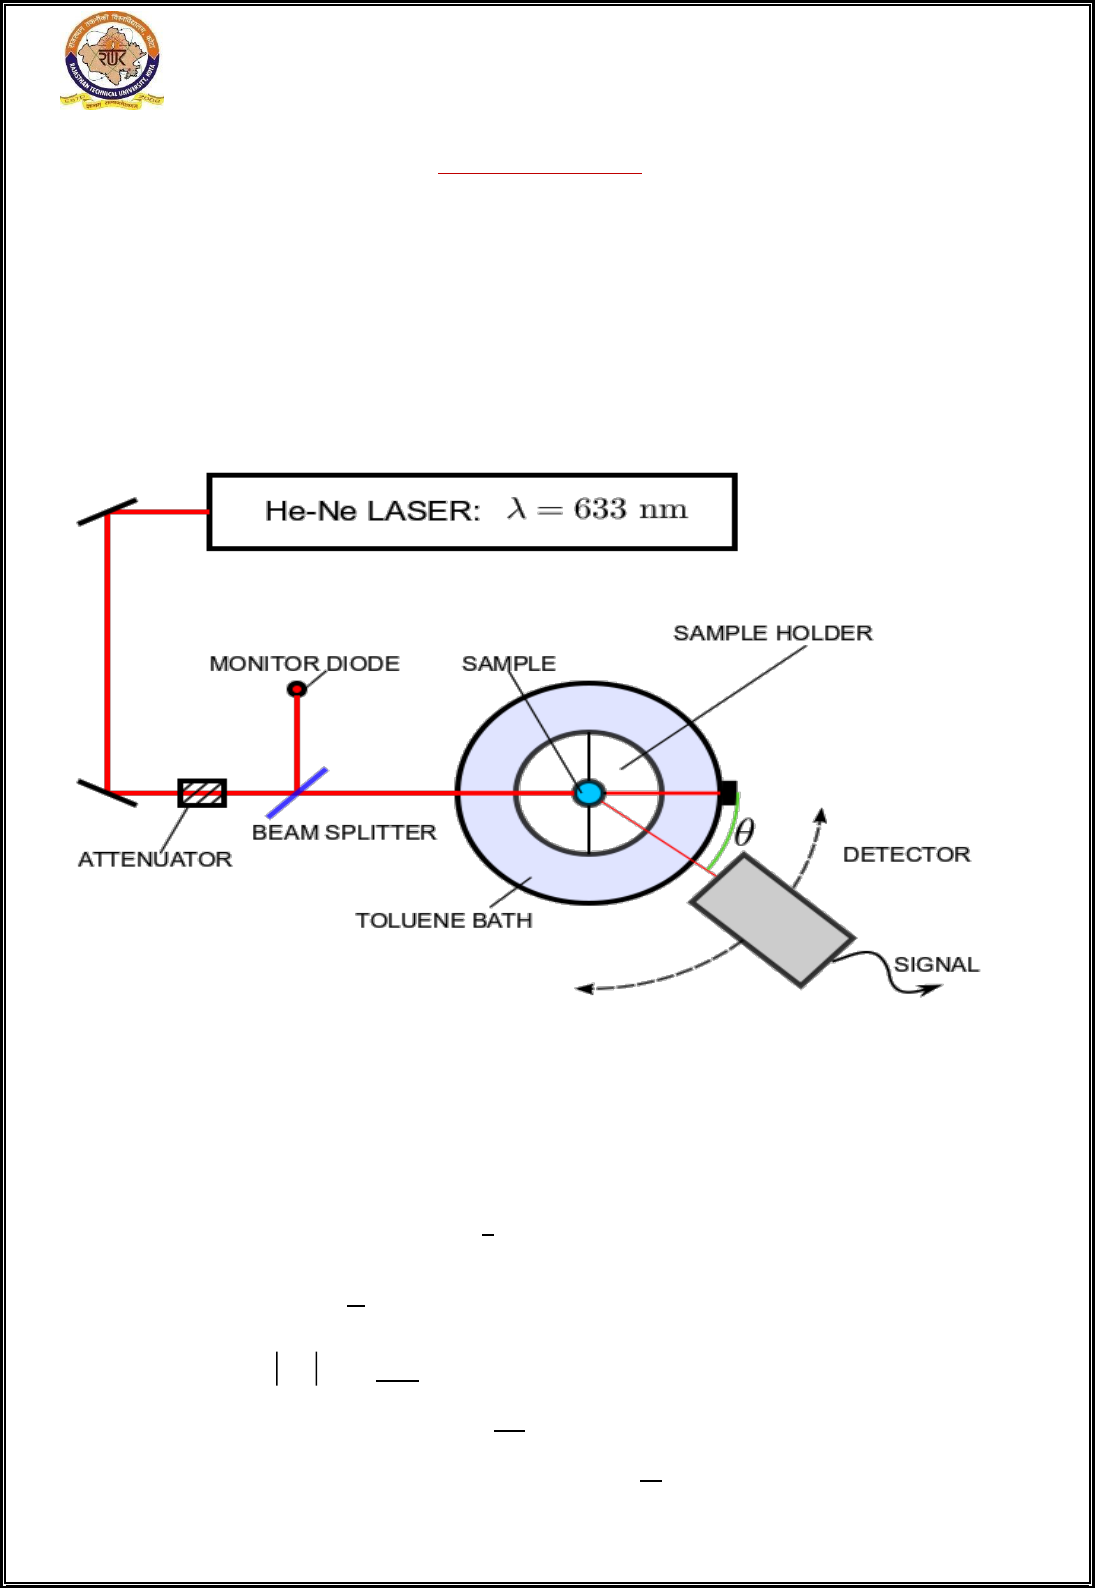
OBJECT: To determine the coherent length and coherent time of laser using He-Ne
laser.
APPARATUS: Laser source with power supply (=63.28), Spectrometer without
collimator and telescope (with two holders one for laser source and another for laser
detector), diffraction grating, etc.
Diagram:
THEORY AND FORMULA:
For light waves =
----------------------- (1)
Differentiating, we get
ʎ
ʎ
Coherence time
λ
---------------------- (2)
Hence coherence length
λ
Ǫ Spectral purity wavelength

33
HEAS DEPARTMENT, UD, RTU
KOTA
Engineering Physics Laboratory
Manual
PROCEDURE:
1. Put the laser source on a holder attached to the base spectrometer on one side of
circular table and put detector on another holder attached to the base of
spectrometer on other side of circular table, and connect this detector to digital
ammeter.
2. The height of laser source and laser detector is kept same.
3. Place the diffraction grating on circular table and incident the laser rays
perpendicularly on it as shown in Fig.
4. To calculate the angle of diffraction, adjust the laser source on first holder and
clamp it and by slow-motion screw set the laser detector so that the reading of
digital ammeter is maximum.
5. Note the reading on the vernier scales V
1
and V
2
6. Now bring the laser detector on the first order spectrum, on either side of the
normal and note the reading of the two scales V
1
and V
2
when digital ammeter
shows maximum current.
7. The difference between the either side readings gives double the angle of
diffraction.
8. Repeat the above procedure for higher order of spectrum.
OBSERVATION TABLE:
S.N
O.
Order
of
spectrum
Vernier
Scale
Readin
g
Spectrum to the left of
the direct image
Spectrum to the right of
the direct image
2θ =
a - b
Mean
θ
M.S.
V.S.
Total
reading
(a)
M.S.
V.S.
Total
reading
(b)
1.
First
order
V
1
V
2
2.
Second
order
V
1
V
2
3.
Third
order
V
1
V
2
(A) Least count:
Smallest man scale division(x)................... degrees.
Total no. of division on vernier scale (n).....................
Least count =
=....................
34
HEAS DEPARTMENT, UD, RTU
KOTA
Engineering Physics Laboratory
Manual
(B) The no. of lines ruled per inch on the grating N=.........................
Grating element (a + b) =
=....................cm
(C) The wavelength λ =
Put n =1,2,3,........ for first order, second order third order spectrum.....
Then mean wavelength
(D) Calculation of coherence length:
,
etc.
Coherence length (
)
λ
=
λ
=
,
=
λ
=
Coherence length
(E) Coherence time:
RESULT:
The wavelength of laser light (λ) =............Å
Coherence length of laser ʟ = ..............Å
Coherence time =...............................sec.
PRECAUTIONS:
1. Clamping of laser detector and table must be proper.
2. Reading of both the vernier scales at both windows is essential.
3. Grating should be cleaned properly.
4. Laser beam is very injurious for eyes so do not see it directly.

35
HEAS DEPARTMENT, UD, RTU
KOTA
Engineering Physics Laboratory
Manual
EXPERIMENT-9
Object: To measure the numerical aperture of an optical fiber.
Apparatus: Laser source, fiber optic chuck, optical fiber, screen, graph paper, etc.
Diagram:
Fig.2
Theory and formula:
Numerical aperture is a measure of how much light can be collected by an optical fiber. It
is related to acceptance angle, which indicates the size of cone of light that can be
accepted by fiber. The numerical aperture is defined as
NA= n
0
Sinθ
max
(1)
Where n
0
is the refractive index of the incidence medium and θ
max
is the maximum angle
at which optical ray can enter and propagate in the fiber.

36
HEAS DEPARTMENT, UD, RTU
KOTA
Engineering Physics Laboratory
Manual
Thus NA= Sin θ
max
for air as incidence medium.
For step index fiber the NA is given by
(2)
Where n
1
is refractive index of core and n
2
is refractive index of cladding.
From the above diagram
(3)
NA=
(4)
Where d= Diameter of the circle on screen
l= Distance between output end of optical fiber and screen
PROCEDURE:
1 Mount both the ends of the optical fiber on the fiber optic chuck.
2 Couple the light from the laser source onto one of the fiber end.
3 Place the screen at some distance from the output end (end other than at which
light is coupled) of the fiber such that it is perpendicular to the axis of the
fiber.
4 Now move the screen towards or away the output ends of the optical fiber,
such that a circular spot is formed on the screen.
5 Measure the distance between the output end of optical fiber and screen. Let it
be l.
6 The diameter of the circle on screen can be measured by putting a graph paper
on the screen.
7 Repeat the above procedure for different values of l and d and record
observation in table. Calculate the average value of numerical aperture.
Observation table:
S.
No
.
Distance of
screen from
chuck (l)
Diameter of central spot
( along x-axis)
Diameter of central spot
( along Y-axis)
Average
d=
X
1
X
2
X
2
-X
1
= d
1
Y
1
Y
2
Y
2
-Y
1
= d
2
1
2
.
10

37
HEAS DEPARTMENT, UD, RTU
KOTA
Engineering Physics Laboratory
Manual
Calculation:
NA and maximum angle of acceptance are calculated using the formula:
NA=
The maximum angle of acceptance is θ
m
= Sin
-1
(NA)
RESULT:
(1) Numerical Aperture (NA) of the optical fiber is ……………………..
(2) The maximum angle of acceptance is……………………………………..
PRECAUTIONS:
1. Optical source should be properly aligned with the cable.
2. Distance of the launch point from cable should be properly selected to ensure that
maximum amount of optical power is transferred to the cable.
3. The optical fibre provided should be handled carefully so as to prevent cracks.

38
HEAS DEPARTMENT, UD, RTU
KOTA
Engineering Physics Laboratory
Manual
EXPERIMENT-10
OBJECT: To study Hall Effect and determine Hall voltage and Hall coefficient.
APPERATUS: Electromagnet, Gauss meter, Mill voltmeter, Hall Effect experimental set
up, hall probe containing semiconductor sample.
FIGURE:
THEORY &FORMULA:
If a current carrying conductor is placed in transverse magnetic field, an electric field is
generated inside the conductor in a direction perpendicular to both the current and the
magnetic field. This phenomenon is called Hall Effect and electric field so generated is
called Hall field. A rectangular specimen of a semiconductor of width b and thickness t is
placed between poles of an electromagnet such that magnetic field is applied along z
direction. The hall voltage V
H
can be measured with the help of two probes placed at the
centre of top and bottom surface of sample. To determine Hall coefficient following
formula can be used
in m
3
/coloumb.
Where V
H
= Hall voltage in volts
B
z
= Magnetic field applied along z axis in weber / m
2
I
x
= Current along x axis in amperes
t= thickness of sample in meters
39
HEAS DEPARTMENT, UD, RTU
KOTA
Engineering Physics Laboratory
Manual
PROCEDURE:
1. Place the specimen in the magnetic field and make connections as shown in
diagram.
2. Allow some current I
x
with the help of rheostat to flow through the semiconductor
specimen along x axis. Measure hall voltage V
H
by Milivoltmeter and V
x
by
voltmeter.
3. Change value of I
x
and note corresponding change in V
H
and V
x
.Then plot a
graph between V
H
and I
x
. This graph will be a straight line. The slope of this graph
will provide the ratio V
H
/ I
x
.
4. Measure magnetic field B with gauss meter or flux meter and find the actual field
B
z
=µB.
OBSERVATION:
1. Permeability of the specimen µ=
2. Magnetic field B= Weber/m
2
3. Thickness of the specimen t= meters
OBSERVATION TABLE:
S.
No.
Current I
x
in amperes
Applied voltage V
x
in volts
Hall voltage V
H
in volts
1
2
3
4
5
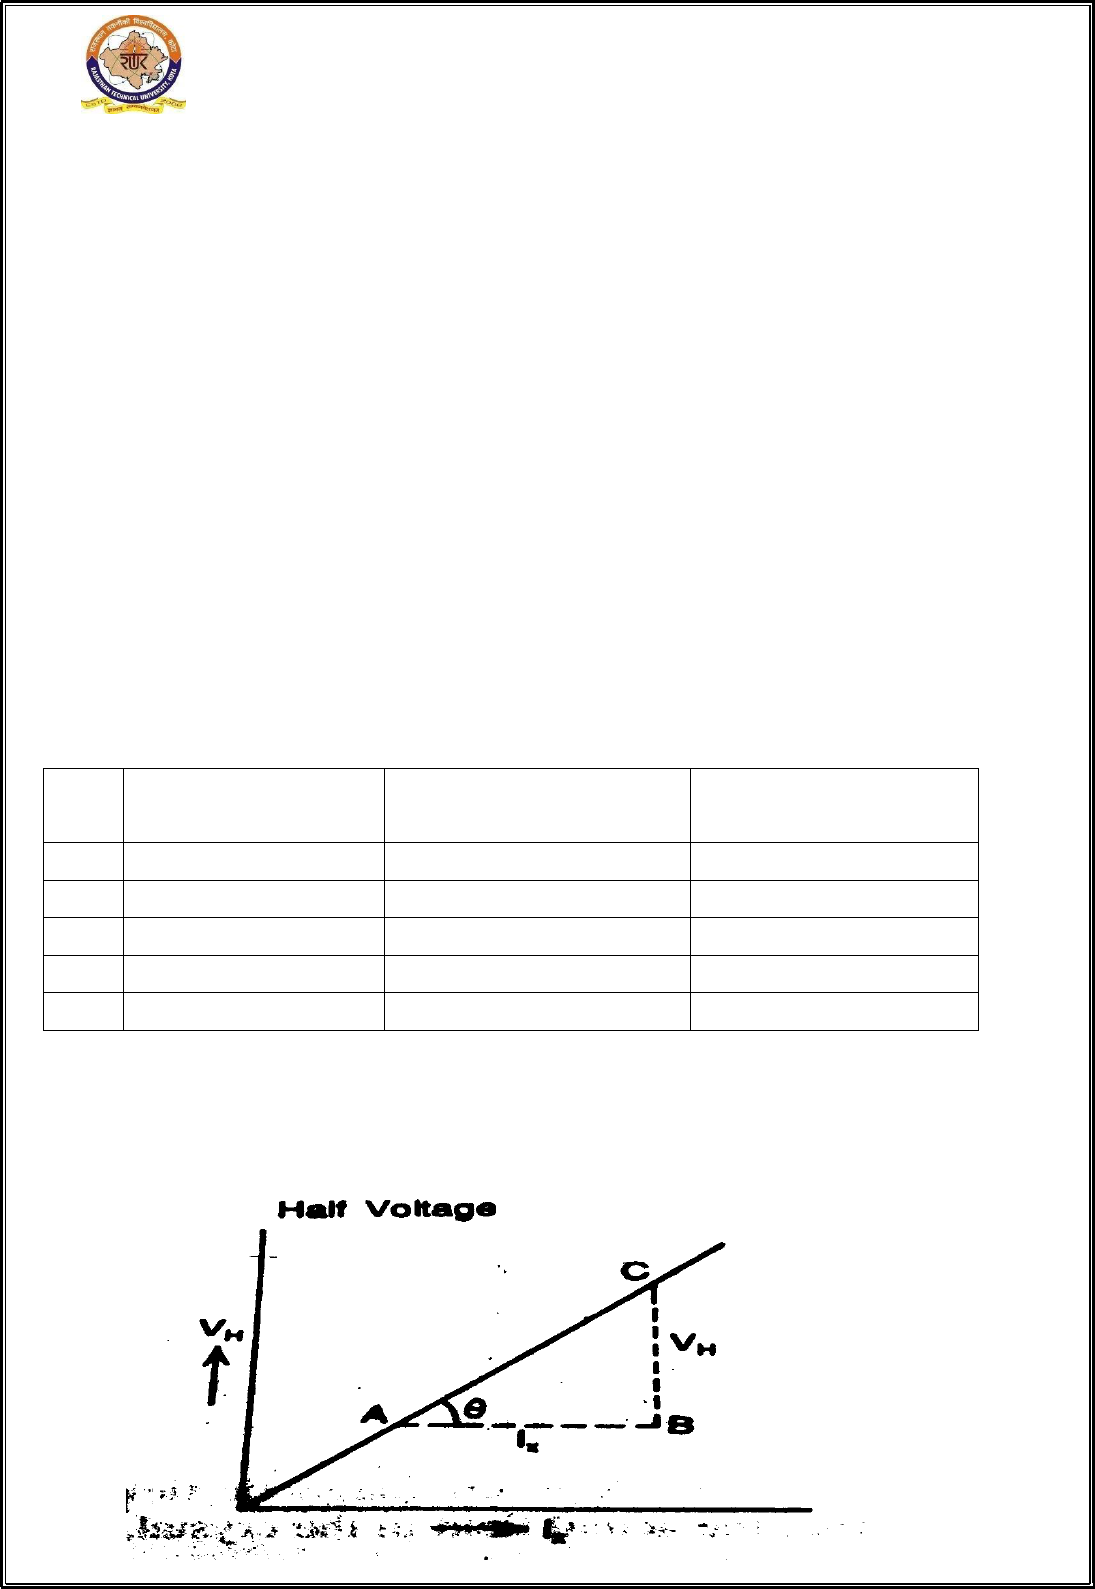
CALCULATIONS:
A graph is plotted between V
H
and I
x
. The slope of this graph will provide the ratio
V
H
/I
x
.

40
HEAS DEPARTMENT, UD, RTU
KOTA
Engineering Physics Laboratory
Manual
The Hall coefficient can be calculated by using this slope and the formula
in m
3
/coloumb.
RESULT:
Hall coefficient
= m
3
/ coulomb
PRECAUTIONS:
1. Hall voltage developed is a small quantity and should be measured with accuracy.
2. Current through the specimen shall be in permissible limits.
3. Do not disturb the specimen once fixed to measure the parameters accurately.
