
1
CORPORATE DATA
Historical Selected Financial Data
Shiseido Company, Limited and Subsidiaries
For the fiscal years ended March 31, 2014 to December 31, 2022
Notes: 1. The fiscal year ended December 31, 2015 is the 9 months from April 1, 2015 to December 31, 2015 for Shiseido and its consolidated subsidiaries in Japan and the 12 months from January 1,
2015 to December 31, 2015 for all other subsidiaries. In this report, it is referred to as “the year ended December 2015” in the text and as “2015/12” in tables, charts, and graphs.
2. Amounts of less than one million yen are omitted.
3. EBITDA (Earnings before interest, taxes, depreciation and amortization)* = Profit (loss) before Income Taxes + Interest expense + Depreciation and amortization expense + Impairment loss
* EBITDA includes depreciation and amortization and impairment loss included in the loss on COVID-19 recorded in extraordinary losses.
4. Net profit (loss) per share (primary) is based on the average number of shares outstanding during the fiscal year. Net assets per share is calculated using the number of shares
outstanding as of the balance sheet date. Net profit (loss) per share is calculated before dilution.
5. Return on invested capital = Operating profit × (1 – Tax rate*) / (Interest-bearing debt + Equity)**
* Tax rate = Total income tax / Profit (loss) before income tax ** (Interest-bearing debt + Equity) is the average of the beginning and the ending balances.
6. Interest-bearing debt to net EBITDA ratio = (Interest-bearing debt* – Cash and time deposits**) / EBITDA*
* Interest-bearing debt is the ending balance. ** Cash and time deposits are the term-end sum of cash and time deposits and short-term investment securities in current assets
7. Net debt-equity ratio = (Interest-bearing debt – Cash and time deposits) / Equity* *Equity = Total net assets – Stock acquisition rights – Non-controlling interests in consolidated subsidiaries
8. Days Sales of Inventory = Average Inventory ÷ (Cost of Goods Sold ÷ 365)
9. Cash Conversion Cycle (days) = Receivables turnover period (days) + Inventory turnover period (days) – Payables turnover period (days) (average of each indicator during the period)
10. Dividend on equity = Total dividends paid (full year) / Equity* *Equity is the average of the beginning and the ending balances.
11. The number of employees at year-end does not include temporary employees.
12. Shiseido has been recognizing payables associated with Dolce&Gabbana and Tory Burch from the fiscal years 2016 and 2020, respectively. For the fiscal year ended December 31, 2021,
the interest-bearing debt ratio including these payables was 26.4%, the net debt-equity ratio was 0.04, and interest-bearing debt was ¥195,722 million.
Japanese GAAP
Millions of yen
(Except per-share data)
IFRS
Millions of yen
(Except per-share data)
Thousands of U.S. dollars
(Except per-share data)
2014/3 2015/3 2015/12 2016/12 2017/12 2018/12
2019/12 2020/12 2021/12 2021/12 2022/12 2022/12
Operating Results:
Opereating Results:
Net sales 762,047 777,687 763,058 850,306 1,005,062 1,094,825
1,131,547 920,888 1,035,165 Net Sales 1,009,966 1,067,355 8,093,380
Cost of sales 189,559 196,433 196,009 207,553 231,327 231,928
254,844 238,401 262,959 Cost of sales 271,808 323,191 2,450,645
Selling, general and administrative expenses 522,843 553,640 529,388 605,972 693,298 754,545
762,871 667,523 730,619 Selling, general and administrative expenses 767,007 721,722 5,472,566
Operating profit 49,644 27,613 37,660 36,780 80,437 108,350
113,831 14,963 41,586 Core operating profit 42,553 51,340 389,293
EBITDA 91,285 90,703 80,635 90,078 154,741 150,318
169,348 71,393 172,556 EBITDA 94,516 102,371 776,244
Net profit (loss) attributable to owners of parent 26,149 33,668 23,210 32,101 22,749 61,403
73,562 (11,660) 42,439
Profit attributable to owners of parent
46,909 34,202 259,342
Financial Position:
Financial Position:
Total assets 801,346 823,636 808,547 934,590 949,425 1,009,618
1,218,795 1,204,229 1,179,360 Total assets 1,300,979 1,307,661 9,915,537
Short-term interest-bearing debt 64,054 75,615 18,996 16,557 10,662 15,202
144,949 75,565 25,394 Short-term interest-bearing debt 41,013 49,747 377,214
Long-term interest-bearing debt 91,864 31,281 67,617 104,022 70,801 60,574
103,159 248,733 165,588 Long-term interest-bearing debt 264,824 250,026 1,895,860
Interest-bearing debt 155,918 106,897 86,613 120,580 81,463 75,776
248,108 324,299 190,983 Interest-bearing debt 305,837 299,774 2,273,082
Equity 338,561 386,860 391,664 392,963 423,447 448,580
496,437 484,289 545,022 Equity attributable to owners of parent 540,695 604,259 4,581,885
Cash Flows:
Cash Flows:
Cash flows from operating activities 84,320 32,134 60,529 59,129 95,392 92,577
75,562 64,045 122,887 Cash flows from operating activities 134,249 46,735 354,375
Cash flows from investing activities (16,799) 11,538 (23,137) (70,640) (1,061) (103,112)
(202,823) (70,084) 63,739 Cash flows from investing activities 66,733 (41,308) (313,224)
Cash flows from financing activities (47,462) (58,419) (30,151) 22,378 (53,117) (29,722)
113,678 46,880 (176,222) Cash flows from financing activities (190,575) (52,418) (397,467)
Free cash flow 67,521 43,673 37,392 (11,510) 94,331 (10,535)
(127,261) (6,039) 186,627 Free cash flow 200,983 5,427 41,151
Cash and cash equivalents at end of period 110,163 100,807 104,926 113,122 156,834 111,767
97,466 136,347 156,503 Cash and cash equivalents at end of period 156,503 119,036 902,608
Per-Share Data (in yen and U.S. dollars):
Per-Share Data (in yen and U.S. dollars):
Net profit (loss) 65.7 84.4 58.2 80.4 56.9 153.7
184.2 (29.2) 106.2 Basic earnings per share 117.4 85.6 0.65
Net assets 849.4 970.0 981.4 984.1 1,059.8 1,123.2
1,242.9 1,212.3 1,364.3 Equity attributable to owners of parent per share 1,353.5 1,512.4 11.47
Cash dividend 20.0 20.0 20.0 20.0 27.5 45.0
60.0 40.0 50.0 Cash dividend 50.0 100.0 0.76
Weighted average number of shares outstanding
during the period (thousands)
398,300 398,704 399,026 399,227 399,466 399,409
399,411 399,458 399,480
Weighted average number of shares outstanding
during the period (thousands)
399,480 399,538
Financial Ratios:
Financial Rations:
Operating margin (%) 6.5 3.6 4.9 4.3 8.0 9.9
10.1 1.6 4.0 Core Opereating margin (%) 4.2 4.8
Return on invested capital (%) 5.9 4.1 4.6 5.0 10.4 13.1
12.9 1.3 3.3 Return on invested capital (%) 2.9 5.2
Return on equity (%) 8.4 9.4 6.0 8.2 5.6 14.1
15.6 (2.4) 8.2
Return on equity attributable to owners of parent (%)
9.3 6.0
Equity ratio (%) 42.2 47.0 48.4 42.0 44.6 44.4
40.7 40.2 46.2 Ratio of equity attributable to owners of parent (%) 41.6 46.2
Net interest-bearing debt to EBITDA ratio (times) 0.3 (0.2) (0.5) (0.1) (0.6) (0.3)
0.8 2.4 0.1 Net Interest-bearing dect to EBITDA ratio (times) (0.1) 0.3
Net debt-equity ratio (times) 0.08 (0.04) (0.10) (0.02) (0.22) (0.11)
0.28 0.36 0.03 Net debt-equity ratio (times) (0.02) 0.05
Inventory Turnover (Days) 168.28 182.97 197.97 194.85 193.78 220.12
236.96 268.80 217.78 Inventory Turnover (Days) 199.51 149.69
CCC (Cash Conversion Cycle) (days) 139 143 146 123 114 126
149 199 169 CCC (Cash Conversion Cycle) (days) 155 128
Payout ratio (consolidated) (%) 30.5 23.7 34.4 24.9 48.3 29.3
32.6 — 47.1 Dividend Payout ratio (consolidated) (%) 42.6 116.8
Dividend yield (%) 1.1 0.9 0.8 0.7 0.5 0.7
0.8 0.6 0.8 Dividend yield (%) 0.8 1.5
Dividend on equity (%) 2.6 2.2 2.1 2.0 2.7 4.1
5.1 3.3 3.9
Dividends on equity attributable to owners of parent (%)
4.0 7.0
Number of employees at year-end 33,054 33,000 33,783 36,549 37,438 38,640
40,000 39,035 35,318 Number of employees at year-end 35,318 33,414
Net sales per employee 23.1 23.6 22.6 23.2 26.8 28.3
28.3 23.6 29.3 Net sales per employee 28.6 31.9 242
Operating profit per employee 1.5 0.8 1.1 1.0 2.1 2.8
2.8 0.4 1.2 Core operating profit per employee 1.2 1.5 12
010_0252087912303.indd 1010_0252087912303.indd 1 2023/04/12 20:09:372023/04/12 20:09:37
2
Shiseido | Integrated Report 2022
13. In November 2015, the Financial Accounting
Standards Board (“FASB”) issued Accounting
Standards Update (“ASU”) No. 2015-17, “Income
Taxes (Topic 740): Balance Sheet Classification of
Deferred Taxes” (“ASU 2015-17”). The standard
requires that deferred tax assets and liabilities be
classified as non-current on the balance sheet rather
than being separated into current and non-current.
Effective from the first quarter of 2017, affiliates in the
Americas have adopted ASU 2015-17 on a
retrospective basis. Accordingly, the Company
reclassified the current deferred taxes to non-current
in the consolidated balance sheet as of December 31,
2016.
Notes: 1. Amounts of less than one million yen are omitted.
2. U.S. dollar amounts are converted from yen, for convenience only, at the rate of ¥131.88 = US$1 prevailing on December
31, 2022 Fractions resulting from the translations are rounded.
3. EBITDA = Core operating profit + Depreciation and amortization
4. Basic Earnings per Share is based on the average number of shares outstanding during the fiscal year. Equity Attributable
to Owners of Parent per Share is calculated using the number of shares outstanding as of the balance sheet date. Basic
Earnings per Share is calculated before dilution.
5. ROIC = Core operating profit × (1 – tax rate) ÷ (Interest-bearing debt (average of the beginning and the ending balances,
excluding lease liabilities) + Equity attributable to owners of parent (average of the beginning and the ending balances))
6. Net interest-bearing debt to EBITDA ratio = (Outstanding interest-bearing debt (excluding lease liabilities) – Cash and
cash equivalents – Time deposits over three months) ÷ EBITDA*1 *1 EBITDA = Core operating profit + Depreciation and
amortization
7. Net debt-equity ratio = (Interest-bearing debt (excluding lease liabilities) – Cash and time deposits) / Equity attributable to
owners of parent
8. Days Sales of Inventory = Average Inventory ÷ (Cost of Goods Sold ÷ 365)
9. Cash Conversion Cycle (days) = Receivables turnover period (days) + Inventory turnover period (days) – Payables
turnover period (days) (average of each indicator during the period)
10. Dividends on Equity Attributable to Owners of Parent = Total dividends paid (full year) / Equity Attributable to Owners of
Parent* *Equity Attributable to Owners of Parent is the average of the beginning and the ending balances.
11. The number of employees at year-end does not include temporary employees.
Japanese GAAP
Millions of yen
(Except per-share data)
IFRS
Millions of yen
(Except per-share data)
Thousands of U.S. dollars
(Except per-share data)
2014/3 2015/3 2015/12 2016/12 2017/12 2018/12
2019/12 2020/12 2021/12 2021/12 2022/12 2022/12
Operating Results:
Opereating Results:
Net sales 762,047 777,687 763,058 850,306 1,005,062 1,094,825
1,131,547 920,888 1,035,165 Net Sales 1,009,966 1,067,355 8,093,380
Cost of sales 189,559 196,433 196,009 207,553 231,327 231,928
254,844 238,401 262,959 Cost of sales 271,808 323,191 2,450,645
Selling, general and administrative expenses 522,843 553,640 529,388 605,972 693,298 754,545
762,871 667,523 730,619 Selling, general and administrative expenses 767,007 721,722 5,472,566
Operating profit 49,644 27,613 37,660 36,780 80,437 108,350
113,831 14,963 41,586 Core operating profit 42,553 51,340 389,293
EBITDA 91,285 90,703 80,635 90,078 154,741 150,318
169,348 71,393 172,556 EBITDA 94,516 102,371 776,244
Net profit (loss) attributable to owners of parent 26,149 33,668 23,210 32,101 22,749 61,403
73,562 (11,660) 42,439
Profit attributable to owners of parent
46,909 34,202 259,342
Financial Position:
Financial Position:
Total assets 801,346 823,636 808,547 934,590 949,425 1,009,618
1,218,795 1,204,229 1,179,360 Total assets 1,300,979 1,307,661 9,915,537
Short-term interest-bearing debt 64,054 75,615 18,996 16,557 10,662 15,202
144,949 75,565 25,394 Short-term interest-bearing debt 41,013 49,747 377,214
Long-term interest-bearing debt 91,864 31,281 67,617 104,022 70,801 60,574
103,159 248,733 165,588 Long-term interest-bearing debt 264,824 250,026 1,895,860
Interest-bearing debt 155,918 106,897 86,613 120,580 81,463 75,776
248,108 324,299 190,983 Interest-bearing debt 305,837 299,774 2,273,082
Equity 338,561 386,860 391,664 392,963 423,447 448,580
496,437 484,289 545,022 Equity attributable to owners of parent 540,695 604,259 4,581,885
Cash Flows:
Cash Flows:
Cash flows from operating activities 84,320 32,134 60,529 59,129 95,392 92,577
75,562 64,045 122,887 Cash flows from operating activities 134,249 46,735 354,375
Cash flows from investing activities (16,799) 11,538 (23,137) (70,640) (1,061) (103,112)
(202,823) (70,084) 63,739 Cash flows from investing activities 66,733 (41,308) (313,224)
Cash flows from financing activities (47,462) (58,419) (30,151) 22,378 (53,117) (29,722)
113,678 46,880 (176,222) Cash flows from financing activities (190,575) (52,418) (397,467)
Free cash flow 67,521 43,673 37,392 (11,510) 94,331 (10,535)
(127,261) (6,039) 186,627 Free cash flow 200,983 5,427 41,151
Cash and cash equivalents at end of period 110,163 100,807 104,926 113,122 156,834 111,767
97,466 136,347 156,503 Cash and cash equivalents at end of period 156,503 119,036 902,608
Per-Share Data (in yen and U.S. dollars):
Per-Share Data (in yen and U.S. dollars):
Net profit (loss) 65.7 84.4 58.2 80.4 56.9 153.7
184.2 (29.2) 106.2 Basic earnings per share 117.4 85.6 0.65
Net assets 849.4 970.0 981.4 984.1 1,059.8 1,123.2
1,242.9 1,212.3 1,364.3 Equity attributable to owners of parent per share 1,353.5 1,512.4 11.47
Cash dividend 20.0 20.0 20.0 20.0 27.5 45.0
60.0 40.0 50.0 Cash dividend 50.0 100.0 0.76
Weighted average number of shares outstanding
during the period (thousands)
398,300 398,704 399,026 399,227 399,466 399,409
399,411 399,458 399,480
Weighted average number of shares outstanding
during the period (thousands)
399,480 399,538
Financial Ratios:
Financial Rations:
Operating margin (%) 6.5 3.6 4.9 4.3 8.0 9.9
10.1 1.6 4.0 Core Opereating margin (%) 4.2 4.8
Return on invested capital (%) 5.9 4.1 4.6 5.0 10.4 13.1
12.9 1.3 3.3 Return on invested capital (%) 2.9 5.2
Return on equity (%) 8.4 9.4 6.0 8.2 5.6 14.1
15.6 (2.4) 8.2
Return on equity attributable to owners of parent (%)
9.3 6.0
Equity ratio (%) 42.2 47.0 48.4 42.0 44.6 44.4
40.7 40.2 46.2 Ratio of equity attributable to owners of parent (%) 41.6 46.2
Net interest-bearing debt to EBITDA ratio (times) 0.3 (0.2) (0.5) (0.1) (0.6) (0.3)
0.8 2.4 0.1 Net Interest-bearing dect to EBITDA ratio (times) (0.1) 0.3
Net debt-equity ratio (times) 0.08 (0.04) (0.10) (0.02) (0.22) (0.11)
0.28 0.36 0.03 Net debt-equity ratio (times) (0.02) 0.05
Inventory Turnover (Days) 168.28 182.97 197.97 194.85 193.78 220.12
236.96 268.80 217.78 Inventory Turnover (Days) 199.51 149.69
CCC (Cash Conversion Cycle) (days) 139 143 146 123 114 126
149 199 169 CCC (Cash Conversion Cycle) (days) 155 128
Payout ratio (consolidated) (%) 30.5 23.7 34.4 24.9 48.3 29.3
32.6 — 47.1 Dividend Payout ratio (consolidated) (%) 42.6 116.8
Dividend yield (%) 1.1 0.9 0.8 0.7 0.5 0.7
0.8 0.6 0.8 Dividend yield (%) 0.8 1.5
Dividend on equity (%) 2.6 2.2 2.1 2.0 2.7 4.1
5.1 3.3 3.9
Dividends on equity attributable to owners of parent (%)
4.0 7.0
Number of employees at year-end 33,054 33,000 33,783 36,549 37,438 38,640
40,000 39,035 35,318 Number of employees at year-end 35,318 33,414
Net sales per employee 23.1 23.6 22.6 23.2 26.8 28.3
28.3 23.6 29.3 Net sales per employee 28.6 31.9 242
Operating profit per employee 1.5 0.8 1.1 1.0 2.1 2.8
2.8 0.4 1.2 Core operating profit per employee 1.2 1.5 12
010_0252087912303.indd 2010_0252087912303.indd 2 2023/04/12 20:09:382023/04/12 20:09:38

3
CORPORATE DATA
Operating Results and Financial Condition
OPERATING RESULTS
ANALYSIS OF OPERATING RESULTS
In the consolidated fiscal year 2022, the global economy as a whole
experienced a normalization of economic activities in line with the re-
laxation of COVID-19-related restrictions. Conversely, uncertain condi-
tions continued to persist due to intermittent lockdowns in China, the
prolonged conflict in Ukraine, surging resource and energy costs, and
the appreciation of the U.S. dollar.
Japan’s domestic cosmetics market, while price increases in a
wide range of areas weighed upon cosmetics purchases, achieved
gradual recovery thanks to the relaxation of restrictions and increased
opportunities to go out of home. In terms of overseas cosmetics mar-
kets, the market environment in China continued to be sluggish due
to restrictions on retail operations and supply chain disruptions
caused by lockdowns primarily in Shanghai and Hainan Island. Mean-
while, in the Europe and Americas regions, consumption continued to
recover steadily as economic activities resumed, and the cosmetics
market likewise showed strong growth across all categories.
Driven by its corporate mission, BEAUTY INNOVATIONS FOR A
BETTER WORLD, the Shiseido Group (the “Group”) actively promotes
innovations aimed at resolving environmental and social issues, such
as diversity and inclusion. We thus strive to realize our vision for 2030:
a sustainable world where people can enjoy happiness through the
power of beauty.
In 2021, we launched our medium- to long-term strategy “WIN
2023 and Beyond” in response to challenges caused by the
COVID-19 pandemic. Under this strategy, we have executed a global
transformation reform with an emphasis on profitability and cash flow,
through focusing on the skin beauty area, which is our competitive
advantage, restructuring our business portfolio, and improving profit-
ability particularly in the Americas and EMEA. We positioned 2022,
our second year of the strategy, as a “Back to Growth” year and have
worked to promote the growth of our global brands and to accelerate
digital transformation.
NET SALES
Net sales increased 5.7% year on year to ¥1,067.4 billion ($8,093.4 million) on reported figures, down 3.9% year on year on an FX-neutral basis, or
up 0.9% year on year on a like-for-like basis, which excludes the impacts of foreign exchange translation and business transfers. The result primarily
reflected the recovery in the EMEA, Americas, and Travel Retail Business, despite the continuing uncertain situation in China caused by the COVID-19
pandemic.
2021 2021
Excl. business
transfer impacts
2022
Excl. business
transfer impacts
2022
SHISEIDO
− 3%
IPSA
− 11%
ELIXIR
− 7%
Drunk
Elephant
− 1%
Clé de
Peau
Beauté
+6%
ANESSA
+2%
NARS
+22%
Fragrance
Other
Brands
Transferred
brands
FX, etc.
+12%
* YoY change (%) for each brand is calculated based on foreign exchange rate assumptions as of Feb 2022 and excludes exchange rate differences etc.
1,010.0 1,067.4
Trans-
ferred
brands
Like–for–like*
(Billion yen)
Net Sales by Brand
Clé de Peau Beauté, NARS and Fragrance Showed Strong Growth
While Most Skincare Brands Struggled amid Headwinds in Japan and China Markets
010_0252087912303.indd 3010_0252087912303.indd 3 2023/04/12 20:09:382023/04/12 20:09:38
4
Shiseido | Integrated Report 2022
COST OF SALES AND SELLING, GENERAL AND ADMINISTRATIVE EXPENSES
Cost of Sales
Cost of sales increased by 18.9% year on year to ¥323.2 billion ($2,450.6 million). The cost of sales ratio increased 3.4 percentage points year
on year to 30.3% mainly due to an increase in the cost of sales ratio caused by the supply of products during the transitional period for business
transfers and an impairment loss of factories resulting from the transfer of the personal care manufacturing business. The cost of sales ratio on a
like-for-like basis, excluding an increase in the cost of sales ratio due to the supply of products and the impairment loss resulting from the busi-
ness transfers, decreased 1.5 percentage points year on year to 23.6%, mainly due to a more favorable product mix resulting from the transfer of
business, improved productivity at factories in Japan, and a decrease in inventory write-off expenses.
Selling, General and Administrative Expenses
Selling, general and administrative (SG&A) expenses decreased 5.9% year on year to ¥721.7 billion ($5,472.6 million). The breakdown of this re-
sult on a core operating profit basis is as follows.
Marketing Costs
The ratio of marketing costs to net sales decreased 2.4 percentage points year on year to 24.9% due to lower expenses resulting from the busi-
ness transfers and agile cost management, despite higher investment expenses for enhancing brand equity.
Brand Development / R&D Expenses
The ratio of brand development and R&D expenses to net sales increased 1.3 percentage points year on year to 5.0%.
Personnel Expenses
The ratio of personnel expenses to net sales decreased 0.7 percentage points year on year to 21.5% as a result of initiatives to optimize personnel
expenses through such means as implementing structural reforms, which outweighed an increase in expenses resulting from strengthened in-
vestment in human capital.
Other SG&A Expenses
The ratio of other SG&A expenses to net sales decreased 0.8 percentage points year on year to 15.8% due to an increase in net sales outweighing
an increase in investment expenses for digital transformation.
R&D expenses, which are included in SG&A expenses, stood at ¥26.7 billion ($202.3 million), bringing the ratio of R&D expenses to net
sales to 2.5%.
Note: The ratio of marketing costs to net sales was 34.5% if expenses related to personal beauty partners are included. The ratio of personnel expenses to net sales was 12.0% if the same ex-
penses are not included.
010_0252087912303.indd 4010_0252087912303.indd 4 2023/04/12 20:09:382023/04/12 20:09:38

5
CORPORATE DATA
CORE OPERATING PROFIT
Core operating profit increased by ¥8.8 billion ($66.6 million) year on year to ¥51.3 billion ($389.3 million), thanks to agile cost management and
lower fixed costs that were achieved through structural reforms as well as the positive impact of foreign exchange rate translation, which outweighed
lower margins resulting from weaker sales in China and the impact of the transfer of the personal care business.
PROFIT ATTRIBUTABLE TO OWNERS OF PARENT
Profit attributable to owners of parent dropped by ¥12.7 billion ($96.4 million) year on year to ¥34.2 billion ($259.3 million), due to a decrease in
income tax expense from the fiscal year 2021 and an increase in non-controlling interests, in addition to profit before tax of ¥50.4 billion ($382.4
million), a year-on-year decrease of ¥48.7 billion ($369.1 million).
010_0252087912303.indd 5010_0252087912303.indd 5 2023/04/12 20:09:382023/04/12 20:09:38
6
Shiseido | Integrated Report 2022
REVIEW BY REPORTABLE SEGMENT
Results by reportable segment are as follows.
Net Sales by Reportable Segment
Segments
(Billions of yen) 2021/12 2022/12
Japan Business 258.8 237.6
China Business 274.7 258.2
Asia Pacific Business 63.6 68.0
Americas Business 121.4 137.9
EMEA Business 117.0 128.4
Travel Retail Business 120.6 163.7
Professional Business 15.3 9.3
Other 38.6 64.2
Core Operating Profit by Reportable Segment
Segments
(Billions of yen) 2021/12 2022/12
Japan Business 6.5 (13.1)
China Business 4.1 (3.9)
Asia Pacific Business 5.0 4.7
Americas Business 1.6 7.7
EMEA Business 2.7 6.9
Travel Retail Business 22.7 37.7
Professional Business 0.7 0.8
Other 14.1 6.1
Core Operating Margin by Reportable Segment
Segments
(%) 2021/12 2022/12
Japan Business 2.3 (5.4)
China Business 1.5 (1.5)
Asia Pacific Business 7.7 6.6
Americas Business 1.3 5.4
EMEA Business 2.1 5.0
Travel Retail Business 18.8 23.0
Professional Business 4.5 7.7
Other
5.2 2.0
Notes:
1. The Group has revised its reportable segment classifications from the fiscal year 2022. The
business results of Shiseido Beauty Salon Co., Ltd., previously included in the Other seg-
ment, are now included in the Japan Business. The business results related to the brand
holder functions of the NARS and Drunk Elephant brands, previously included in the
Americas Business, are now included in the Other segment. The segment information for
the fiscal year ended December 31, 2021 has been restated in line with the reclassifica-
tion.
2. Net sales from regional sales subsidiaries related to the Personal Care business, previously
recorded in the Japan, China, and Asia Pacific Businesses, are no longer recorded with
some exceptions from July 1, 2021 due to the transfer of the said business and resulting
changes in commercial distribution. Meanwhile, Personal Care products sales from the
Company and its manufacturing subsidiaries to FineToday Co., Ltd. (which has changed its
company name from “FineToday Shiseido Co., Ltd.” effective January 1, 2023) and its af-
filiates are recorded in the Other segment effective from the same date.
3. Net sales previously recorded by regional sales subsidiaries in Professional segment are no
longer recorded after July 1, 2022, with some exceptions, due to the transfer of the profes-
sional business.
4. The Other segment includes head office administration departments, IPSA Co., Ltd., man-
ufacturing operations, and the restaurant business, etc.
Japan Business
In the Japan Business, the mid price range market turned to a recov-
ery trend in the second half of the year coming from a sluggish mo-
mentum in the first half of the year. We continued to strengthen
strategic investments in skin beauty brands as well as the promotions
commemorating the 150th anniversary of our founding. In September,
we launched Elixir lotion and emulsion revamped with latest collagen
technologies. In the fourth quarter, we rolled out new and limited-edi-
tion products from SHISEIDO and Clé de Peau Beauté and enhanced
the value communication of the brand and the products. In addition,
we launched “Beauty Key,” a new membership service which consoli-
dates the different membership services offered by different sales
channels such as stores or e-commerce, or by brand. This allows for
counseling services tailored to each customer’s needs. We also
worked to strengthen digital communication.
As a result, net sales were ¥237.6 billion ($1,801.4 million), down
by 8.2% year on year, essentially the same level year on year on a
like-for-like basis excluding business transfer impacts. Core operating
loss was ¥13.1 billion ($99.2 million), lower by ¥19.6 billion ($148.4
million) year on year, primarily due to lower profit margins from the
transfer of the personal care business which outweighed cost man-
agement efforts.
China Business
In the China Business, we are shifting from a growth model driven pri-
marily by large-scale promotions to a more sustainable growth model
which focuses on value-based brand and product communication tai-
lored to consumer needs. While the market faced a significant year-
on-year decline during ‘Double 11,’ the largest e-commerce event in
China, our annual e-commerce sales achieved growth, on the back of
the expansion into major platforms and enhanced communication fo-
cusing on effect and efficacy. Meanwhile, on the offline front, despite
our efforts to enhance the unique experience at brick-and-mortar
stores and expand the loyal user base, sales decreased year on year
due to market headwinds such as traffic decline from lockdowns.
As a result, net sales were ¥258.2 billion ($1,958.0 million), down
6.0 % year on year on a reported basis, down 18.3% year on year on
an FX-neutral basis, or down 9.8% year on year on a like-for-like basis
excluding foreign exchange and business transfer impacts. Core oper-
ating loss was ¥3.9 billion ($29.8 million), lower by ¥8.0 billion ($60.9
million) year on year, primarily due to lower margins from a decline in
sales.
Asia Pacific Business
In the countries and regions of the Asia Pacific Business, along with
Taiwan’s return to growth from the fourth quarter, strong growth con-
tinued in South Korea, Southeast Asia, and other regions. In addition,
we continued to increase our sales in e-commerce across Asia by
continuing to accelerate key e-commerce platforms entry and to ex-
pand touch points with customers through digital engagement.
As a result, net sales were ¥ 68.0 billion ($515.7 million), up 7.0%
year on year on a reported basis, down 3.7% year on year on an
FX-neutral basis, or up 13.0% year on year on a like-for-like basis ex-
cluding foreign exchange and business transfer impacts. Core operat-
ing profit was down by ¥0.3 billion ($2.5 million) to ¥4.7 billion ($35.8
million), primarily due to higher personnel and other expenses out-
weighing the increase in sales and profit.
Americas Business
In the Americas Business, the cosmetics market continued to grow
in all categories with the normalization of economic activities due to
010_0252087912303.indd 6010_0252087912303.indd 6 2023/04/12 20:09:382023/04/12 20:09:38

7
CORPORATE DATA
the relaxation of COVID-19 restrictions. NARS in particular saw share
gains, driven by successful new product launches and growth in
e-commerce supported by digital marketing enhancements. Sales of
SHISEIDO remained steady on the back of strengthened promotions.
As a result, net sales were ¥137.9 billion ($1,045.8 million), up
13.6% year on year on a reported basis, down 4.7% year on year on
an FX-neutral basis, or up 8.8% year on year on a like-for-like basis
excluding foreign exchange and business transfer impacts. Core op-
erating profit improved by ¥6.0 billion ($45.7 million) year on year to
¥7.7 billion ($58.1 million), primarily due to higher margins associat-
ed with an increase in sales and lower fixed costs due to structural
reforms, etc.
EMEA Business
In the EMEA Business, the cosmetics market continued to prosper in
all categories with the normalization of economic activities due to the
relaxation of COVID-19 restrictions. We held promotions capturing the
recovery trend in consumer consumption, and NARS and narciso ro-
driguez achieved strong growth and increased shares. We also steadi-
ly increased the number of stores for Drunk Elephant, which
contributed to the growth in sales.
As a result, net sales were ¥128.4 billion ($973.9 million), up 9.8%
year on year on a reported basis, up 3.3% year on year on an FX-neu-
tral basis, or up 4.0% year on year on a like-for-like basis excluding
foreign exchange and business transfer impacts. Core operating profit
improved by ¥4.2 billion ($32.0 million) year on year to ¥6.9 billion
($52.5 million), primarily due to higher margins associated with an in-
crease in sales and lower fixed costs due to structural reforms, etc.
Travel Retail Business
In the Travel Retail Business (sales of cosmetics and fragrances pri-
marily through airport and downtown duty-free stores), tourist traffic
resumed with the relaxation of COVID-19 restrictions and we saw rap-
id recovery particularly in the Americas and Europe. In Hainan Island
in China, although affected by the lockdowns, we achieved strong
growth through new store opening in the world’s biggest duty-free
shopping mall in Haikou City and through the expansion of e-com-
merce.
As a result, net sales were ¥163.7 billion ($1,240.9 million), up
35.7% year on year on a reported basis, up 15.3% year on year on an
FX-neutral basis, or up 14.2% year on year on a like-for-like basis ex-
cluding foreign exchange and business transfer impacts. Core operat-
ing profit increased by ¥14.9 billion ($113.3 million) year on year to
¥37.7 billion ($285.7 million), mainly due to higher margins from in-
creased sales.
Professional Business
In the Professional Business, we used to roll out professional products
such as hair care, styling, color, and perm solutions to hair salons in
Japan, China, and Asia Pacific. However, we transferred the said
business in July 2022, with some exceptions.
Net sales were ¥9.3 billion ($70.8 million), down 38.9% year on
year on a reported basis, or down 43.1% year on year on an FX-neu-
tral basis. Core operating profit stayed flat year on year at ¥0.8 billion
($5.7 million).
[Reference]
Period-on-Period Growth in Sales (Local Currency Basis)
Japanese GAAP IFRS
(%) 2019/12 2020/12 2021/12 2021/12 2022/12
Net Sales 5.7 (17.8) 7.8 — (3.9)
Note: The above period-on-period growth in sales on a local currency basis is a period-on-
period comparison before translation into yen. Exchange rates for each fiscal period are
presented below.
(Yen) 2019/12 2020/12 2021/12 2022/12
USD 109.1 106.8 110.0 131.4
EUR 122.1 121.8 129.9 138.0
CNY 15.8 15.5 17.0 19.5
Sales by geographical area
Japanese GAAP IFRS
(Billions of yen) 2019/12 2020/12 2021/12 2021/12 2022/12
Japan 491.1 333.3 321.2 297.5 298.6
China 248.4 289.0 343.7 343.7 348.5
Asia (excl.China) 128.6 104.1 117.7 116.2 132.1
Americas 130.4 93.1 127.5 127.5 146.5
Europe 133.1 101.3 125.1 125.1 141.7
Total 1,131.5 920.9 1,035.2 1,010.0 1,067.4
Note: Sales are categorized by country or region based on customer location.
010_0252087912303.indd 7010_0252087912303.indd 7 2023/04/12 20:09:382023/04/12 20:09:38
8
Shiseido | Integrated Report 2022
LIQUIDITY AND CAPITAL RESOURCES
FINANCING AND LIQUIDITY MANAGEMENT
The Group strives to generate stable operating cash flows and secure
a wide range of financing sources, while always seeking to appropriately
secure adequate funds for its business activities, maintain liquidity,
and achieve a sound financial position. We fund the working capital,
capital expenditures, and investments and loans needed to maintain
growth primarily with cash on hand and operating cash flow,
supplemented by bank borrowings and bond issues. In terms of
fundraising, we aim for a net debt-to-equity ratio of 0.2 and a net
interest-bearing debt to EBITDA ratio of 0.5 for maintaining an A-level
credit rating, which enables access to capital on favorable terms. At
the same time, we raise funds using optimal, timely methods giving
consideration to such factors as the market environment. However,
taking into account future profitability and the potential to generate
cash flows, we may revise the policies stated above, as well as our
shareholder return policy, in an appropriate fashion so that we can
establish an optimal capital structure that contributes to further
improvements in capital efficiency.
One of our targets for short-term liquidity is to maintain liquidity on
hand at a level of approximately 1.5 months of consolidated net sales.
As of December 31, 2022, cash and deposits totaled ¥134.5 billion
($1,019.8 million) and liquidity on hand amounted to 1.5 months of
consolidated net sales for the fiscal year 2022.
Meanwhile, interest-bearing debt as of December 31, 2022 totaled
¥299.8 billion ($2,273.1 million). The Group uses diversified funding
methods, which include ¥100 billion ($758.3 million) in unused
committed lines of credit with financial institutions and ¥280 billion
($2,123.1 million) in authorized but unissued straight bonds in Japan.
In addition, the Group and its two subsidiaries in Europe and the
United States have established a syndicated loan program with
authorized but unused commitments totaling $300 million.
As of December 31, 2022, as the Shiseido Group maintained a
sufficient level of liquidity and the funding methods are diversified, we
consider that the financial flexibility is high.
CREDIT RATINGS
The Group recognizes the need to maintain its credit rating at a certain level to secure financial flexibility consistent with its capital and liquidity
policies and to ensure access to sufficient capital resources through capital markets. The Group has acquired ratings from Moody’s Japan K.K.
(Moody’s) to facilitate fund procurement through corporate bonds.
Moody’s
Long-term A3 (Outlook: stable)
(As of February 28, 2023)
010_0252087912303.indd 8010_0252087912303.indd 8 2023/04/12 20:09:382023/04/12 20:09:38

9
CORPORATE DATA
ASSETS, LIABILITIES, AND NET ASSETS
Assets
Total assets increased by ¥6.7 billion ($50.7 million) from the end of
the previous fiscal year to ¥1,307.7 billion ($9,915.5 million), primari-
ly from an increase in exchange differences on translation of foreign
operations due to the yen depreciation, which outweighed a decrease
in cash and cash equivalents due to income taxes paid on business
transfers executed in the previous fiscal year and cash dividend pay-
ments, as well as a decrease in property, plant and equipment due to
the recording of impairment losses associated with the transfer of the
manufacturing business of personal care products and a decrease in
inventories due to the business transfers as well as tightened invento-
ry management.
Liabilities
Liabilities decreased by ¥56.9 billion ($431.4 million) to ¥681.9 billion
($5,170.7 million), primarily due to a decrease in current liabilities as-
sociated with a decrease in income taxes payable and a decrease in
non-current liabilities associated with a decrease in retirement benefit
liability.
Equity
Equity increased by ¥63.6 billion ($482.1 million) to ¥625.8 billion
($4,744.9 million), chiefly due to the recording of profit attributable to
owners of parent and exchange differences on translation of foreign
operations.
CASH FLOWS
Cash Flow Summary
The balance of cash and cash equivalents as of December 31, 2022
stood at ¥119.0 billion ($902.6 million), ¥37.5 billion ($284.1 million)
less than at the end of the previous consolidated fiscal year.
Cash Flows from Operating Activities
Net cash provided by operating activities decreased ¥87.5 billion
($663.6 million) year on year to ¥46.7 billion ($354.4 million). The
result is attributable to cash outflow factors of income taxes paid of
¥67.5 billion ($512.0 million), gain on transfer of business of ¥15.3
billion ($116.0 million), a decrease in trade payables of ¥12.5 billion
($94.9 million), an increase in trade receivables of ¥6.3 billion ($48.0
million), and an increase in inventories of ¥3.3 billion ($25.4 million),
which outweighed cash inflow factors of profit before tax of ¥50.4
billion ($382.4 million) and non-cash expenses including depreciation
and amortization of ¥75.7 billion ($574.1 million).
Cash Flows from Investing Activities
Net cash used in investing activities decreased ¥108.0 billion ($819.2
million) year on year to ¥41.3 billion ($313.2 million). The result is
attributable to cash outflow factors of purchase of property, plant and
equipment of ¥36.3 billion ($275.2 million) and purchase of
intangible assets of ¥29.9 billion ($226.8 million), which outweighed
cash inflow factors of proceeds from transfer of business of ¥13.8
billion ($104.5 million) and proceeds from sale of property, plant and
equipment and intangible assets of ¥5.3 billion ($40.1 million).
Cash Flows from Financing Activities
Net cash used in financing activities decreased ¥138.2 billion
($1,047.6 million) year on year to ¥52.4 billion ($397.5 million). The
result is attributable to cash outflow factors of repayments of lease
liabilities of ¥29.7 billion ($225.2 million), dividends paid of ¥22.0
billion ($166.6 million), and redemption of bonds of ¥15.0 billion
($113.7 million), which outweighed a cash inflow factor of proceeds
from issuance of bonds of ¥20.0 billion ($151.7 million).
2021 Q4 2022 Q4
Profit
before
income
taxes
+50.4
Depreciation,
amortization
+91.8
Other CF
from
operating
activities
+9.5
Proceeds
from
transfer
of
business
+13.8
Other CF
from
investing
activities
+11.1
CF from
financing
activities,
etc.
−17.5
CAPEX
−66.2
Interest-
bearing
debt
−25.4
Increase in
inventories
−3.3
Gain on
transfer
of
business
−15.3
Working
capital
less
inventories
−18.9
Income
taxes
paid
−67.5
156.5
119.0
(Billion yen)
Operating CF: + 46.7
Free Cash Flow: + 5.4
Investing CF: − 41.3
Cash Flow Management:
Continued CAPEX for Future Growth while Maintaining Sound Financial Position
010_0252087912303.indd 9010_0252087912303.indd 9 2023/04/12 20:09:382023/04/12 20:09:38
10
Shiseido | Integrated Report 2022
BUSINESS AND OTHER RISKS
Our Annual Securities Report pertaining to our business performance
and financial condition includes risks that may potentially impact on
our business performance and financial positions as listed below. We
believe that these risks could have a major impact on our investors’
decisions.
Such items associated with future events are based on our judg-
ment as of the Annual Securities Reports dated March 24, 2023.
Please note that the potential risks are not limited to those listed be-
low.
The risk management of the Group is primarily focused on “building
trust with multiple stakeholders and achieving our corporate strategy.”
We thus consider risks as “uncertainties” that may impact the
achievement, both potential threats to business as well as potential
opportunities. Based on this approach, we have established a risk
management structure and place measures proactively and expedi-
tiously.
The “Global Risk Management & Compliance Committee,” chaired
by the CEO and composed of Regional CEOs and HQ Executive Offi-
cers as well as Global Strategy Committee regularly identify Group
risks and deliberate measures toward them.
Risk-related information of the Group is gathered by the Risk Man-
agement Department at Global Headquarters (HQ), which reports into
the Office of the Chief Legal Officer of the Group.
In 2022, material risks were identified through a holistic approach
combining multiple and comprehensive methods. Specifically, HQ
Risk Management Department interviewed HQ Executive Officers, Re-
gional CEOs, and External Directors for their view on Group risks. Re-
gional risk assessments and input from relevant functions were also
taken into consideration as HQ Risk Management Department identi-
fied material risks affecting the key areas of our medium-term strate-
gy, SHIFT 2025 and Beyond, with the input from external advisors.
As shown in Table 1 below, the identified material risks were evalu-
ated with three measurements of “Impact on business,” “Likelihood,”
“Vulnerability,” followed by confirmation of prioritization and counter-
measures through the above committee meetings and other individual
meetings.
Table 1 <Risk evaluation methodology>
Impact on business
•
Quantitative impact on business performance
(e.g. topline sales) in case of manifestation
•
Qualitative impact on our corporate/brand
image and culture
Likelihood
•
Likelihood and timing of risk manifestation
Vulnerability
•
Preparedness to the risk
•
Controllability of the manifestation of the risk
due to external factors
Total 21 material risks identified through our risk assessment have
been organized into three risk categories: “Consumer and Social-relat-
ed Risks,” “Operation & Fundamental Risks,” and “Other Risks,” as
shown in Table 2 below.
We have identified “Risk Owners” for each risk category in an effort
to clarify responsibility for countermeasures. Moreover, we have im-
plemented a transparent monitoring and communicative framework
within the Global Risk Management & Compliance Committee and the
Board of Directors to regularly discuss and assess our progress in ad-
dressing these risks.
Table 2 <Summary of Shiseido Group material risks>
Consumer and
Social-related Risks
•
Changes in Consumer Values
•
Speed of Digital Acceleration
•
Pace of Cutting-Edge Innovation
•
Corporate and Brand Reputation
•
Environment and Climate Change
•
Diversity& Inclusion
•
Natural and Human-Made Disasters
•
Infectious Disease
•
Geopolitical Tensions
Operation &
Fundamental Risks
•
Corporate Culture and Acquisition/Securing
Outstanding Talent
•
Business Structure Transformation
•
Operating Infrastructure
•
Supply Network
•
Compliance
•
Regulatory
•
Quality Assurance
•
Governance Structure
•
Information Security and Privacy
Other Risks
•
Exchange Rate Fluctuations
•
Business Investment
•
Material Litigation
As a noteworthy point of the risk assessment results mentioned above,
the individual risks identified are more interlinked than in the past and
interdependency of the countermeasures is increasing. In addition to
that, we have identified five key risks that have significantly increased
their risk levels compared to the previous fiscal year: “Changes in
Consumer Values,” “Geopolitical Tensions,” “Corporate Culture and
Acquisition/Securing Outstanding Talent,” “Quality Assurance,” and
“Information Security and Privacy.” We have also added “Regulatory”
as a new material risk, which is becoming increasingly important as
we cultivate brands with unique value and develop new businesses
such as beauty devices and the inner beauty category.
The following outlines our key strategic initiatives, expected uncer-
tainties (threats and opportunities), countermeasures and change in
risk level, for each material risk. Please note that the following is
based on our assumptions as of March 24, 2023.
010_0252087912303.indd 10010_0252087912303.indd 10 2023/04/12 20:09:382023/04/12 20:09:38

11
CORPORATE DATA
<Consumer/Social-related Risks>
Risk Important efforts for realizing our Strategies/Uncertainties (Threats and Opportunities) that could impact such efforts and countermeasures re-
garding these uncertainties
Change in risk
level
(Compared to
the previous
fiscal year)
Changes in
Consumer Values
[Key Strategic Initiatives]
• Focus on the Premium Skin Beauty segment.
• Strengthen business portfolio combining the Company’s R&D with open innovation and strategic M&A.
• Develop the inner beauty category.
• Develop cross-border marketing.
[Uncertainties]
• Loss of competitiveness due to delayed or inadequate response to changing consumer values relating to “beauty,” changing tastes related to
cosmetics or inner beauty, price acceptability, and diversifying purchasing behavior including touchpoints. (Threat)
• Successful marketing strategies addressing changing consumer values may lead to higher-than-expected sales and profits. (Opportunity)
[Countermeasures]
• Strengthen the delivery of compelling, tailor-made experiences in the offline store and in online e-commerce with a focus on the consumer.
• Strengthen brand portfolio to respond to diversifying consumer values.
• Accelerate diversity of human resources, especially at HQ.
• Accelerate value creation and business development through open innovation with other companies.
• Set up Consumer and Market Intelligence Department to gather consumer information in an accurate and timely manner.
Speed of Digital
Acceleration
[Key Strategic Initiatives]
• Orchestrate foundational Group-wide shifts in strategy, people, technology and processes, focused on delivering benefits for the larger enter-
prise.
• Drive Global Standardizations (platforms, tools, process and aligned KPIs) for focused and effective activations and measurement in order to
help reach Global targets and create cost efficiencies and decrease compliance risks.
• Obtain and analyze consumer data in compliant manner to develop more personalized marketing through digital CRM. Strengthen retention
and loyalty.
[Uncertainties]
• Possibility of decline in market share due to lack of data and process standardization may lead to compliance risk and cost increases. (Threat)
• Offer unique value through combination of online and offline (i.e., store counter) experiences. (Opportunity)
[Countermeasures]
• Quarterly regional meetings between Chief Digital Officer (CDO) and digital leadership team in the HQ and Regional HQs established for audit
and track global delivery based on standardized KPIs.
• Introduction of the digital workforce planning to reinforce team building, hiring, retention, and development of digital experts.
• Enhance development of beauty technology to reinforce personalized engagement with customers and improve unique digital content to ana-
lyze skin condition.
• Accelerate first-party data acquisition through service and technology offered to consumers online and at store counters.
• Promote governance by creating stage gate process, investment management model with collaboration with R&D, Corporate Strategy and Glob-
al IT companies.
• Establishment of Global and Regional Metaverse and Web 3.0 Steering Committee to pilot innovations and test, learn and stay competitive.
Pace of Cutting-
Edge Innovation
[Key Strategic Initiatives]
• Selection and concentration of R&D through introduction of unique R&D philosophy “DYNAMIC HARMONY.”
• Strengthen R&D in the Premium Skin Beauty segment.
• Invest in R&D with ca.3% of net sales ratio target.
• Strengthen R&D and regulatory compliance activities at each Regional HQ.
[Uncertainties]
• New and competing technologies may make existing technologies obsolete. Cosmetics and other regulations of certain countries could result in
restriction of our technologies, making it difficult to provide new value to consumers. (Threat)
• Short-term delay such as launch of new technologies, medium-to long term slowdown in basic research or formula development/alternative in-
gredients to boost sustainability, or delay in M&A progress and partnerships with third parties could prevent us from achieving planned syner-
gies. This would limit our overall competitiveness and ability to meet the needs of consumers. (Threat)
• Establishing competitive superiority through the creation of new value via innovation in fields such as services, processes, and organization.
(Opportunity)
[Countermeasures]
• Continue to expand investment and resources in R&D of cosmetics.
• Identified core technology areas for R&D and clarified short-to long-term strategies for each to achieve resource allocation with high return on
investment.
• To maximize the value of innovative research results, identify the seeds for commercialization across brands, which are effectively communicat-
ed to consumers through strategic communications.
• Establishment of an Innovation Center to drive innovation in collaboration with other companies.
• Operate Nasu Factory, Osaka Ibaraki Factory and Fukuoka Kurume Factory leveraging the latest technologies.
• Conduct joint research with external organizations. Harness expertise of startup ventures. Focus on consumer trends.
• Collaborate for innovation with external parties through initiatives such as “fibona” (open innovation program involving startup companies).
• Define KPIs for measuring the return on R&D (such as R&D expenses to net sales ratio, number of researchers, sites, patent applications, aca-
demic papers, and seeds created and utilized etc.) for monitoring.
• Expanding the strategic dispatch of talents to external organizations for the development of innovative human resources.
Corporate and
Brand Reputation
[Key Strategic Initiatives]
• Aggressive marketing activities including digital marketing to increase brand value.
• Proactive marketing activities to create both corporate brand and each brand images using ambassadors and social media influencers.
[Uncertainties]
• Rumors, whether true or unfounded, regarding our official communications or comments and actions by ambassadors and social media influ-
encers associated with Shiseido could result in public criticism of the Group and damage our reputation. (Threat)
• Sale of counterfeit products can damage our ability to share our values with consumers, resulting in damage to our brand. (Threat)
[Countermeasures]
• Formulate and implement a strict social media policy and ensure familiarization among employees.
• Provide in-house training on maintaining and enhancing brand image for brand holder marketing and communications staff.
• Introduced a review system for language used in advertising and promotional materials, as well as selection of ambassadors and social media
influencers, to avoid behavior/messaging leading to criticism on the grounds of ethical or social norms.
• Perform website and social media monitoring to discover and respond to negative information in an accurate and timely manner.
• Coordinate with local government authorities to combat counterfeit products.
010_0252087912303.indd 11010_0252087912303.indd 11 2023/04/12 20:09:382023/04/12 20:09:38
12
Shiseido | Integrated Report 2022
Risk Important efforts for realizing our Strategies/Uncertainties (Threats and Opportunities) that could impact such efforts and countermeasures re-
garding these uncertainties
Change in risk
level
(Compared to
the previous
fiscal year)
Environment and
Climate Change
[Key Strategic Initiatives]
• As part of initiatives to realize a better world, execute actions while working toward greater sustainability, and enriching people’s lives through an
approach unique to a beauty company.
• Promote activities to achieve three commitments: “Reducing Our Environmental Footprint,” “Developing Sustainable Products,” and “Promoting
Sustainable and Responsible procurement.”
[Uncertainties]
• Lack of environmental measures may lead to loss of trust of consumers/society at large and a decline in shopping motivation. (Threat)
• Inadequate responses to environmental issues, particularly climate change risks, would negatively affect business, finance, and corporate val-
ue. (Threat)
• Efforts such as development of sustainable products could establish greater trust with consumers and society at large, create new social value
in beauty, and rapidly increase corporate value. (Opportunity)
[Countermeasures]
• Regular meetings held by the Sustainability Committee for medium-to-long-term strategy development/KPI setting, deliberation/resolution on
sustainability issues, and monitoring of the strategy implementation progress involving related departments of HQ and Regional HQs with re-
sponsibility for execution.
• Sustainability/SDGs-related activities by each brand.
• Promote ISO14001 certification at all factories and distribution centers by end of 2024.
• Issue Sustainability Report reflecting corporate policies, initiatives, and KPIs.
• Promote efforts to contribute to the reduction of environmental impact together with customers through adopting eco-friendly packaging.
• Promote switch to certified palm oil and paper.
• Set and disclose medium-term targets for major environmental load reduction items (CO2, palm oil, paper, water, waste) and work toward
achieving them.
• Support the Task Force on Climate-related Financial Disclosures (TCFD). Prepare and disclose a scenario based on quantitative/qualitative analy-
sis of climate change impact on business, estimated financial impact and specific actions to be taken, in line with TCFD recommendations.
Diversity& Inclusion [Key Strategic Initiative]
• To achieve the three commitments of “Advancing Gender Equality,” “Empowering people through the Power of Beauty,” and “Promoting Re-
spect for Human Rights,” actions taken by HQ/Regional HQs/brands in collaboration with external international organizations and NGOs.
• Particularly in Japan, where empowerment of women lags behind, Shiseido to provide information to employees as well as external companies,
thereby driving transformation of Japanese companies and Japanese society as a whole.
[Uncertainties]
• Possibility of losing the trust of society at large and consumers due to insufficient efforts in Diversity & Inclusion effort, which is a strength of
Shiseido. (Threat)
• Our efforts to promote Diversity & Inclusion may create new social values, building trust with consumers and society at large. (Opportunity)
• Organizational culture rooted in diversity and inclusion may lead to recruitment/retainment of diverse and talented people, promoting innovation
and dramatically increasing our corporate value. (Opportunity)
[Countermeasures]
• Medium-to-long-term strategy development, setting KPIs, and monitoring of the strategy implementation progress, involving related depart-
ments of HQ and Regional HQs.
• Activities by each brand for sustainability and SDGs realization.
• Issuance of sustainability report containing corporate policy, initiatives, and KPIs.
• Participation in “30% Club Japan” which aims to raise the percentage of women officers in Japanese companies, with our CEO acting as chair
to lead the activities of TOPIX Presidents’ Association.
• Expand opportunities to experience “power of makeup” through “SLQM(Shiseido Life Quality Makeup)”and “Lavender Ring Makeup & Photos
with Smiles” programs, supporting QOL improvement of cancer survivors.
Natural and
Human-Made
Disasters
[Key Strategic Initiative]
• Reinforce human resources and management infrastructure to rebuild our foundation for growth on a global scale.
[Uncertainties]
• Recent natural disasters (such as earthquakes, flood damages, and tornadoes) and other events around the world (such as terrorism and riots)
threatening employee safety and/or causing property damage, resulting in negative impact on supply network and business. (Threat)
[Countermeasures]
• Execute employee safety training and formulate business continuity plans (BCPs) for HQ and major regional sites. Hold regular and consistent
training at each site.
• Strengthen and leverage our global supply network to allow flexible and continuous supply during a crisis, such as establishment of a new factory.
Infectious Disease [Key Strategic Initiatives]
• Reinforce human resources and management infrastructure to rebuild our foundation for growth on a global scale.
• Build a digitally driven business model and organization.
[Uncertainties]
• Re-emergence of COVID-19 or outbreak of similar pandemics may lead to decline in consumption, sales, and profits. (Threat)
• Possibility to secure a competitive advantage in the market by quickly and flexibly addressing the changes in consumer values and needs. (Op-
portunity)
[Countermeasures]
• Putting the safety and security of employees first, taskforce established at HQ and Regional HQs in response to COVID-19.
• BCP for infectious diseases established and response system continuously strengthened.
Geopolitical
Tensions
[Key Strategic Initiatives]
• Focus investments on the areas of growth drivers.
• Rebuild the business foundation to boost profitability.
[Uncertainties]
• Possibility of boycott on our products due to increased anti-Japan sentiments in markets where we operate. (Threat)
• Deterioration of business environment due to political instability in markets where we operate. (Threat)
• Our profitability may deteriorate if the increased cost of raw materials caused by global price inflation leads to an increase in the price of goods/
services, as consumers may be less motivated to purchase our products. (Threat)
• Unstable political conditions and strained diplomatic relationships of countries and conflicts where we operate could deteriorate our business
environment and lead to negative impacts on production, supply, and sales of our products. (Threat)
[Countermeasures]
• Further develop our Premium Skin Beauty business.
• Balance sales portfolio across Regions. Strengthen and leverage the scale of our global supply network to be able to be flexible at a time of cri-
sis, without interrupting supply.
• Identification and consideration of Group-wide response points in the event of a crisis.
010_0252087912303.indd 12010_0252087912303.indd 12 2023/04/12 20:09:382023/04/12 20:09:38

13
CORPORATE DATA
<Operation & Fundamental Risks>
Risk Important efforts for realizing our Strategies/Uncertainties (Threats and Opportunities) that could impact such efforts and countermeasures re-
garding these uncertainties
Change in risk
level
(Compared to
the previous
fiscal year)
Corporate Culture
and Acquisition/
Securing
Outstanding
Human
Talent
[Key Strategic Initiatives]
• Under the “PEOPLE FIRST” Principle, acquire/develop human resources that realize innovation and create new value.
• Established eight working principles for all Shiseido employees to follow, as OUR PRINCIPLES (TRUST 8).
[Uncertainties]
• Inability to attract and retain the best talent may lead to talent shortages in realizing our business objectives. (Threat)
• Possibility of securing a competitive advantage by hiring and retaining the best talent. (Opportunity)
• Possible increase in productivity of the entire Group through work style reforms tailored to each task. (Opportunity)
[Countermeasures]
• Continue to reinforce a strong culture of transparent leadership and governance globally and reinforce the culture through employee communi-
cations and town halls.
• Promote workplace with flexibility and diversity, such as a workstyle combining office and remote work to achieve maximum results (Shiseido
hybrid work style) and permitting part-time jobs. Improve employee wellbeing.
• Introduce the global HR database and unify employee performance management to appoint talented people right time in the right jobs at the
right time.
• Introduce the Job Grade HR System and a remuneration system commensurate with individual contributions to ensure transparency in person-
nel evaluation and improve employee motivation.
• Accelerate a shift to digitally driven business model and reinforce IT/digital capability through Shiseido Interactive Beauty (SIB).
• Strengthen retention of human resources by offering total rewards, including global leadership programs, women’s leadership development pro-
grams, global mobility and competitive compensation systems.
Business Structure
Transformation
[Key Strategic Initiative]
• Promote structural reforms by divesting or withdrawing from unprofitable and non-core businesses and improve profitability through reduction
of COGs and SG&A expenses.
[Uncertainties]
• Business plan achievement may be negatively affected if regional/divisional business restructuring does not progress as targeted and profitabili-
ty and cash flow is not improved. (Threat)
• Possibility that the timing of market recovery may be delayed beyond expectations due to the impact of the Covid-19 and other factors may re-
sult in changed in consumer purchasing behavior, negatively affecting the management plans. (Threat)
• Growth in the cosmetics market may fall below expectations with slowdown of economic growth in China or the Americas, affecting manage-
ment plans. (Threat)
• Possibility of competitive advantage in the global market by improving profitability in EMEA and the Americas, rebuilding the foundation around
local business in Japan, and establishing a strong growth foundation in China. (Opportunity)
[Countermeasures]
• Establish and promote the Global Transformation Committee led by the CEO to establish, implement, manage, and expedite decision-making
for corporate strategy and to formulate/implement reform proposals for each regional structure or division.
Operating
Infrastructure
[Key Strategic Initiative]
• Globally improve effectiveness of information systems, business management systems, and core business processes related to procurement/
production/sales.
[Uncertainties]
• If IT system reconstruction/transition at our local offices do not proceed as planned, or faces issues hindering smooth operation after introduc-
tion, the initiative to improve global business base may be hindered and management plans negatively affected. (Threat)
• Updating global IT systems contributes to a stronger business foundation and improved competitiveness. (Opportunity)
[Countermeasures]
• Establishment of the specialized department at HQ and dedication to standardizing and updating IT systems and business processes globally,
in line with the overall objectives of the FOCUS project.
• Proceed the system implementation based upon the robust methodology to ensure business, system, and people readiness.
• Implement a high-availability global Cloud IT infrastructure to ensure resilience.
• Activate the Business Contingency Plan, when required, to avoid any operational impact.
Supply Network [Key Strategic Initiatives]
• Establishment of domestic factories and a supply chain base to enable stable production over the medium-to-long-term.
• Improve our global supply chain management.
• Continuous process improvement and state of the art technology investments in manufacturing and distribution.
• Focus on safety and sustainability.
[Uncertainties]
• Possible delays and inability to produce stable products due to price hikes, increased demand for raw materials, business withdrawals, natural
disasters, cyber damage to suppliers, and other factors caused by economic factors such as yen depreciation and international inflation affect-
ing the supply chain. (Threat)
• Leverage Japan’s high-quality manufacturing strengths to increase consumer value, at our factories in Japan. (Opportunity)
[Countermeasures]
• Reinforce supply structure of important ingredients by using multiple suppliers, securing emergency stocks, and creating strategic alliances
with suppliers.
• Strengthen our monitoring capabilities to ensure compliance with the Shiseido Group Supplier Code of Conduct.
Compliance [Key Strategic Initiative]
• Strengthen global legal compliance structure as we rebuild business foundation through new business models such as digital and beauty tech,
wellness, new M&A, etc.
[Uncertainty]
• Shiseido is subject to laws and regulations in countries in which we operate around the world relating to product safety, ingredients and label-
ing, employee health and safety, intellectual property, antitrust and competition, data privacy, environment, employment and labor, taxes, prod-
uct claims, corporate governance, Tokyo Stock Exchange (TSE) listing and disclosure. Unexpected changes to these laws and regulations could
have a material impact on the cost of doing business. Failure to comply with these laws and regulations could expose the Company to civil and/
or criminal fines, penalties and sanctions impacting our corporate reputation. (Threat)
[Countermeasures]
• Appointed a Chief Legal Officer (CLO) who works in conjunction with regional legal leaders to reinforce global compliance with the Standards
and with laws and regulations. Response teams are activated in any affected Regions or markets to ensure timely and effective actions in pro-
tecting the safety of our consumers and our employees.
• Foster an ethical culture and a framework of our ways of working that set out our non-negotiable standards embodied in our Shiseido Code of
Conduct and Ethics expected from all employees. We also provide training and awareness of compliance areas such as anti-corruption, an-
ti-trust, anti-harassment and anti-discrimination and privacy, in addition to developing areas concerning the use of consumer data.
• Provide an anonymous employee reporting system via phone or online, to report and respond to alleged violations of standards.
010_0252087912303.indd 13010_0252087912303.indd 13 2023/04/12 20:09:382023/04/12 20:09:38
14
Shiseido | Integrated Report 2022
Regulatory [Key strategic Initiative]
• HQ leads in collecting information and analyzing risks related to new environmental laws, product regulations and social trends, sharing infor-
mation with related departments, and including overseas regions, and strengthening the system for the smooth launch of innovative products
and services.
[Uncertainties]
• If we are unable to appropriately formulate our corporate strategy to respond to changes in consumer’s sense of value regarding beauty and
health to develop cosmetics and services that match demand, it may have a significant impact on our business, causing us to lose the trust of
society and consumers.
[Countermeasures]
• Established a dedicated department within HQ to monitor regulatory trends and formulate strategies for cosmetics and other regulations in each
country.
• Conduct compliance assessments of environmental and other regulations based on the ISO14001 to ensure strict compliance with laws and
regulations.
Quality Assurance [Key strategic Initiative]
• Offering safe products is a core Shiseido value and the foundation of our business strategies and competitive advantage; thorough measures
are taken to ensure high quality throughout product design, production, and sales.
[Uncertainties]
• Group-wide challenges to the thorough implementation of the Group’s high standard of quality assurance at various stages of product lifecycles
and providing safe products to consumers. (Threat)
• Globally provide Japan-standard quality, leading to improved brand image and increase in consumers, especially outside Japan. (Opportunity)
[Countermeasures]
• Developed Basic Guidelines on Quality Assurance and Global Quality Policy and Guidance and established Shiseido’s own quality and safety
assurance standards. Confirm adherence to such guidelines and standards at all stages, including new product design and development, man-
agement of raw materials, production, and delivery. Established a dedicated quality assurance department.
• Launched Global Quality Transformation Project, directly led by Global CEO, to improve global quality standards by strengthening governance/
risk assessment/operating protocols.
• Implementation of Global Quality System, a system allowing global sharing of voice of consumers collected at consumer centers.
• Set up a consumer service desk and a dedicated internal system for reporting and responding to potential quality risks, in addition to conduct-
ing regular simulation training.
Governance
Structure
[Key Strategic Initiative]
• Creation of a matrix organization structure composed of six Regions and brand categories to allow HQ to manage the entire Group business,
whilst also transferring greater authority to Regional HQs overseeing Japan, China, APAC, the Americas, EMEA, and Travel Retail. We will pro-
mote the localization of responsibilities and authority.
[Uncertainties]
• If Regional HQs push through decisions that do not align with the Group’s overall policies, or, conversely, if authority is not appropriately dele-
gated to Regional HQs and they are unable to effectively fulfill their responsibilities, it may become increasingly challenging to maintain efficient
and legally compliant operations and damage the organization’s sustainability. (Threat)
• Possibility of increased consumer loyalty in Regional HQs area of responsibility and make speedy decisions or successfully execute marketing
strategies to address local market needs. (Opportunity)
[Countermeasures]
• Significant decisions relating to the Company’s business are regularly reviewed by the Company’s Executive Officers and presented to the Board
of Directors.
• We create rules for responsibility and authority of HQ/ Regional HQs for each function and brand to ensure corporate governance through regu-
lar reporting and on-going global leadership meetings.
• Strengthen governance structure by establishing internal controls globally, including a Group-wide risk management system.
Information
Security and
Privacy
[Key Strategic Initiative]
• Strengthen digital marketing globally by utilizing data and enhancing e-commerce to match consumer needs and fierce competitive environ-
ment.
• Acquire via consumer consents personal data to provide new curated experience/services to customers and co-creation.
• Shift to Shiseido Hybrid Work Style, a way of working where productivity is high regardless of place or time.
• Further collaboration and co-creation with external partners such as startups to generate innovation.
[Uncertainties]
• Stagnation of production and sales and liability for damages to consumers and customers and loss of trust in the Company due to system fail-
ures caused by cyberattacks and leakage of consumer data. (Threat)
• With the increase in access points to important data accompanying working styles regardless of location and time, and further collaboration/
co-creation with external partners, information leakage risks may be heightened if management or operation is inadequate. (Threats)
• Violation of laws and regulations, fine payments, and loss of trust in the Company due to delayed or inappropriate response to data privacy-re-
lated laws and regulations in each country/region. (Threat)
• Loss of trust in the Company and business opportunity due to failure to understand the sensitivity of society regarding data privacy and appro-
priately understand the concerns/ expectations of consumers regarding data privacy. (Threat)
• By taking appropriate countermeasures to the above threats, possibility of contributing to the achievement of business goals; for example, con-
sumers feel safe to entrust their personal data to the Company. (Opportunity)
[Countermeasures]
The following measures are implemented, referencing the ISO and National Institute of Standards and Technology (NIST) frameworks.
• Dedicated information security department leading global collaboration, governance, and control.
• Appoint a person responsible for data privacy to reestablish and strengthen global collaboration system.
• Promote information disclosure and notification regarding protection of data privacy. Promote communication with relevant authorities.
• Continuously revise the company’s information security/data privacy regulations, considering both internal and external environmental changes.
• Identify/securely manage personal data held by the Company. Continuously promote information security awareness among employees.
• Reinforce medium-to-long-term response to external cyberattacks increasing in sophistication and diversification (Protect/Detect/Respond/Re-
cover: e.g., stronger security related to filters, computer devices, and cloud use).
• Strengthening the establishment and monitoring of the Security Operations Center (SOC) on a global scale, involving external experts, for im-
proved management/operation of increasing amount of sensitive data and diversifying data access points.
010_0252087912303.indd 14010_0252087912303.indd 14 2023/04/12 20:09:382023/04/12 20:09:38

15
CORPORATE DATA
<Other Risks>
Risk Important efforts for realizing our Strategies/Uncertainties (Threats and Opportunities) that could impact such efforts and countermeasures re-
garding these uncertainties
Change in risk
level
(Compared to
the previous
fiscal year)
Exchange Rate
Fluctuations
[Key Strategic Initiative]
• Increase our ratio of overseas sales as a global beauty company.
[Uncertainties]
• Significant fluctuations in exchange rates for settlements in foreign currencies, related to import/export transactions.
• When transaction figures reported in local currencies for an overseas affiliate are converted into Japanese yen at the time of preparing the con-
solidated financial statements, the appreciation of the Japanese yen may adversely affect business results.
• Investments in overseas affiliates could result in reduced net assets due to currency exchange adjustments and the appreciation of the Japa-
nese yen.
[Countermeasures]
• Hedge exchange rate fluctuation risks with forward exchange contracts.
• Monitor and respond to fluctuations in major global currencies.
Business
Investment
[Key Strategic Initiative]
• Promote growth investments that align with Company strategy and improve profitability and strengthen our skin beauty businesses.
[Uncertainties]
• If market/business conditions deteriorate at levels not anticipated at the time of investment decisions and our business plans are not success-
fully carried out, impairment losses on goodwill and intangible assets recorded through M&A may negatively affect company performance
(Threat)
[Countermeasures]
• Regular performance monitoring and reporting of monitoring results to the Board.
• Consider future directions and countermeasures to improve business performance in cooperation with relevant brands, regions, and functional
departments.
Material Litigation [Key Strategic Initiatives]
• Continuously strengthen legal compliance structure and governance with a risk mitigation focus as we rebuild business foundation and focus
on growth through new business models such as digital and beauty tech, transformation initiatives and M&A, beauty wellness, etc.
• Robust management and mitigation of material litigation/claims and heightened attention on proper controls and preventative measures, includ-
ing employee training and employee reporting avenues such as ethics hotlines.
[Uncertainties]
• With a presence across approximately 120 countries/regions globally, there is a possibility that we will face lawsuits and/or claims and/or gov-
ernment investigations under the different legal systems of each country. (Threat)
• Significant impact on the Group’s business performance, should a major material litigation occur in the future with an unfavorable ruling for the
Group; possibility of adverse effect on our financial position and business performance. (Threat)
[Countermeasures]
• Established legal teams at our HQ and Regional Affiliates, led by the Company’s Chief Legal Officer to ensure effective strategies and defenses.
Subject matter legal experts/external law firms are retained in support of all legal strategies and defenses in material matters.
• Continuously provide legal training to employees regarding legal environment and country-specific laws and regulations impacting our business
in areas of legal impact to the business, such as anti-corruption, antitrust, anti-discrimination.
• Ensure all commercial agreements have clear business terms that include indemnification and other protections to reduce the threat of dis-
putes.
• Proactively ensure all IP is protected globally to guard against infringement claims.
• Conduct due diligence on all significant commercial and business transactions.
010_0252087912303.indd 15010_0252087912303.indd 15 2023/04/12 20:09:382023/04/12 20:09:38
16
Shiseido | Integrated Report 2022
SIGNIFICANT ACCOUNTING POLICIES AND ESTIMATES
FORECAST FOR THE FISCAL YEAR 2023
The business environment in the next fiscal year is expected to remain uncertain; pressured by global inflation, risks of recession, prolonged situa-
tion of Ukraine, and foreign exchange fluctuations, etc. However, the Group remains optimistic about the cosmetics market recovery prospects within
2023, in line with the normalization of economy in China, and the transition to post-COVID new normal on the back of various related government
policies in Japan.
In response to these changes in the external environment, we plan to continue our strategic investments in such areas as skin beauty category
and digitization of our business model to realize continuous and stable growth. We also plan to improve our profitability by cost structure reforms.
As a result of such initiatives, consolidated net sales in the fiscal year 2023 are forecasted at ¥1.0 trillion ($7,582.7 million), up 11% like for like,
excluding the impact of foreign exchange translation and business transfers, etc. Core operating profit is forecasted at ¥60.0 billion ($455.0 million).
Although increased sales are expected to generate higher margins, the forecast also incorporates strategic investments and the impact of higher raw
material costs and personnel expenses due to inflation. The Company will aim to further increase profits by capturing market recovery momentum
and returns from strategic investments, as well as improving the cost of sales ratio. Profit attributable to owners of parent is forecasted at ¥28.0 bil-
lion ($212.3 million).
Consolidated Financial Results Forecast for the Fiscal Year 2023
Billions of yen
Net Sales Core Operating
Profit
Profit
Attributable to
Owners of Parent
Basic Earnings per
Share(yen)
Forecast (A) 1,000.0 60.0 28.0 70.1
Results for the fiscal year 2022 (B) 1,067.4 51.3 34.2 85.6
Amount of increase or decrease (A−B) (67.4) 8.7 (6.2)
Rate of increase or decrease (%) (6.3) 16.9 (18.1)
The Group prepares its consolidated financial statements in accordance with IFRS. The preparation requires management’s selection and adoption
of accounting policies and estimates that impact reported amounts of assets/liabilities and income/expenses and note disclosures. Management
makes a reasonable judgment about these estimates taking into account past business results and others. Nevertheless, actual results may differ
from these estimates due to uncertainties inherent to them.
Significant accounting policies the Group adopts on its consolidated financial statements are stated on “Notes to the Consolidated Financial
Statements 3. Notes on Accounting Policies and 4. Significant Accounting Estimates and Judgments.”
010_0252087912303.indd 16010_0252087912303.indd 16 2023/04/12 20:09:382023/04/12 20:09:38

17
CORPORATE DATA
Consolidated Financial Statements
Consolidated Statement of Financial Position
Shiseido Company, Limited and Subsidiaries
As of December 31, 2021 and 2022, and at the transition date
Millions of yen
Thousands of
U.S. dollars (Note 2)
Notes
IFRS transition date
(January 1, 2021)
2021/12 2022/12 2022/12
Assets
Current assets
Cash and cash equivalents 7,19 136,347 156,503 119,036 902,608
Trade and other receivables 8,27,35 146,507 158,791 182,069 1,380,566
Inventories 10 163,001 134,147 130,942 992,887
Other financial assets 9,35 15,829 16,429 18,498 140,264
Other current assets 11 44,698 45,117 54,753 415,173
Subtotal 506,385 510,989 505,299 3,831,506
Assets held for sale 12 — 1,933 18,929 143,532
Total current assets 506,385 512,922 524,229 3,975,045
Non-current assets
Property, plant and equipment 13,19,38 329,478 340,037 318,339 2,413,854
Goodwill 14 54,429 50,429 57,879 438,876
Intangible assets 14,33,38 197,753 101,814 123,217 934,311
Right-of-use assets 21,33 131,665 127,832 114,276 866,515
Investments accounted for using equity method 16 2,224 21,691 15,535 117,796
Other financial assets
9,19,27,
35 44,246 73,777 84,701 642,258
Deferred tax assets 17 60,428 67,433 63,382 480,604
Other non-current assets 11 13,163 5,040 6,098 46,239
Total non-current assets 833,390 788,056 783,432 5,940,491
Total assets 1,339,775 1,300,979 1,307,661 9,915,537
010_0252087912303.indd 17010_0252087912303.indd 17 2023/04/12 20:09:382023/04/12 20:09:38
18
Shiseido | Integrated Report 2022
Millions of yen
Thousands of
U.S. dollars (Note 2)
Notes
IFRS transition date
(January 1, 2021)
2021/12 2022/12 2022/12
Liabilities and equity
Liabilities
Current liabilities
Trade and other payables 18,35
185,896
203,718 203,770 1,545,117
Bonds and borrowings 19,33,35
67,221
15,730 25,990 197,073
Lease liabilities 33,35
22,781
25,283 23,757 180,141
Other financial liabilities 20,35
4,926
4,914 4,744 35,972
Income taxes payable
7,374
45,600 5,442 41,265
Provisions 23
2,773
10,843 8,136 61,692
Other current liabilities 24,27
90,417
107,470 116,180 880,952
Subtotal
381,390
413,561 388,021 2,942,228
Liabilities directly associated with assets held for sale
12 — — 1,541 11,685
Total current liabilities 381,390 413,561 389,562 2,953,913
Non-current liabilities
Bonds and borrowings 19,33,35
232,861
145,915 140,000 1,061,571
Lease liabilities 33,35
121,774
118,909 107,441 814,688
Other financial liabilities 20,33,35
54,046
5,646 4,950 37,534
Retirement benefit liability 22
49,902
42,159 25,346 192,190
Provisions 23
1,679
1,753 1,328 10,070
Deferred tax liabilities 17
3,951
1,605 2,174 16,485
Other non-current liabilities
2,858
9,248 11,103 84,190
Total non-current liabilities
467,073
325,237 292,344 2,216,742
Total liabilities 848,464 738,799 681,907 5,170,663
Equity
Share capital 25
64,506
64,506 64,506 489,126
Capital surplus 25
72,696
73,035 73,560 557,780
Treasury shares 25
(2,455)
(2,338) (2,089) (15,840)
Retained earnings 25,26
335,878
372,202 394,877 2,994,214
Other components of equity 25
(237)
33,288 73,404 556,597
Total equity attributable to owners of parent
470,388
540,695 604,259 4,581,885
Non-controlling interests
20,922
21,484 21,494 162,981
Total equity
491,310
562,179 625,754 4,744,874
Total liabilities and equity 1,339,775 1,300,979 1,307,661 9,915,537
010_0252087912303.indd 18010_0252087912303.indd 18 2023/04/12 20:09:382023/04/12 20:09:38

19
CORPORATE DATA
Consolidated Statements of Profit and Loss and
Consolidated Statements of Comprehensive Income
Shiseido Company, Limited and Subsidiaries
For the fiscal years ended December 31, 2021 and 2022
CONSOLIDATED STATEMENTS OF PROFIT AND LOSS
Millions of yen
Thousands of
U.S. dollars (Note 2)
Notes 2021/12 2022/12 2022/12
Net sales 6,27 1,009,966 1,067,355 8,093,380
Cost of sales
15,21
28
271,808 323,191 2,450,645
Gross profit 738,158 744,164 5,642,736
Selling, general and administrative expenses
15,21
28,34
767,007 721,722 5,472,566
Other operating income 12,29 140,999 27,573 209,076
Other operating expenses 15,29 11,579 3,442 26,099
Operating profit 6 100,571 46,572 353,139
Finance income 21,30 4,079 5,877 44,563
Finance costs 21,30 3,829 3,627 27,502
Share of profit (loss) of investment accounted for using equity method 16 (1,709) 1,607 12,185
Profit before tax 99,111 50,428 382,378
Income tax expense 17 49,661 12,845 97,399
Profit 49,450 37,583 284,979
Profit attributable to
Owners of parent 46,909 34,202 259,342
Non-controlling interests 2,540 3,381 25,637
Profit 49,450 37,583 284,979
Earnings per share
U.S. dollars (Note 1)
Basic earnings per share (yen) 32 117.43 85.60 0.65
Diluted earnings per share (yen) 32 117.33 85.54 0.65
CONSOLIDATED STATEMENTS OF COMPREHENSIVE INCOME
Shiseido Company, Limited and Subsidiaries
For the fiscal years ended December 31, 2021 and 2022
Millions of yen
Thousands of
U.S. dollars (Note 2)
Notes 2021/12 2022/12 2022/12
Profit 49,450 37,583 284,979
Other comprehensive income
Items that will not be reclassified to profit or loss
Financial assets measured at fair value through other comprehensive income 31 110 (675) (5,118)
Remeasurements of defined benefit plans 31 4,961 11,134 84,425
Share of other comprehensive income of investments accounted for using equity method
31 0 24 182
Total of items that will not be reclassified to profit or loss 5,072 10,483 79,489
Items that may be reclassified to profit or loss
Exchange differences on translation of foreign operations 31 35,062 40,024 303,488
Cash flow hedges 31 98 96 728
Share of other comprehensive income of investments accounted for using equity method
31 515 873 6,620
Total of items that may be reclassified to profit or loss 35,676 40,994 310,843
Other comprehensive income, net of tax 40,748 51,477 390,332
Comprehensive income
90,198 89,061 675,318
Comprehensive income attributable to
Owners of parent 85,469 84,722 642,417
Non-controlling interests 4,729 4,338 32,894
Comprehensive income 90,198 89,061 675,318
010_0252087912303.indd 19010_0252087912303.indd 19 2023/04/12 20:09:382023/04/12 20:09:38
20
Shiseido | Integrated Report 2022
Consolidated Statements of Changes in Equity
Shiseido Company, Limited and Subsidiaries
For the fiscal years ended December 31, 2021 and 2022
Millions of yen
Equity attributable to owners of parent
Non-
controlling
interests TotalNotes
Share
capital
Capital
surplus
Treasury
shares
Retained
earnings
Other components of equity
Total
Exchange
differences on
transition of
foreign operations
Financial assets
measured at fair value
through other
comprehensive income
Cash flow
hedges
Remeasure-
ments of
defined
benefit plans
Total
Balance as of January 1, 2021
64,506 72,696 (2,455) 335,878 — — (237) — (237) 470,388 20,922 491,310
Profit
46,909 — 46,909 2,540 49,450
Other comprehensive income
33,427 125 98 4,907 38,559 38,559 2,188 40,748
Total comprehensive income
— — — 46,909 33,427 125 98 4,907 38,559 85,469 4,729 90,198
Purchase of treasury shares
(23) — (23) (23)
Disposal of treasury shares
140 (69) — 71 71
Dividends
26 (15,978) — (15,978) (4,176) (20,155)
Change in scope of consolidation
— — 10 10
Share-based payment transactions
339 331 — 670 670
Transfer to retained earnings
5,033 (125) (4,907) (5,033) — —
Other
97 — 97 97
Total transactions with owners
— 339 117 (10,585) — (125) — (4,907) (5,033) (15,162) (4,166) (19,329)
Balance as of December 31, 2021
64,506 73,035 (2,338) 372,202 33,427 — (139) — 33,288 540,695 21,484 562,179
Profit
34,202 — 34,202 3,381 37,583
Other comprehensive income
40,019 (614) 96 11,018 50,520 50,520 957 51,477
Total comprehensive income
— — — 34,202 40,019 (614) 96 11,018 50,520 84,722 4,338 89,061
Purchase of treasury shares
(9) — (9) (9)
Disposal of treasury shares
257 35 — 293 293
Dividends
26
(21,973) — (21,973) (4,073) (26,046)
Changes in ownership interest in subsidiaries
(69) — (69) (275) (345)
Change in scope of consolidation
— — 20 20
Share-based payment transactions
594 6 — 601 601
Transfer to retained earnings
10,404 614 (11,018) (10,404) — —
Other
0 — 0 0
Total transactions with owners
— 524 248 (11,526) — 614 — (11,018) (10,404) (21,157) (4,328) (25,486)
Balance as of December 31, 2022
64,506 73,560 (2,089) 394,877 73,447 — (43) — 73,404 604,259 21,494 625,754
Thousands of U.S. dollars (Note 2)
Equity attributable to owners of parent
Other components of equity
Notes
Share
capital
Capital
surplus
Treasury
shares
Retained
earnings
Exchange
differences on
transition of
foreign operations
Financial assets
measured at fair value
through other
comprehensive income
Cash flow
hedges
Remeasure-
ments of
defined benefit
plans
Total Total
Non-
controlling
interests
Total
Balance as of December 31, 2021
489,126 553,799 (17,728) 2,822,278 253,465 — (1,054) — 252,411 4,099,901 162,906 4,262,807
Profit
259,342 — 259,342 25,637 284,979
Other comprehensive income
303,450 (4,656) 728 83,546 383,076 383,076 7,257 390,332
Total comprehensive income
— — — 259,342 303,450 (4,656) 728 83,546 383,076 642,417 32,894 675,318
Purchase of treasury shares
(68) — (68) (68)
Disposal of treasury shares
1,949 265 — 2,222 2,222
Dividends
26 (166,614) — (166,614) (30,884) (197,498)
Changes in ownership interest in subsidiaries
(523) — (523) (2,085) (2,616)
Change in scope of consolidation
— — 152 152
Share-based payment transactions
4,504 45 — 4,557 4,557
Transfer to retained earnings
78,890 4,656 (83,546) (78,890) — —
Other
0 — 0 0
Total transactions with owners
— 3,973 1,880 (87,398) — 4,656 — (83,546) (78,890) (160,426) (32,818) (193,251)
Balance as of December 31, 2022
489,126 557,780 (15,840) 2,994,214 556,923 — (326) — 556,597 4,581,885 162,981 4,744,874
010_0252087912303.indd 20010_0252087912303.indd 20 2023/04/12 20:09:392023/04/12 20:09:39

21
CORPORATE DATA
Consolidated Statements of Cash Flows
Shiseido Company, Limited and Subsidiaries
For the fiscal years ended December 31, 2021 and 2022
Millions of yen
Thousands of
U.S. dollars (Note 2)
Notes 2021/12 2022/12 2022/12
Cash flows from operating activities:
Profit before tax 99,111 50,428 382,378
Depreciation and amortization 76,058 75,718 574,143
Impairment losses (reversal of impairment losses) 15 43,753 16,097 122,058
Loss (gain) on disposal of fixed assets 3,398 (2,422) (18,365)
Gain on transfer of business 36 (133,843) (15,294) (115,969)
Increase (decrease) in retirement benefit liability (340) (1,941) (14,718)
Interest and dividend income (1,554) (5,008) (37,974)
Interest expenses 3,056 2,501 18,964
Interest on other financial liabilities 529 115 872
Share of loss (profit) of investments accounted for using equity method 1,709 (1,607) (12,185)
Decrease (increase) in trade receivables (1,388) (6,334) (48,029)
Decrease (increase) in inventories 11,825 (3,348) (25,387)
Increase (decrease) in trade payables 35,680 (12,516) (94,904)
Other 24,987 18,571 140,817
Subtotal 162,983 114,960 871,702
Interest and dividends received 1,669 1,367 10,365
Interest paid (2,815) (2,069) (15,689)
Interest paid on other financial liabilities (493) — —
Income taxes paid (27,093) (67,522) (511,996)
Net cash provided by (used in) operating activities 134,249 46,735 354,375
Cash flows from investing activities:
Payments into time deposits (23,693) (18,006) (136,533)
Proceeds from withdrawal of time deposits 24,706 19,101 144,836
Purchase of property, plant and equipment (75,287) (36,289) (275,167)
Proceeds from sales of property, plant and equipment and intangible assets 1,501 5,288 40,097
Purchase of intangible assets (19,927) (29,915) (226,835)
Proceeds from sale of investment property 7,916 — —
Proceeds from transfer of business 36 149,936 13,778 104,474
Other 1,581 4,733 35,889
Net cash provided by (used in) investing activities: 66,733 (41,308) (313,224)
Cash flows from financing activities
Net increase (decrease) in short-term borrowings and commercial papers 33 (57,885) 73 554
Proceeds from long-term borrowings 33 10,000 — —
Repayments of long-term borrowings 33 (94,714) (730) (5,535)
Proceeds from issuance of bonds 33 — 20,000 151,653
Redemption of bonds 33 — (15,000) (113,740)
Purchase of treasury shares (23) (9) (68)
Proceeds from disposal of treasury shares 71 244 1,850
Dividends paid (15,987) (21,969) (166,583)
Dividends paid to non-controlling interests (3,677) (4,663) (35,358)
Repayments of lease liabilities 33 (24,804) (29,704) (225,235)
Repayments of long-term accounts payable 33 (3,437) (295) (2,237)
Other (117) (363) (2,753)
Net cash provided by (used in) financing activities (190,575) (52,418) (397,467)
Net change in cash and cash equivalents (decrease) 10,407 (46,991) (356,316)
Cash and cash equivalents at beginning of period 7 136,347 156,503 1,186,708
Effect of exchange rate changes on cash and cash equivalents 9,747 10,024 76,008
Net change in cash and cash equivalents included in assets held for sale 12 — (500) (3,791)
Cash and cash equivalents at end of period 7 156,503 119,036 902,608
010_0252087912303.indd 21010_0252087912303.indd 21 2023/04/12 20:09:392023/04/12 20:09:39
22
Shiseido | Integrated Report 2023
Notes to the Consolidated Financial Statements
Shiseido Company, Limited and Subsidiaries
01.
Reporting Entity
Shiseido Company, Limited (hereinafter, “the Company”) is a stock com-
pany located in Japan. The Company’s consolidated financial statements
as of and for the fiscal year ended December 31, 2022 comprise the ac-
counts of the Company and its consolidated subsidiaries (hereinafter
collectively, “the Group”), as well as its share of equity in associates. In-
formation on the lines of business and main activities of the Group is
presented in “6. Operating Segments” of the Notes.
02.
Basis of Preparation
(1) Statement of compliance with the International Financial
Reporting Standards (hereinafter, “IFRS”) and matters
concerning first-time adoption thereof
The Group’s consolidated financial statements are prepared in accor-
dance with IFRS pursuant to Article 93 of the Regulation on Terminol-
ogy, Forms and Preparation Methods of Consolidated Financial
Statements (Ministry of Finance Order No. 28 of October 30, 1976)
on the grounds that it satisfies the requirements of a “specified com-
pany complying with designated international accounting standards”
prescribed in Article 1-2 of the Regulation.
The Group has adopted IFRS for the first time from the fiscal year
ended December 31, 2022, and the date of transition to IFRS was
January 1, 2021. In transitioning to IFRS, the Group has applied IFRS
1 First-Time Adoption of International Financial Reporting Standards
(hereinafter, “IFRS 1”). Furthermore, information on the impact of the
transition to IFRS on the financial position, operating results, and cash
flows of the Group on the date of transition to IFRS and in the com-
parative fiscal year is presented in “41. First-Time Adoption of IFRS”
of the Notes.
The Group’s accounting policies are in accordance with IFRS that
were effective on December 31, 2022, except for those which the
Group have not early adopted and exemptions permitted under IFRS 1.
Information on exemptions applied is presented in “41. First-Time
Application of IFRS” of the Notes.
The consolidated financial statements were approved by Masahiko
Uotani, Representative Director, Chairman and CEO, and Takayuki Yo-
kota, Director and CFO, on April 12, 2023.
(2) Basis of measurement
As stated in “3. Notes on Accounting Policies” of the Notes, the
Group’s consolidated financial statements are prepared on a historical
cost basis, except for certain items such as financial instruments that
are measured at fair value.
(3) Functional currency and presentation currency
The Group’s consolidated financial statements are presented in Japa-
nese yen, which is the Company’s functional currency, and figures are
rounded down to the nearest million yen.
Amounts in U.S. dollars are included solely for the convenience of
the reader. The rate of ¥131.88= US$1 prevailing on December 31,
2022 has been used in translating the consolidated financial state-
ments expressed in Japanese yen into U.S. dollars. Such translations
should not be construed as representations that the Japanese yen
amounts could be readily converted, realized or settled in U.S. dollars
at this rate. Fractions resulting from the translations are rounded.
03.
Notes on Accounting Policies
Notes on Accounting Policies
(1) Basis of consolidation
1) Subsidiaries
Subsidiaries refers to entities controlled by the Group. An entity is
deemed to be controlled by the Group when the Group has exposure
or rights to variable returns arising from its involvement in an entity
and has the ability to influence such returns through its power over
the entity.
The financial statements of subsidiaries are included in consolida-
tion from the date the Group obtains control until the date it loses
control.
Balances of receivables and payables and internal transactions be-
tween group companies, as well as unrealized gains and losses arising
from transactions between group companies, are eliminated in the
preparation of the consolidated financial statements.
When control continues as a result of partial disposals of interests
in subsidiaries, they are accounted for as equity transactions. The dif-
ference between the amount of non-controlling interest adjusted and
the fair value of the consideration is recognized directly in equity as
equity attributable to owners of parent.
When control is lost, any gain or loss arising from the loss of control
is recognized in profit or loss.
2) Affiliates
Affiliates refer to companies over which the Group does not have con-
trol or joint control, despite having significant influence over finance or
operating policy. Generally, when the Group has between 20% and
50% of the voting rights of another company, the Group is assumed to
have significant influence over that company.
In principle, affiliates are accounted for by the equity method from
the day that the Group assumes a significant influence until the day
that it loses the significant influence. Investments in affiliates include
010_0252087912303.indd 22010_0252087912303.indd 22 2023/04/12 20:09:392023/04/12 20:09:39

23
CORPORATE DATA
goodwill recognized upon acquisition (net of accumulated impairment
losses).
Where affiliates have adopted different accounting policies to those
adopted by the Group, adjustments are made to the affiliates’ finan-
cial statements as needed.
(2) Business combinations
Business combinations are accounted for under the acquisition meth-
od. Non-controlling interests are initially measured at fair value or their
proportionate share of the acquiree’s identifiable net assets at the ac-
quisition date.
If the sum of the fair value of the consideration paid, the amount of
non-controlling interest in the acquiree, and, in the case of an acqui-
sition in phases, the fair value of the acquirer’s previously held equity
interest in the acquiree at the acquisition date exceeds the fair value
of the identifiable assets and liabilities assumed at the acquisition
date, the excess amount is recognized as goodwill in the consolidated
statement of financial position. On the other hand, if the total consid-
eration is less than the fair value of the identifiable assets and liabili-
ties assumed, it is recognized immediately in the consolidated
statement of income as profit or loss.
Acquisition-related costs incurred in connection with a business
combination are recognized as expenses as incurred.
If the initial accounting for the business combination is not com-
pleted by the end of the consolidated fiscal year in which the business
combination occurred, items not completed are accounted for using
provisional amounts and the provisional amounts recognized at the
acquisition date are adjusted retrospectively for measurement periods
within one year of the acquisition date.
(3) Foreign currency translation
1) Foreign currency denominated transactions
Foreign currency transactions are translated into the functional cur-
rency of each entity in the Group using the exchange rates at the date
of the transactions.
Foreign currency monetary assets and liabilities at the end of the
reporting period are translated into the functional currency using the
exchange rate at the reporting date.
Differences arising from translation or settlement are recognized in
profit or loss. However, the translation differences arising from equity
financial assets measured at fair value through other comprehensive
income and from the hedging instruments of cash flow hedges are
recognized in other comprehensive income to the extent that the
hedges are effective.
2) Financial statements of foreign operations
Assets and liabilities of foreign operations are translated into Japanese
yen at the year-end exchange rate, and revenues and expenses are
translated into Japanese yen at the average exchange rate unless the
exchange rate fluctuates significantly. Translation differences arising
from the translation of financial statements of foreign operations are
recognized in other comprehensive income, the accumulated amount
of which is recognized as other component of equity. Upon disposal of
a subsidiary resulting in loss of control, the entire accumulated trans-
lation differences related to such foreign operating entity are trans-
ferred to profit or loss.
(4) Financial instruments
1) Non-derivative financial assets
(i) Initial recognition and measurement
Financial assets measured at amortized cost are initially recog-
nized on the date incurred. All other financial assets are recog-
nized on the date of becoming a party to the contract for the
financial instrument.
Financial assets are classified at initial recognition as follows.
(a) Financial assets measured at amortized cost
Financial assets that meet both of the following conditions
are classified into financial assets measured at amortized
cost.
• Financial assets held within a business model whose ob-
jective is to hold financial assets to collect contractual cash
flows.
• The contractual terms of the financial asset give rise on
specified dates to cash flows that are solely payments of
principal and interest on the principal amount outstanding.
(b) Equity instruments measured at fair value through other
comprehensive income
For all investments in equity instruments which are not held
for sale, the Group has elected to present subsequent chang-
es in the fair value in other comprehensive income at the
time of initial recognition.
(c) Debt instruments measured at fair value through other com-
prehensive income
Financial assets that meet both of the following conditions
are classified into financial assets measured at fair value
through other comprehensive income.
• Financial assets held in a business model whose objective
is achieved by both the collection and sale of contractual
cash flows.
• The contractual terms of the financial asset give rise on
specified dates to cash flows that are solely payments of
principal and interest on the principal amount outstanding.
(d) Financial assets measured at fair value through profit or loss
Financial assets other than above are classified as financial
assets measured at fair value through profit or loss.
In principle, financial assets are measured at fair value
plus transaction costs directly attributable to the financial as-
sets. However, for financial assets measured at fair value
through profit or loss, transaction costs are recognized in
profit or loss as incurred.
In addition, trade receivables that do not contain a signifi-
cant financing component are measured at its transaction
price.
(ii)Subsequent measurement
After initial recognition, financial assets are measured based on
the classification as follows.
(a) Financial assets measured at amortized cost
Financial assets measured at amortized cost are measured at
amortized cost using the effective interest method, with inter-
est recognized in profit or loss. When necessary, an allowance
for doubtful accounts is deducted from the gross carrying
amount to which the effective interest method is applied.
010_0252087912303.indd 23010_0252087912303.indd 23 2023/04/12 20:09:392023/04/12 20:09:39
24
Shiseido | Integrated Report 2023
(b) Financial assets measured at fair value
For equity financial assets measured at fair value through
other comprehensive income, changes in fair value and
gains or losses on derecognition are recognized in other
comprehensive income. The cumulative amount recognized
in other comprehensive income is transferred to retained
earnings immediately after recognition in other components
of equity. Dividends from such financial assets are recog-
nized in profit or loss for the current period as part of finan-
cial income, unless such dividends clearly represent a
recovery of the cost of the investment.
Changes in the fair value of financial assets measured at
fair value, other than those above, are recognized in profit or
loss.
(iii) Derecognition
The Group derecognizes a financial asset when the contractual
rights to the cash flows from the financial asset expire or when
the Group transfers substantially all the risks and rewards of
ownership of the asset.
(iv) Impairment of financial assets
For impairment losses on financial assets, etc. measured at
amortized cost, an allowance for doubtful accounts is recog-
nized for expected credit losses on such assets.
The Group assesses whether the credit risk associated with
each financial asset has increased significantly since the initial
recognition at each reporting date, and when the credit risk has
not increased significantly, the Group recognizes the 12-month
expected credit loss in allowance for doubtful accounts. When
the credit risk has increased significantly since the initial recog-
nition, the Group recognizes the amount equal to the lifetime
expected credit loss as allowance for doubtful accounts.
For trade and lease receivables that do not contain a signifi-
cant financial component, the Group always recognizes an al-
lowance for doubtful accounts in an amount equal to the
expected credit loss for the entire term, regardless of whether
credit risk has increased significantly from the time of initial
recognition.
In assessing whether there has been a significant increase
in credit risk, the Group considers information that is reason-
ably available and supportable (internal and external credit rat-
ings, etc.) in addition to information on the past due
information.
Expected credit loss is measured based on the present val-
ue of the difference between all contractual cash flows payable
to a company, and all contractual cash flows expected to be re-
ceived by a company.
Any issuer or debtor is deemed to be in default when col-
lecting of all or a portion of financial assets to such an issuer or
debtor is judged to be impossible or extremely difficult due to
condition such as its significant financial difficulty or breach of
contract including past due status.
In addition, if the Group does not have a reasonable expec-
tation of collecting all or a portion of given financial assets, the
Group directly reduce the gross carrying amount of a financial
asset.
The provision for allowance for doubtful accounts on finan-
cial assets is recognized in profit or loss. When an event that
reduces the allowance for doubtful accounts occurs, a reversal
of the allowance for doubtful accounts is recognized in profit or
loss.
2) Non-derivative financial liabilities
The Group initially recognizes financial liabilities on the date incurred,
and measures them at amortized cost. At initial recognition, financial
liabilities are measured by fair value, deducting transaction costs di-
rectly attributable to the issuance of the financial liability. In addition,
after initial recognition, they are measured at amortized cost based on
the effective interest method.
Financial liabilities are derecognized when they are extinguished,
that is, when the obligation specified in the contract is discharged,
cancelled or expired.
3) Derivatives and hedge accounting
The Group uses derivatives such as foreign exchange forward con-
tracts and interest rate swaps to hedge foreign exchange risk, and in-
terest rate risk, respectively. Of these derivatives, derivative instruments
that meet requirements for hedge accounting are designated as hedg-
ing instruments, and hedge accounting is applied to them.
In applying hedge accounting, the Group officially documents risk
management purposes, relationship between the hedging instrument
and the hedged item in executing the hedge transaction, and method
for assessing effectiveness of the hedging relationship at the inception
of the hedge. In addition, the Group assesses whether the derivative
designated as a hedging instrument is effective in offsetting changes
in cash flows of the hedged item at the inception of the hedge, and
subsequently on an ongoing basis.
These derivatives are initially recognized at fair value when the
contract is entered into, and subsequently remeasured at fair value,
and subsequent changes are accounted for as follows.
(i) Cash flow hedges
Of gains or losses on hedging instruments, the effective portion
is recognized as other comprehensive income, and the ineffec-
tive portion is recognized as profit or loss in the consolidated
statement of profit and loss.
Amounts relating to hedging instruments recognized as other
comprehensive income are reclassified to profit or loss when a
transaction that is the hedged item affects profit or loss. If a
hedged item gives rise to the recognition of non-financial assets
or non-financial liabilities, the amount recognized as other com-
prehensive income is accounted for as adjustment to the initial
carrying amount of the non-financial assets or non-financial lia-
bilities.
(ii) Derivatives not designated as hedges
Changes in fair value of derivatives are recognized as profit or
loss in the consolidated statement of profit and loss.
(5) Cash and cash equivalents
Cash and cash equivalents consist of cash on hand, deposits with-
drawable at any time, and short-term investments that are readily
convertible to cash and subject only to insignificant risk of changes in
value, and have a maturity of three months or less from the acquisi-
tion date.
010_0252087912303.indd 24010_0252087912303.indd 24 2023/04/12 20:09:392023/04/12 20:09:39

25
CORPORATE DATA
(6) Inventories
Inventories are measured at the lower of cost and net realizable value.
Net realizable value is the amount of the estimated selling price in the
ordinary course of business less the estimated costs and estimated
selling costs required up to the completion. Cost is calculated based
on the periodic average method, and includes cost of purchase, pro-
cessing cost, and all expenses required to reach the current place
and status.
(7) Property, plant and equipment
Property, plant and equipment are measured based on the cost mod-
el and are stated at cost less accumulated depreciation and accumu-
lated impairment losses.
Cost includes expenses directly related to acquisition of assets,
demolition and removal costs and restoration cost for land, and bor-
rowings costs to be capitalized.
Depreciation of each asset other than land and construction in
progress is recognized using the straight-line method over respective
estimated useful lives. Estimated useful lives by major asset item are
as follows:
Buildings and structures: mainly 2–50 years
Machinery, equipment and vehicles: mainly 2–15 years
Tools, furniture and fixtures: mainly 2–15 years
Estimated useful lives, residual value and depreciation method are
reviewed at the end of each fiscal year, and if there is any change, the
change is applied prospectively as a change in accounting estimates.
(8) Goodwill
Goodwill is not amortized. Goodwill is allocated to cash-generating
units that are expected to benefit from synergies of the business com-
bination, and is tested for impairment in each period, or whenever
there is any indication of impairment.
Impairment losses on goodwill are recognized in the consolidated
statement of profit and loss, and no reversal is made in future periods.
In addition, goodwill is presented at cost less accumulated impair-
ment losses in the consolidated statement of financial position.
(9) Intangible assets
Intangible assets are measured based on the cost model and are stat-
ed at cost less accumulated depreciation and accumulated impair-
ment losses.
Individually acquired intangible assets are measured at cost at ini-
tial recognition. Intangible assets acquired through business combina-
tions are recognized separately from goodwill at initial recognition, and
measured at fair value on the date of obtaining control.
Internally generated research-related costs are recognized as ex-
penses when they arise. Internally generated development costs are
recognized as assets only if all the requirements for being recognized
as assets are met. When research-related costs and development
costs are not clearly distinguishable, they are recognized as expenses,
as research-related costs, when incurred.
Acquisition of software for internal use and its development costs
are recognized as intangible assets when future economic benefits
are expected to flow to the Group.
Intangible assets with definite useful lives are amortized using the
straight-line method over respective estimated useful lives after initial
recognition. Estimated useful lives of major intangible assets are as
follows:
Trademark rights: mainly 9–10 years
( except for those with indefinite useful lives)
Software: mainly 5–10 years
Intangible assets with indefinite useful lives and intangible assets
that are not yet available for use are not amortized. Such intangible
assets are tested for impairment individually or at the level of each
cash-generating unit in each period and whenever there is any indica-
tion of impairment.
Estimated useful lives, residual value and amortization method are
reviewed at the end of each fiscal year, and if there is any change, the
change is applied prospectively as a change in accounting estimates.
(10) Leases
The Group assesses whether a contract is a lease or contains a lease,
at the inception of the contract. If the contract transfers the right to
control the use of an identified asset over a certain period of time in
exchange for consideration, the contract is judged to be a lease or
contain a lease.
(i) Lessee
In leases as a lessee, right-of-use assets and lease liabilities are
recognized at the inception of the lease. The amount of initial
measurement of right-of-use assets is the amount of initial mea-
surement of the lease liability adjusted for lease payments that
were paid at the inception or before the inception. Lease liabili-
ties are initially measured at the present value of lease pay-
ments that have not been paid as at the inception, discounted
using the interest rate implicit in the lease. When the interest
rate implicit in the lease cannot be calculated easily, the Group’s
incremental borrowing rate of interest is used.
After initial recognition, right-of-use assets are depreciated
using the straight-line method from the inception to the earlier
of the end of the useful life of the right-of-use asset and the end
of the lease period. Estimated useful lives of right-of-use assets
are determined in the same manner as the Group’s own proper-
ty, plant and equipment. Lease liabilities are measured at amor-
tized cost based on the effective interest method. Lease
payments are allocated to interest expenses and repayments of
lease liabilities based on the effective interest method. Interest
expenses are included in “Finance Costs” in the consolidated
statement of profit and loss.
The Group has elected not to recognize right-of-use assets
and lease liabilities for leases with the lease period of 12 months
or less or leases of small assets. The Group recognizes lease
payments for these leases as expenses over the lease period us-
ing either the straight-line method or any other systematic basis.
In addition, as a practical expedient, the Group has elected to
account for a lease component and related non-lease compo-
nents as a single lease component without separating non-lease
components from lease components.
010_0252087912303.indd 25010_0252087912303.indd 25 2023/04/12 20:09:392023/04/12 20:09:39
26
Shiseido | Integrated Report 2023
(ii) Lessor
When the Group is a lessor in leases, each lease is classified as
finance lease or operating lease at the time of entering into a
lease agreement. In classifying each lease, the Group compre-
hensively assesses whether or not substantially all of the risks
and rewards incidental to ownership of the underlying asset are
transferred. Leases are classified as finance leases if such risks
and rewards are transferred, and otherwise as operating leases.
When the Group is an intermediate lessor, head leases and
sub leases are accounted for separately. The classification of
sub leases is determined by reference to right-of-use assets
generated from head leases, rather than underlying assets.
Lease payments in operating lease transactions are recog-
nized as revenue using the straight-line method over the lease
period, and included in “Other Operating Income” in the con-
solidated statement of profit and loss.
(11) Impairment of non-financial assets
For carrying amounts of non-financial assets of the Group excluding
inventories and deferred tax assets, it is judged at the end of each pe-
riod whether there is any indication of impairment. If there is an indi-
cation of impairment, the recoverable amount of the relevant asset is
estimated. For goodwill and intangible assets with indefinite useful
lives or those which are not yet available for use, the recoverable
amount is estimated at the same time each year, regardless of any in-
dication of impairment.
The recoverable amount of assets or cash-generating units is the
larger of value in use and fair value less costs of disposal. In the cal-
culation of value in use, estimated future cash flows are discounted to
the present value using a pre-tax discount rate that reflects time value
of money and risks inherent in the asset. Assets that are not tested in-
dividually in impairment tests are aggregated to the smallest
cash-generating unit which generates cash inflows from continuing
use that are largely independent of cash inflows from other assets or
asset groups. When goodwill is tested for impairment, cash-generating
units to which the goodwill is allocated are aggregated so that the level
at which impairment is tested reflects the lowest level to which the
goodwill relates. Goodwill acquired through business combinations is
allocated to the cash-generating unit expected to benefit from syner-
gies of the combination.
Impairment losses are recognized as profit or loss if the carrying
amount of assets or cash-generating units exceeds the estimated re-
coverable amount. Impairment losses recognized in relation to a
cash-generating unit are first allocated to reduce the carrying amount
of the goodwill allocated to the unit, and then to reduce the carrying
amount of other assets in the cash-generating unit on a pro rata basis.
Previously recognized impairment losses, except for goodwill, are
assessed at the end of each period for whether or not there is any in-
dication of decrease or extinguishment of loss, and reversed up to the
carrying amount after deducting necessary depreciation and amorti-
zation from the carrying amount in the case where the impairment
losses had not been recognized.
(12) Employee benefits
The Group adopts defined benefit pension plans and defined contri-
bution pension plans as post-employment benefits for employees.
The Group determines the present value of defined benefit obliga-
tions and related current service cost and past service cost using the
projected unit credit method.
The discount rate is determined by reference to market yields on
high-quality corporate bonds at the end of the reporting period corre-
sponding to the discount period, which is established to reflect the
period until the estimated timing of benefit payments in each fiscal
year in the future.
Liabilities or assets pertaining to defined benefit pension plans are
calculated by deducting the fair value of plan assets from the present
value of defined benefit obligations.
Remeasurements of defined benefit pension plans are collectively
recognized in other comprehensive income for the period when they
are incurred, and the cumulative amount is immediately transferred
from other components of equity to retained earnings.
Past service cost is recognized in profit or loss for the period when
it is incurred.
Expenses relating to defined contribution retirement benefits are
recognized as expenses in the period when employees render ser-
vices.
(13)Share-based payments
The Group has adopted a stock option plan as equity-settled stock-
based compensation plan, and a performance share unit plan as eq-
uity-settled and cash-settled performance-linked stock remuneration
plan.
Stock options are estimated based on fair value on the grant date,
and recognized as expenses in the consolidated statement of profit
and loss over the vesting period with consideration of the number of
stock options expected to eventually vest, and the same amount is
recognized as an increase in equity in the consolidated statement of
financial position. Fair value of granted options is calculated using the
Hull-White modified binomial model with consideration of various con-
ditions of the options. In addition, the conditions are reviewed regular-
ly, and the estimate of the number of stock options vested is revised
as necessary.
Of the performance share unit plan, the portion that falls under the
category of equity-settled payment transactions is measured by refer-
ence to fair value of the Company’s shares granted and recognized as
expenses over the vesting period, and the same amount is recognized
as an increase in equity. On the other hand, for the portion that falls
under the category of cash-settled payment transactions, services re-
ceived are measured at fair value of liabilities arising and recognized
as expenses over the vesting period, and the same amount is recog-
nized as an increase in liabilities. The fair value of these liabilities is
remeasured on the reporting date and the settlement date, and any
change in the fair value is recognized as profit or loss.
(14) Provisions
Provisions are recognized when the Group has present legal or con-
structive obligations as a result of past events, it is probable that an
010_0252087912303.indd 26010_0252087912303.indd 26 2023/04/12 20:09:392023/04/12 20:09:39

27
CORPORATE DATA
outflow of economic resources will be required to settle the obliga-
tions, and the amount of the obligations can be estimated reliably.
When time value of money is material, estimated future cash flows are
discounted to the present value using a pre-tax interest rate that re-
flects time value of money and risks inherent in the liabilities. Unwind-
ing of the discount over time is recognized as finance costs.
(15) Revenue
The Group is engaged in production and sale of cosmetics such as
skin-care products, makeup products and fragrances, and in restau-
rant and hair salon businesses. As for sales of products, since cus-
tomers obtain control of the product at the time of delivery of the
product, etc., revenue is recognized at the time of delivery of the
product, etc. In addition, revenue is measured at an amount of con-
sideration promised in the agreement with the customer less dis-
counts, rebates, sales returns and others. The consideration expected
to be refunded to customers is recorded as refund liabilities in “Trade
and Other Payables” in the consolidated statement of financial posi-
tion. Variable consideration is included in the transaction price to the
extent that it is highly probable that a significant reversal of the cumu-
lative amount of revenue recognized will not occur, when uncertainty
associated with the variable consideration is subsequently resolved.
The consideration in contracts with customers does not contain a
significant financing component. The Group offers a point program
under which it is possible to make payments using the points at the
time of purchase of products in the future, to customers according to
sales of products, and identifies the portion of points expected to be
exercised by customers in the future as performance obligations in
the point program. Transaction prices are allocated to these perfor-
mance obligations based on the ratio of stand-alone selling prices,
which are consideration promised in the agreement with the customer
less discounts, rebates, sales returns and others. The amount allocat-
ed to performance obligations in the point program is deferred as
contract liabilities in “Other Current Liabilities” in the consolidated
statement of financial position, and revenue is recognized according
to the use of points with consideration of the forfeit rate.
(16) Governmental subsidies
Governmental subsidies are recognized at fair value when incidental
conditions for grant of subsidies are satisfied, and reasonable assur-
ance that the subsidies will be received is obtained.
If governmental subsidies relate to an expense item, they are rec-
ognized on a systematic basis as revenue over the period in which re-
lated costs intended to be covered by the subsidies are recognized as
expenses. Subsidies related to assets are recognized as deferred rev-
enue, and recognized in profit or loss on a systematic basis over use-
ful lives of the related assets.
(17) Income taxes
Income tax expense consist of current taxes and deferred taxes. They
are recognized as profit or loss, unless they arise from items recog-
nized directly in other comprehensive income or equity, and from
business combinations.
Current taxes are measured at an amount expected to be paid to
or refunded from tax authorities. Tax rates and tax law used in the
calculation of the tax amount are those which have been enacted or
substantially enacted by the period-end.
Deferred taxes are recognized for temporary differences that are
differences between tax base of assets and liabilities and their carry-
ing amount for accounting purposes, unused tax losses and unused
tax credits at period-end.
For the following temporary differences, deferred tax assets and li-
abilities are not recognized.
- Taxable temporary differences arising from initial recognition of
goodwill
- Temporary differences arising from initial recognition of assets
and liabilities generated from transactions that affect neither ac-
counting profit nor taxable income for tax purposes (tax loss), ex-
cept for business combination transactions
- As for deductible temporary differences related to investments in
subsidiaries and affiliates, cases where it is probable that the
temporary difference will not be reversed in the foreseeable fu-
ture, or where it is less likely that taxable income against which
the temporary difference will be used will be earned
- As for taxable temporary differences related to investments in
subsidiaries and affiliates, cases where the period when the tem-
porary difference will be reversed can be controlled and it is prob-
able that the temporary difference will not be reversed in the
foreseeable future
Deferred tax liabilities are recognized for all taxable temporary dif-
ferences in principle, and deferred tax assets are recognized for all
deductible temporary differences to the extent that it is probable that
taxable income sufficient to use the deductible temporary differences,
unused tax losses and unused tax credits will be earned.
Deferred tax assets and liabilities are measured using tax rates and
tax law that are expected to be applied during the period in which the
assets will be realized or the liabilities will be settled, based on tax
rates and tax law which have been enacted or substantially enacted
by the period-end.
Deferred tax assets and liabilities are offset when the legally en-
forceable right to set off current tax assets against current tax liabilities
is possessed, and taxes are levied by the same taxation authority on
the same taxable entity.
(18) Earnings per share
Basic earnings per share are calculated by dividing profit or loss at-
tributable to common shareholders of the parent company by the
weighted average number of shares of common stock issued, which
is adjusted for treasury shares during the period.
(19) Non-current assets held for sale
When the carrying amount of non-current assets (or disposal groups)
is recovered principally through a sale transaction rather than con-
tinuing use, the non-current assets (or disposal groups) are classified
as held for sale. To be classified as held for sale, assets are subject to
the condition that the sale is highly probable and the asset is available
for immediate sale in its present state, and are classified as held for
sale only if the management of the Group is committed to implemen-
tation of a plan to sell the asset and the sale is expected to be com-
pleted within one year.
010_0252087912303.indd 27010_0252087912303.indd 27 2023/04/12 20:09:392023/04/12 20:09:39
28
Shiseido | Integrated Report 2023
Non-current assets (or disposal groups) classified as held for sale
are measured at the lower of the carrying amount and fair value less
costs to sell, and they are not depreciated or amortized after being
classified as held for sale.
(20) Equity and other equity items
(i) Common stock
Common stock is recognized at issuance value in share capital
and capital surplus. In addition, stock issuing expenses are de-
ducted from issuance value.
(ii) Treasury shares
Treasury shares are valued at acquisition cost and deducted
from equity. In purchase, sale or cancellation of treasury shares
of the Company, gains or losses are not recognized. A difference
between the carrying amount and consideration at the time of
sale is recognized as equity.
(iii) Dividends
Of dividends paid to shareholders of the Company, a year-end
dividend is recognized as a liability in the period in which the
day when it was resolved at the Company’s General Meeting of
Shareholders falls, and an interim dividend is recognized as a li-
ability in the period in which the day when it was resolved by
the Board of Directors falls.
(21) Other significant accounting policies for preparation of
consolidated financial statements
(i) Application of consolidated taxation system
The Company and certain domestic consolidated subsidiaries
applied a consolidation taxation system with the Company as
the taxable parent company. From the next fiscal year, the Com-
pany and certain domestic consolidated subsidiaries will make
a transition from the consolidation taxation system to the group
tax sharing system.
The preparation of the Group’s consolidated financial statements un-
der IFRS requires management to adopt the accounting policies, to
make judgements, estimates and assumptions that affect the amounts
of assets, liabilities, revenues and expenses. Actual results may differ
from these estimates.
The estimates and the underlying assumptions are continuously
reviewed. The impact affected by the revision of the estimates will be
recognized in the accounting period of the revision and the future ac-
counting periods.
The items which may have the risk of significantly affecting the
consolidated financial statements for the following fiscal year, are as
follows:
(1) Valuation of goodwill related to the Shiseido Americas
Corporation (“SAC”) cash-generating unit
The “Americas Business” reportable segment includes goodwill
related to the SAC cash-generating unit of ¥27,399 million ($207,757
thousand). The Group identified a risk of significant estimates for this
valuation of goodwill.
The recoverable amount for the impairment of goodwill is
calculated as fair value less costs of disposal. Estimate of fair value
less costs of disposal are calculated by the discounted cash flow
method, which uses many estimates and assumptions such as future
cash flow, discount rates, long-term market growth rate. Future cash
flow is based on future projections, which consider information such
as past performance, current and expected economic conditions, and
market data. These estimates and assumptions may significantly
affect the result of impartment test and impairment losses. Valuations
by external specialists is utilized for the estimate of the fair value less
costs of disposal and the impairment test of these goodwill.
At the end of this fiscal year, the annual impairment test was
performed, and since the recoverable amount exceeded its carrying
amount, impairment losses of the goodwill had not been recognized.
Future cash flow used to calculate the fair value less costs of disposal
was estimated based on the future business plan of SAC cash-
generating unit and long-term market growth rate, and incorporates
the long-term market growth rate of the cosmetics market in the
United States and an improvement in sales, operating margin, and
other fronts through sales expansion plan as primary assumptions. In
addition, a discount rate which considers the company-specific risk
premium on top of risk-free rate in the United States is used.
Management determined that the estimates for the fair value less
costs of disposal on this test is reasonable, but it is possible that the
fair value will decline and impairment losses will occur due to
unexpectable changes in future business assumptions
The calculation method of the recoverable amount of the goodwill
is stated in “14. Goodwill and Intangible Assets” of the Notes.
04.
Significant Accounting Estimates and Judgments
010_0252087912303.indd 28010_0252087912303.indd 28 2023/04/12 20:09:392023/04/12 20:09:39

29
CORPORATE DATA
(1) Overview of Reportable Segments
Operating segments are components where the Company is able to obtain separate financial data and are subject to regular examination in order to
assist decision-making on allocation of managerial resources and evaluation of business performance by the Board of Directors.
The Group’s main business is the production and sale of cosmetics. The Group engages in business activities under a matrix organization encom-
passing brand categories based on consumer purchasing style and six regions (Japan, China, Asia Pacific, Americas, EMEA, and Travel Retail). This
matrix organization gives the leader in each region broad authority as well as responsibility for sales and profits to ensure flexible decision-making. In
specific terms, the Group’s seven reportable segments, which mainly refer to regions, are the “Japan Business,” “China Business,” “Asia Pacific
Business,” “Americas Business,” “EMEA Business,” “Travel Retail Business,” and “Professional Business.”
The Japan Business mainly comprises domestic business by brand category (Prestige, Fragrance, Premium, etc.) and the healthcare business
(sale of health & beauty foods as well as over-the-counter drugs).
The China Business covers business in China by brand category (Prestige, Fragrance, Cosmetics, etc.).
The Asia Pacific Business covers business in the Asia and Oceania regions excluding Japan and China by brand category (Prestige, Fragrance,
Cosmetics, etc.).
The Americas Business covers business in the Americas region by brand category (Prestige, Fragrance, etc.).
The EMEA Business covers business in Europe, the Middle East and African regions by brand category (Prestige, Fragrance, etc.).
The Travel Retail Business covers the operation of worldwide duty-free stores by brand category (Prestige, Fragrance, Cosmetics, etc.).
The Professional Business encompasses the sale of hair and beauty salon products in Japan, China, and other countries and regions in Asia.
Other includes head office administration departments, IPSA Co., Ltd., manufacturing operations and the Restaurant business, etc.
(Changes of reportable segments, etc.)
The Group has revised its reportable segment classifications from the fiscal year ended December 31, 2022. The business results of Shiseido Beauty
Salon Co., Ltd., previously included in the Other segment, are now included in the Japan Business.
The business results related to the brand holder functions of the NARS and Drunk Elephant brands, previously included in the Americas Busi-
ness, are now included in the Other segment.
Segment information for the fiscal year ended December 31, 2021 has been restated to reflect the reclassification.
(2) Method to Determine Sales and Profit (Loss) by Reportable Segment
The accounting policies for reportable segments are the same as those presented in “3. Notes on Accounting Policies” of the Notes.
Profit by reportable segments is stated on the basis of core operating profit, which is operating profit (loss) by excluding profit and loss caused by
non-ordinary factors such as structural reform expenses and impairment losses, etc.
Intersegment transaction pricing and transfer pricing are determined based on prevailing market prices.
None of the new standards or interpretations that have been established or revised by the date of approval for the announcement of the consoli-
dated financial statements have a material impact on the consolidated financial statements.
05.
Published standards and interpretations not yet adopted
06.
Operating Segment
010_0252087912303.indd 29010_0252087912303.indd 29 2023/04/12 20:09:392023/04/12 20:09:39
30
Shiseido | Integrated Report 2023
(3) Segment Revenue and Business Result
Revenue and business results by reportable segment of the Group are as follows:
Fiscal Year Ended December 31, 2021 (January 1 to December 31, 2021)
Millions of yen
Reportable Segment
Japan Business
(Note 4)
China Business
(Note 4)
Asia Pacific Business
(Note 4)
Americas Business EMEA Business
(Note 1)
Travel Retail Business
Net sales
Sales to external customers
258,837 274,721 63,597 121,369 117,016 120,562
Intersegment sales or transfer
24,759 1,108 2,108 7,776 10,438 154
Total
283,596 275,830 65,705 129,146 127,455 120,717
Segment profit (loss)
i.e. Core operating profit
6,481 4,095 5,048 1,624 2,706 22,737
Other information
Depreciation and amortization
12,819 8,854 3,343 11,080 9,330 1,353
Impairment losses
118 — — 25,317 15,600 —
Reversal of impairment losses
— — 466 252 — —
Reportable Segment
Other
(Note 2, 4)
Total
Adjustments
(Note 3)
Consolidation
Professional Business
Net sales
Sales to external customers
15,282 38,579 1,009,966 — 1,009,966
Intersegment sales or transfer
607 230,524 277,478 (277,478) —
Total
15,890 269,103 1,287,445 (277,478) 1,009,966
Segment profit (loss)
i.e. Core operating profit
714 14,122 57,531 (14,977) 42,553
Other information
Depreciation and amortization
85 29,189 76,058 — 76,058
Impairment losses
— 3,435 44,472 — 44,472
Reversal of impairment losses
— — 719 — 719
Note:
1. The EMEA Business includes the Middle East and African regions.
2. The Other segment includes head office administration departments, IPSA Co., Ltd., manufacturing operations and the Restaurant business, etc.
3. Segment profit (loss) adjustment is mainly intersegment transaction eliminations.
4. Net sales from regional sales subsidiaries related to the Personal Care business, previously recorded in Japan, China, and Asia Pacific Business, are no longer recorded with some exceptions
from July 1, 2021 due to the transfer of said business and resulting changes in product distribution. Meanwhile, Personal Care products sales from the Company and its manufacturing
subsidiaries to Fine-Today Co., Ltd. (which has changed its company name from FineToday Shiseido Co., Ltd. effective January 1, 2023) and its affiliates are recorded in the Other segment
effective from the same date.
5. Amounts of segment assets and segment liabilities are not presented as they are not subject to regular review for the purpose of making decisions about the allocation of management resources
and assessing the Group’s business performance.
010_0252087912303.indd 30010_0252087912303.indd 30 2023/04/12 20:09:392023/04/12 20:09:39

31
CORPORATE DATA
Fiscal Year Ended December 31, 2022
Millions of yen
Reportable Segment
Japan Business China Business Asia Pacific Business Americas Business EMEA Business
(Note 1)
Travel Retail Business
Net sales
Sales to external customers
237,565 258,226 68,017 137,916 128,440 163,650
Intersegment sales or transfer
6,705 1,643 3,118 3,518 9,461 138
Total
244,271 259,870 71,136 141,434 137,901 163,789
Segment profit (loss)
i.e. Core operating profit
(13,089) (3,941) 4,716 7,660 6,926 37,678
Other information
Depreciation and amortization
12,907 9,756 3,700 8,527 7,438 1,849
Impairment losses
— — — 2,809 — —
Reversal of impairment losses
— — — 494 — —
Reportable Segment
Other
(Note 2)
Total
Adjustments
(Note 3)
Consolidation
Professional Business
(Note 4)
Net sales
Sales to external customers
9,337 64,200 1,067,355 — 1,067,355
Intersegment sales or transfer
351 237,353 262,291 (262,291) —
Total
9,688 301,554 1,329,646 (262,291) 1,067,355
Segment profit (loss)
i.e. Core operating profit
750 6,078 46,780 4,559 51,340
Other information
Depreciation and amortization
37 31,498 75,718 — 75,718
Impairment losses
— 13,782 16,592 — 16,592
Reversal of impairment losses
— — 494 — 494
Fiscal Year Ended December 31, 2022
Thousands of U.S. dollars
Reportable Segment
Japan Business China Business Asia Pacific Business Americas Business EMEA Business
(Note 1)
Travel Retail Business
Net sales
Sales to external customers
1,801,372 1,958,038 515,749 1,045,769 973,916 1,240,901
Intersegment sales or transfer
50,842 12,458 23,643 26,676 71,739 1,046
Total
1,852,222 1,970,503 539,399 1,072,445 1,045,655 1,241,955
Segment profit (loss)
i.e. Core operating profit
(99,249) (29,883) 35,760 58,083 52,517 285,699
Other information
Depreciation and amortization
97,869 73,976 28,056 64,657 56,400 14,020
Impairment losses
— — — 21,300 — —
Reversal of impairment losses
— — — 3,746 — —
Reportable Segment
Other
(Note 2)
Total
Adjustments
(Note 3)
Consolidation
Professional Business
(Note 4)
Net sales
Sales to external customers
70,799 486,806 8,093,380 — 8,093,380
Intersegment sales or transfer
2,662 1,799,765 1,988,861 (1,988,861) —
Total
73,461 2,286,579 10,082,241 (1,988,861) 8,093,380
Segment profit (loss)
i.e. Core operating profit
5,687 46,087 354,716 34,569 389,293
Other information
Depreciation and amortization
281 238,838 574,143 — 574,143
Impairment losses
— 104,504 125,811 — 125,811
Reversal of impairment losses
— — 3,746 — 3,746
Note:
1. The EMEA Business includes Europe, the Middle East and African regions.
2. The Other segment includes head office administration departments, IPSA Co., Ltd., manufacturing operations and the Restaurant business, etc.
3. Segment profit (loss) adjustment is mainly intersegment transaction eliminations.
4. Net sales from regional sales subsidiaries previously recorded in the Professional Business is no longer recorded with some exceptions from July 1, 2022 due to the transfer of Professional
Business.
5. Amounts of segment assets and segment liabilities are not presented as they are not subject to regular review for the purpose of making decisions about the allocation of management resources
and assessing the Group’s business performance.
010_0252087912303.indd 31010_0252087912303.indd 31 2023/04/12 20:09:392023/04/12 20:09:39
32
Shiseido | Integrated Report 2023
Adjustments from segment profit to operating profit are as follows:
2021/12 2022/12 2022/12
Millions of yen Millions of yen Thousands of U.S. dollars
Segment profit
42,553 51,340 389,293
Gain on transfer of business
133,843 15,294 115,969
Structural reform expenses
(28,807) (6,568) (49,803)
Government grant income on COVID-19
1,894 592 4,489
Loss on COVID-19
(4,440) (1,816) (13,770)
Impairment losses
(44,472) (16,410) (124,431)
Reversal of impairment losses
— 494 3,746
Gain on sale of fixed assets
— 3,645 27,639
Operating profit
100,571 46,572 353,139
“Gain on transfer of business” for the fiscal year ended December 31, 2021 are the gain on transfer of assets which the Company and five of its
subsidiaries operating the Personal Care Business in Asia Pacific (Shiseido China Co., Ltd., Shiseido Cosmetics Manufacturing Co., Ltd., Shiseido
Hong Kong Ltd., Shiseido Singapore Co., (Pte.) Ltd., and Shiseido Korea Co., Ltd.) transferred to affiliates of Fine Today Co., Ltd. The gain on transfer
of business is included in “Other operating income” in consolidated statement of profit and loss.
“Gain on transfer of business” for the fiscal year ended December 31, 2022 are the gain on transfer of assets which seven of the Company’s
subsidiaries operating the Personal Care Business in Asia Pacific (Taiwan Shiseido Co., Ltd., FLELIS International Inc., Shiseido Malaysia Sdn.Bhd.,
PT. Shiseido Cosmetics Indonesia, Shiseido Philippines Corporation, Shiseido Thailand Co., Ltd., and Shiseido Cosmetics Vietnam Co., Ltd.) trans-
ferred to affiliates of Fine Today Co., Ltd., the gain on transfer of assets which the Company and four of its subsidiaries operating the Professional
Business in Asia Pacific (Shiseido China Co., Ltd., Shiseido Hong Kong Ltd., Shiseido Singapore Co., (Pte.) Ltd., and Shiseido Korea Co., Ltd.)
transferred to Henkel AG & Co. KGaA Group companies, and the gain on transfer of all outstanding shares of Shiseido Professional (Thailand) Co.,
Ltd. to Henkel AG & Co. KGaA Group companies. The gain on transfer of business is included in “Other operating income” in consolidated state-
ment of profit and loss.
“Structural reform expenses” for the fiscal year ended December 31, 2021 are mainly the costs associated with the termination of an exclusive
global license agreement with Dolce&Gabbana S.r.l., organizational reform in Europe, the transfer of the three prestige makeup brands, and the
transfer of the Personal Care Business. The expenses are included in “Selling, general and administrative expenses” in consolidated statement of
profit and loss.
“Structural reform expenses” for the fiscal year ended December 31, 2022 are mainly the costs associated with the transfer of the three prestige
makeup brands, the transfer of the Personal Care Business, the transfer of the Professional Business. The expenses are included in “Cost of sales,”
“Selling, general and administrative expenses,” and “Other operating expenses” in consolidated statement of profit and loss.
“Impairment losses” for the fiscal year ended December 31, 2021 are the impairment losses associated with the trademark due to termination of
an exclusive global license agreement with Dolce&Gabbana S.r.l., assets groups related to the transfer of three prestige makeup brands, and assets
groups related to the production of hyaluronic acid at the factory due to the decision to discontinue the business. The impairment losses are includ-
ed in “Cost of sales,” “Selling, general and administrative expenses,” and “Other operating expenses” in consolidated statement of profit and loss.
“Impairment losses” for the fiscal year ended December 31, 2022 are mainly the impairment losses associated with assets groups related to the
conclusion of agreement to transfer manufacturing operations of personal care products conducted at Shiseido Kuki Factory and Shiseido Vietnam
Factory and the impairment losses associated with right-of-use assets due to decline in profitability of offices subleased by Shiseido Americas Corpo-
ration. The impairment losses are included in “Cost of sales” and “Selling, general and administrative expenses” in consolidated statement of profit
and loss.
“Reversal of impairment losses” for the fiscal year ended December 31, 2022 are the reversal impairment losses of right-of-use assets associated
with the recovery in profitability of offices subleased by Shiseido Americas Corporation. The income is included in “Other operating income” in con-
solidated statement of profit and loss.
“Gain on sales of fixed assets” for the fiscal year ended December 31, 2022 are income arising from the sales of land and buildings related to of-
fice relocation in the Japan Business and the sales of company housing in the Other segment. The income is included in “Other operating income”
in consolidated statement of profit and loss.
010_0252087912303.indd 32010_0252087912303.indd 32 2023/04/12 20:09:392023/04/12 20:09:39
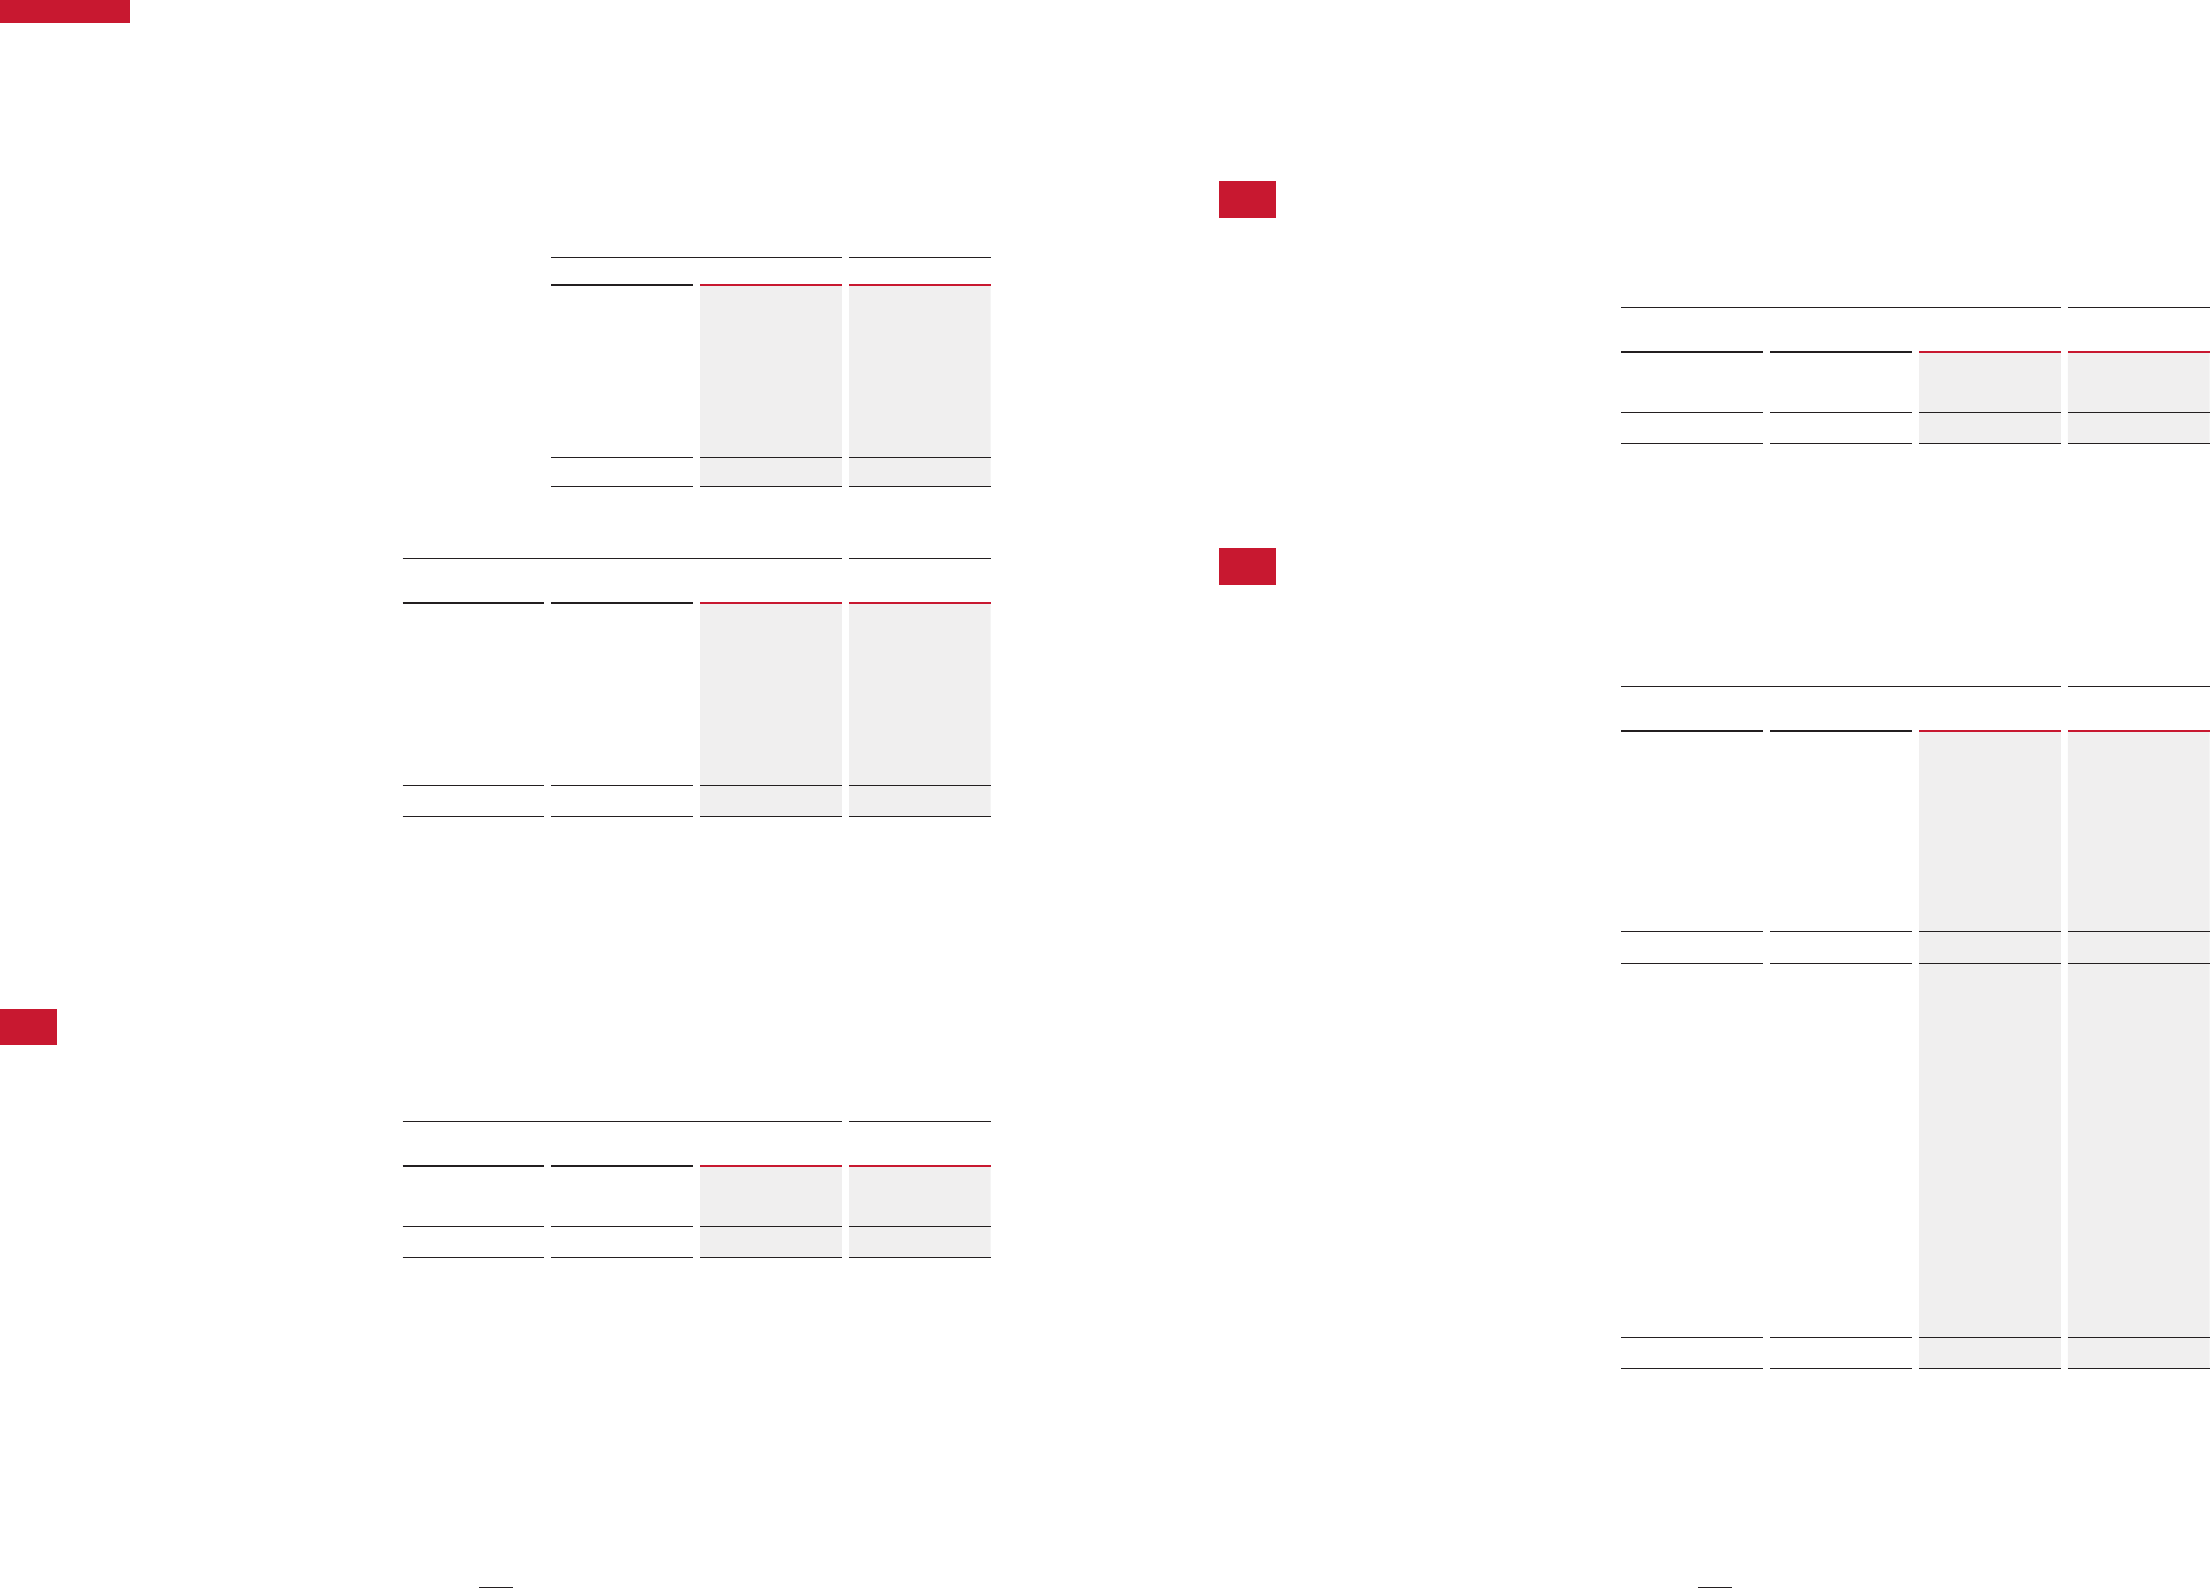
33
CORPORATE DATA
(4) Information by geographical area
The breakdown of net sales and non-current assets by geographical area is as follows:
Sales
Millions of yen Thousands of U.S. dollars
2021/12 2022/12 2022/12
Japan
297,542 298,565 2,263,914
Americas
127,524 146,546 1,111,207
(of which, U.S.)
109,344 121,409 920,602
EMEA
125,053 141,662 1,074,173
Asia and Oceania
459,846 480,581 3,644,078
(of which, China)
343,655 348,512 2,642,645
Total
1,009,966 1,067,355 8,093,380
Note: Net sales are based on the locations of customers, and are classified according to country or geographical area.
Non-current assets
Millions of yen Thousands of U.S. dollars
IFRS transition date
2021/12 2022/12 2022/12
(January 1, 2021)
Japan
395,587 411,885 394,536 2,991,629
Americas
200,941 142,999 157,710 1,195,860
(of which, U.S.)
200,351 142,191 156,838 1,189,248
EMEA
88,545 27,439 29,415 223,044
Asia and Oceania
41,416 42,828 38,151 289,286
(of which, China)
21,158 20,597 19,181 145,443
Total
726,490 625,153 619,812 4,699,818
Note: Non-current assets are based on the locations of assets, and are classified according to country or geographical area. Furthermore, financial instruments, deferred tax assets, and retirement
benefit asset are not included.
(5) Information about major customers
This information is omitted because no external customer accounts for 10% or more of net sales in the consolidated financial profit and loss.
07.
Cash and Cash Equivalents
The breakdown of cash and cash equivalents is as follows:
Millions of yen Thousands of U.S. dollars
IFRS transition date
(January 1, 2021)
2021/12 2022/12 2022/12
Cash and deposits
115,347 156,503 119,036 902,608
Short-term Investments
21,000 — — —
Total
136,347 156,503 119,036 902,608
Cash and cash equivalents are classified as financial assets measured at amortized cost.
The balance of cash and cash equivalents on the consolidated statement of financial position agrees with the balance of cash and cash
equivalents on the consolidated statement of cash flows.
010_0252087912303.indd 33010_0252087912303.indd 33 2023/04/12 20:09:392023/04/12 20:09:39
34
Shiseido | Integrated Report 2023
08.
Trade and Other Receivables
09.
Other Financial Assets
The breakdown of trade and other receivables is as follows, and amounts are shown after deducting allowance for doubtful accounts.
Millions of yen Thousands of U.S. dollars
IFRS transition date
(January 1, 2021)
2021/12 2022/12 2022/12
Notes and accounts receivable
141,086 147,078 165,210 1,252,730
Others
5,421 11,712 16,859 127,836
Total
146,507 158,791 182,069 1,380,566
Trade and other receivables are classified as financial assets measured at amortized cost.
(1) Breakdown of other financial assets
The breakdown of other financial assets is as follows, and amounts are shown after deducting allowance for doubtful accounts.
Millions of yen Thousands of U.S. dollars
IFRS transition date
(January 1, 2021)
2021/12 2022/12 2022/12
Other financial assets (current)
Financial assets measured at amortized cost
Deposits
14,665 15,553 15,459 117,220
Others
855 876 996 7,552
Financial assets measured at fair value through profit or
loss
Derivative assets
308 — 2,043 15,491
Total
15,829 16,429 18,498 140,264
Other financial assets (non-current)
Financial assets measured at amortized cost
Deposits
15 1 1 8
Long-term loans receivable
0 31,116 39,183 297,111
Guarantee and leasehold deposits
26,457 24,832 24,574 186,336
Others
2,209 5,935 4,684 35,517
Financial assets measured at fair value through profit or
loss
Others
3,978 3,250 6,540 49,591
Financial assets measured at fair value through other
comprehensive income
Shares and investments in capital
11,585 8,640 9,717 73,681
Total
44,246 73,777 84,701 642,258
010_0252087912303.indd 34010_0252087912303.indd 34 2023/04/12 20:09:392023/04/12 20:09:39
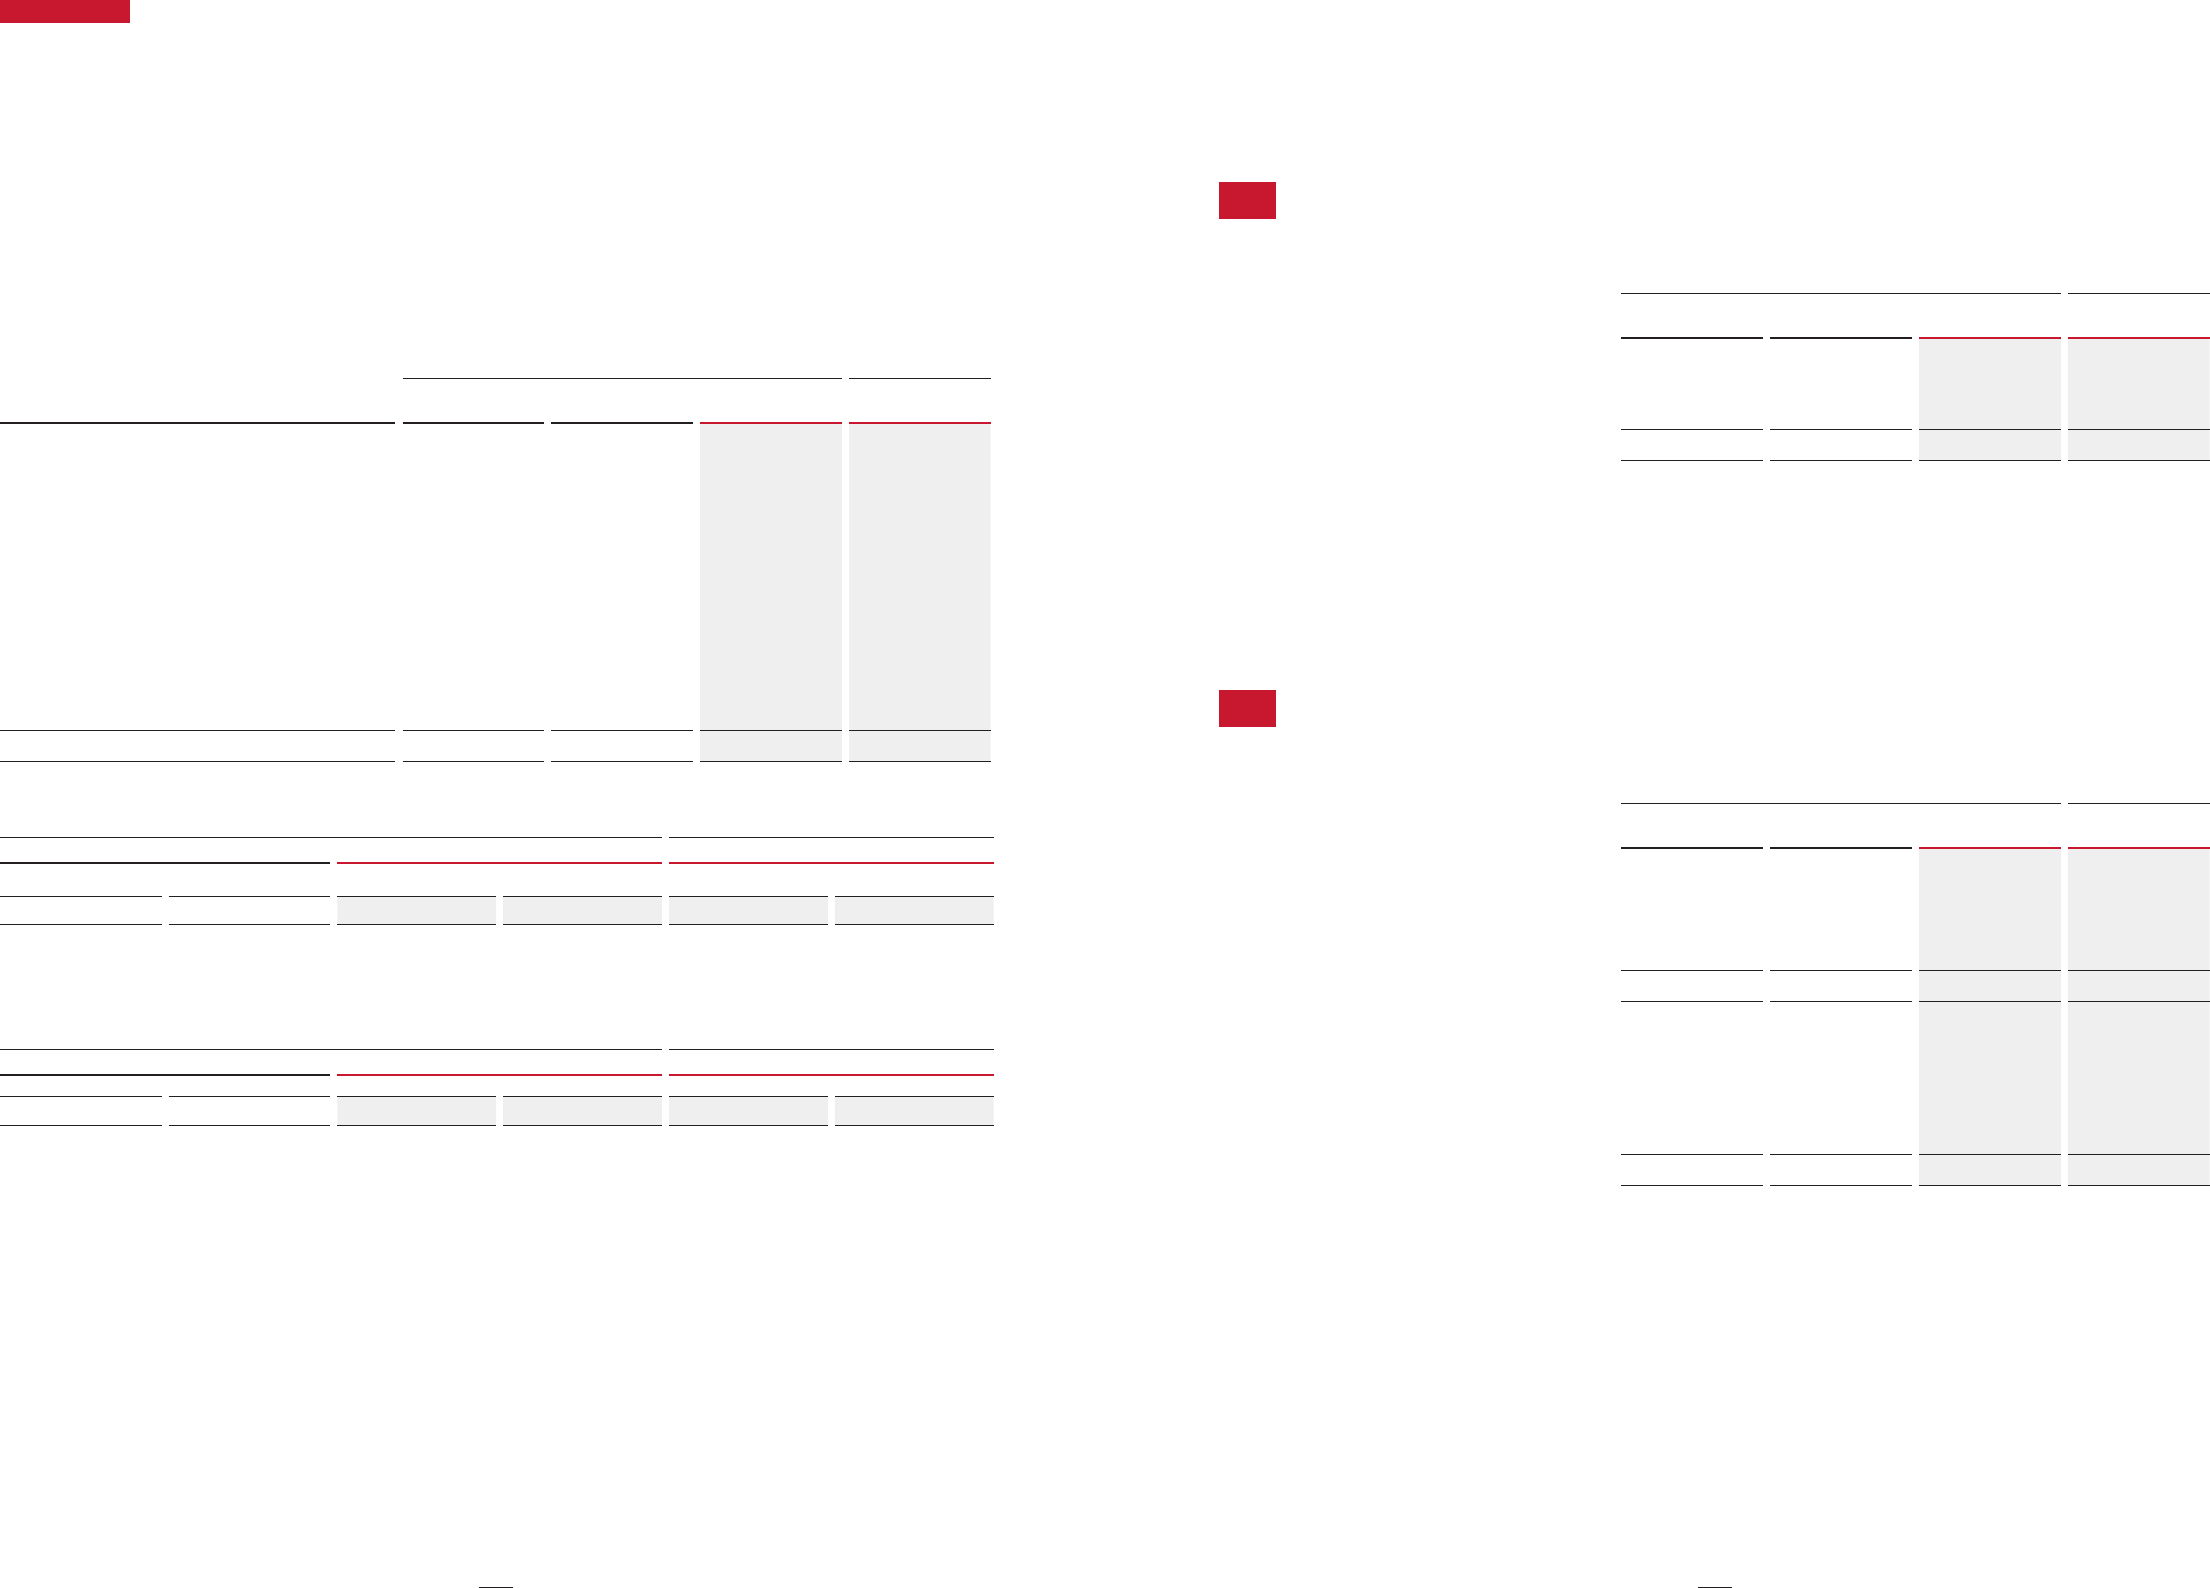
35
CORPORATE DATA
(2) Financial assets measured at fair value through other comprehensive income
The Group holds shares and investments in capital that it believes will contribute to its sustainable growth and enhancement of corporate value over
the medium- to long-term. As they are held mainly for investment purposes as part of a business strategy, the Group designates them as financial
assets measured at fair value through other comprehensive income.
The names of issues, fair values, etc. of the major financial assets measured at fair value through other comprehensive income are as follows:
Millions of yen Thousands of U.S. dollars
Issues
IFRS transition date
(January 1, 2021)
2021/12 2022/12 2022/12
Listed shares
Perfect Corp.
— — 1,224 9,281
AEON CO., LTD.
746 598 616 4,671
PLANET, INC.
437 438 147 1,115
ZERIA Pharmaceutical Co., Ltd.
171 58 — —
PALTAC CORPORATION
2,524 — — —
NIPPON FINE CHEMICAL CO., LTD.
664 — — —
Others
831 882 1,092 8,280
Unlisted shares
4,180 3,547 3,490 26,463
Others
2,028 3,114 3,147 23,863
Total
11,585 8,640 9,717 73,681
The breakdown of dividend income recognized from equity instruments measured at fair value through other comprehensive income is as follows:
Millions of yen Thousands of U.S. dollars
2021/12 2022/12 2022/12
Investments derecognized during
the fiscal year
Investments held at the end of the
fiscal year
Investments derecognized during
the fiscal year
Investments held at the end of the
fiscal year
Investments derecognized during
the fiscal year
Investments held at the end of the
fiscal year
46 226 3 67 23 508
For such purposes as enhancing asset efficiency and reviewing business relationships, the Group has sold and derecognized certain equity instru-
ments measured at fair value through other comprehensive income.
The fair value upon sale and the cumulative gains or losses on sale in each fiscal year are as follows:
Millions of yen Thousands of U.S. dollars
2021/12 2022/12 2022/12
Fair value Cumulative gains or losses on sale Fair value Cumulative gains or losses on sale Fair value Cumulative gains or losses on sale
3,890 2,666 301 260 2,282 1,971
The Group recognizes gains or losses from changes in fair value after initial recognition and from derecognition as other comprehensive income, and
the cumulative amounts thereof are immediately reclassified to retained earnings after being recognized in other components of equity. The amounts
(after tax) of other components of equity reclassified to retained earnings in the previous fiscal year and the current fiscal year were ¥125 million and
¥(614) million ($(4,656) thousand), respectively.
010_0252087912303.indd 35010_0252087912303.indd 35 2023/04/12 20:09:392023/04/12 20:09:39
36
Shiseido | Integrated Report 2023
10.
Inventories
11.
Other Assets
The breakdown of inventories is as follows:
Millions of yen Thousands of U.S. dollars
IFRS transition date
(January 1, 2021)
2021/12 2022/12 2022/12
Merchandise and finished goods
113,786 82,459 81,843 620,587
Work in process
6,766 7,295 6,348 48,135
Raw materials and supplies
42,448 44,393 42,749 324,151
Total
163,001 134,147 130,942 992,873
The amounts of inventories recognized as expenses in the previous fiscal year and the current fiscal year were ¥260,819 million and ¥301,897 mil-
lion ($2,289,180 thousand), respectively, and these amounts were included in cost of sales.
Furthermore, the amounts of inventory write-downs recognized as expenses in the previous fiscal year and the current fiscal year were ¥18,772
million and ¥21,140 million ($160,297 thousand), respectively. There were no material reversals of write-downs in the previous or current fiscal
years.
There were no inventories pledged as collateral for liabilities.
The breakdown of other assets is as follows:
Millions of yen Thousands of U.S. dollars
IFRS transition date
(January 1, 2021)
2021/12 2022/12 2022/12
Other current assets
Prepaid expenses
10,108 11,111 11,074 83,970
Consumption taxes refund receivable
24,784 24,324 22,075 167,387
Others
9,806 9,682 21,602 163,800
Total
44,698 45,117 54,753 415,157
Other non-current assets
Investment property
8,623 1,704 1,711 12,974
Long-term prepaid expenses
3,116 2,510 2,192 16,621
Others
1,424 825 2,195 16,644
Total
13,163 5,040 6,098 46,239
010_0252087912303.indd 36010_0252087912303.indd 36 2023/04/12 20:09:392023/04/12 20:09:39

37
CORPORATE DATA
12.
Non-current Assets Held for Sale and Disposal Groups
(1) Non-current assets and liabilities held for sale
The breakdown of assets and liabilities classified as held for sale is as follows:
Millions of yen Thousands of U.S. dollars
IFRS transition date
(January 1, 2021)
2021/12 2022/12 2022/12
Assets held for sale
Cash and cash equivalents
— — 500 3,791
Trade and other receivables
— — 70 531
Inventories
— 1,609 5,953 45,140
Other current assets
— — 48 364
Property, plant and equipment
— 323 3,433 26,031
Intangible assets
— — 2 15
Right-of-use assets
— — 410 3,109
Investments accounted for using equity method
— — 8,498 64,437
Deferred tax assets
— — 11 83
Total assets
— 1,933 18,929 143,532
Liabilities directly attributable to assets held for sale
Trade and other payables
— — 763 5,786
Other financial liabilities
— — 297 2,252
Income taxes payable
— — 7 53
Other current liabilities
— — 27 205
Provisions
— — 445 3,374
Total liabilities
— — 1,541 11,685
The main assets and liabilities held for sale in the previous fiscal year were inventories held by a subsidiary of the Company that were scheduled for
transfer in the fiscal year 2022 and classified as held for sale in conjunction with the conclusion of an agreement to transfer the Personal Care
business. The sale of the assets has been completed in the current fiscal year. The gain on the transfer of the assets was ¥4,393 million ($33,311
thousand), and the amount is included in “Other operating income” in the consolidated statement of profit and loss.
Assets and liabilities held for sale in the current fiscal year were assets held by a subsidiary of the Company that are scheduled for transfer in the
fiscal year 2023 in conjunction with the conclusion of an agreement to transfer the Professional business, assets and liabilities held by the Company
and the subsidiary and shares held by the Company scheduled for transfer in the fiscal year 2023 in conjunction with the conclusion of an agree-
ment to transfer the production business of personal care products conducted at Shiseido Kuki Factory and Shiseido Vietnam Factory, and assets
held by the Company that are scheduled for transfer in the fiscal year 2023 following the conclusion of a real estate transfer agreement. The impair-
ment losses recognized for those shares upon their classification as held for sale are included in “Share of profit (loss) of investment accounted for
using equity method” in the consolidated statement of profit and loss. The details of the impairment losses recognized for property, plant and
equipment, intangible assets, and other non-current assets related to the production business of personal care products recognized in conjunction
with their classification as held for sale are presented in “15. Impairment of Non-financial Assets” of the Notes. Furthermore, exchange differences
on translation of foreign operations of ¥745 million ($5,649 thousand) were recognized as other components of equity related to assets held for sale
in the current fiscal year.
010_0252087912303.indd 37010_0252087912303.indd 37 2023/04/12 20:09:392023/04/12 20:09:39
38
Shiseido | Integrated Report 2023
13.
Property, Plant and Equipment
(1) Schedule of changes
Changes in cost, accumulated depreciation and accumulated impairment losses, and carrying amount of property, plant and equipment are as
follows:
[Cost]
Millions of yen
Buildings and structures
Machinery, equipment and
vehicles
Tools, furniture and fixtures Land Construction in progress Total
Balance as of January 1, 2021
256,933 118,913 129,962 45,337 27,308 578,455
Purchase
1,826 705 11,124 1,279 38,495 53,432
Acquisition through business
combination
— — — — — —
Sale or disposal
(5,877) (3,412) (23,167) (0) (72) (32,531)
Reclassification
27,887 12,919 6,911 369 (49,213) (1,125)
Reclassification to assets held for
sale
— — (1,213) — — (1,213)
Exchange differences on translation
of foreign operations
4,442 3,013 6,643 265 265 14,630
Others
209 261 (686) — (595) (810)
Balance as of December 31, 2021
285,421 132,401 129,574 47,251 16,188 610,837
Purchase
372 570 10,052 — 20,850 31,846
Acquisition through business
combination
— — — — — —
Sale or disposal
(9,830) (6,274) (18,124) (412) (78) (34,719)
Reclassification
2,348 22,366 4,893 243 (31,587) (1,735)
Reclassification to assets held for
sale
(21,499) (14,017) (2,960) (1,533) (265) (40,276)
Exchange differences on translation
of foreign operations
4,775 3,332 6,289 152 311 14,863
Others
(376) (1) (59) — 6 (430)
Balance as of December 31, 2022
261,212 138,377 129,665 45,702 5,425 580,383
Thousands of
U.S. dollars
Buildings and structures
Machinery, equipment and
vehicles
Tools, furniture and fixtures Land Construction in progress Total
Balance as of December 31, 2021
2,164,248 1,003,951 982,514 358,288 122,748 4,631,764
Purchase
2,821 4,322 76,221 — 158,098 241,477
Acquisition through business
combination
— — — — — —
Sale or disposal
(74,537) (47,574) (137,428) (3,124) (591) (263,262)
Reclassification
17,804 169,594 37,102 1,843 (239,513) (13,156)
Reclassification to assets held for
sale
(163,019) (106,286) (22,445) (11,624) (2,009) (305,399)
Exchange differences on translation
of foreign operations
36,207 25,265 47,687 1,153 2,358 112,701
Others
(2,851) (8) (447) — 45 (3,261)
Balance as of December 31, 2022
1,980,679 1,049,264 983,204 346,542 41,136 4,400,842
010_0252087912303.indd 38010_0252087912303.indd 38 2023/04/12 20:09:392023/04/12 20:09:39

39
CORPORATE DATA
[Accumulated depreciation and accumulated impairment losses]
Millions of yen
Buildings and structures
Machinery, equipment and
vehicles
Tools, furniture and fixtures Land Construction in progress Total
Balance as of January 1, 2021
107,526 63,374 77,342 732 — 248,977
Depreciation
10,644 6,659 19,342 — — 36,646
Impairment losses
2,034 1,455 935 — — 4,425
Reversal of impairment losses
(466) — — — — (466)
Sale or disposal
(5,034) (2,563) (19,076) — — (26,673)
Reclassification to assets held for
sale
— — (889) — — (889)
Exchange differences on translation
of foreign operations
2,376 2,070 4,276 — — 8,723
Others
108 153 (204) — — 58
Balance as of December 31, 2021
117,189 71,151 81,726 732 — 270,800
Depreciation
10,085 7,498 18,757 — — 36,340
Impairment losses
4,272 7,886 875 — 265 13,299
Reversal of impairment losses
— — (19) — — (19)
Sale or disposal
(9,066) (5,926) (15,697) — (0) (30,691)
Reclassification to assets held for
sale
(19,665) (14,017) (2,893) — (265) (36,842)
Exchange differences on translation
of foreign operations
2,692 2,314 4,228 — — 9,235
Others
(31) (1) (46) — — (79)
Balance as of December 31, 2022
105,475 68,905 86,930 732 — 262,043
Thousands of
U.S. dollars
Buildings and structures
Machinery, equipment and
vehicles
Tools, furniture and fixtures Land Construction in progress Total
Balance as of December 31, 2021
888,603 539,513 619,700 5,551 — 2,053,382
Depreciation
76,471 56,855 142,228 — — 275,554
Impairment losses
32,393 59,797 6,635 — 2,009 100,842
Reversal of impairment losses
— — (144) — — (144)
Sale or disposal
(68,744) (44,935) (119,025) — (0) (232,719)
Reclassification to assets held for
sale
(149,113) (106,286) (21,937) — (2,009) (279,360)
Exchange differences on translation
of foreign operations
20,412 17,546 32,059 — — 70,026
Others
(235) (8) (349) — — (599)
Balance as of December 31, 2022
799,780 522,483 659,160 5,551 — 1,986,981
Note 1: Depreciation of property, plant and equipment is included in “Cost of sales” and “Selling, general and administrative expenses” in the consolidated statement of profit and loss.
Note 2: Impairment losses on property, plant and equipment are included in “Cost of sales” and “Selling, general and administrative expenses,” and reversals of impairment losses of the same are
included in “Other operating income” in the consolidated statement of profit and loss.
Note 3: Contractual commitments related to the purchase of property, plant and equipment are presented in “38. Commitments” of the Notes.
[Carrying amount]
Millions of yen
Buildings and structures
Machinery, equipment and
vehicles
Tools, furniture and fixtures Land Construction in progress Total
Balance as of January 1, 2021
149,406 55,538 52,619 44,605 27,308 329,478
Balance as of December 31, 2021
168,231 61,249 47,847 46,519 16,188 340,037
Balance as of December 31, 2022
155,736 69,472 42,735 44,970 5,425 318,339
Thousands of
U.S. dollars
Buildings and structures
Machinery, equipment and
vehicles
Tools, furniture and fixtures Land Construction in progress Total
Balance as of December 31, 2022
1,180,892 526,782 324,045 340,992 41,136 2,413,854
There were no material borrowing costs included in the cost of property, plant and equipment in the previous or current fiscal years.
010_0252087912303.indd 39010_0252087912303.indd 39 2023/04/12 20:09:392023/04/12 20:09:39
40
Shiseido | Integrated Report 2023
14.
Goodwill and Intangible Assets
(1) Schedule of changes
Changes in cost and accumulated amortization and accumulated impairment losses, and carrying amount of goodwill and intangible assets are as
follows:
[Cost]
Millions of yen
Goodwill
Intangible assets
Trademark rights Software Others Total
Balance as of January 1, 2021
54,429 174,354 83,187 7,585 265,127
Purchase
— 6 21,825 21 21,853
Acquisition through business combination
— — — — —
Sale or disposal
(11,579) (141,698) (12,033) (3,883) (157,615)
Reclassification to assets held for sale
— — — — —
Exchange differences on translation of foreign operations
7,579 10,030 2,720 440 13,191
Others
— — 632 — 632
Balance as of December 31, 2021
50,429 42,693 96,331 4,164 143,189
Purchase
— — 28,571 51 28,623
Acquisition through business combination
197 173 — 525 698
Sale or disposal
— — (9,820) (222) (10,042)
Reclassification to assets held for sale
— — (590) — (590)
Exchange differences on translation of foreign operations
7,252 5,917 2,392 275 8,584
Others
— — 869 (78) 790
Balance as of December 31, 2022
57,879 48,783 117,755 4,714 171,253
Thousands of
U.S. dollars
Goodwill
Intangible assets
Trademark rights Software Others Total
Balance as of December 31, 2021
382,386 323,726 730,444 31,574 1,085,752
Purchase
— — 216,644 387 217,038
Acquisition through business combination
1,494 1,312 — 3,981 5,293
Sale or disposal
— — (74,462) (1,683) (76,145)
Reclassification to assets held for sale
— — (4,474) — (4,474)
Exchange differences on translation of foreign operations
54,989 44,867 18,138 2,085 65,089
Others
— — 6,589 (591) 5,990
Balance as of December 31, 2022
438,876 369,904 892,895 35,745 1,298,552
010_0252087912303.indd 40010_0252087912303.indd 40 2023/04/12 20:09:392023/04/12 20:09:39

41
CORPORATE DATA
[Accumulated amortization and accumulated impairment losses]
Millions of yen
Goodwill
Intangible assets
Trademark rights Software Others Total
Balance as of January 1, 2021
— 30,981 34,115 2,276 67,373
Amortization
— 1,949 12,524 754 15,228
Impairment losses
11,579 24,593 3 419 25,016
Reversal of impairment losses
— — — — —
Sale or disposal
(11,579) (56,729) (10,724) (2,166) (69,620)
Reclassification to assets held for sale
— — — — —
Exchange differences on translation of foreign operations
— 1,264 1,689 154 3,108
Others
— — 267 — 267
Balance as of December 31, 2021
— 2,059 37,875 1,438 41,374
Amortization
— 660 13,353 641 14,655
Impairment losses
— — 182 — 182
Reversal of impairment losses
— — (0) — (0)
Sale or disposal
— — (9,095) (203) (9,298)
Reclassification to assets held for sale
— — (587) — (587)
Exchange differences on translation of foreign operations
— 116 1,225 121 1,463
Others
— — 321 (72) 248
Balance as of December 31, 2022
— 2,836 43,274 1,926 48,036
Thousands of
U.S. dollars
Goodwill
Intangible assets
Trademark rights Software Others Total
Balance as of December 31, 2021
— 15,613 287,193 10,904 313,725
Amortization
— 5,005 101,251 4,860 111,124
Impairment losses
— — 1,380 — 1,380
Reversal of impairment losses
— — (0) — (0)
Sale or disposal
— — (68,964) (1,539) (70,503)
Reclassification to assets held for sale
— — (4,451) — (4,451)
Exchange differences on translation of foreign operations
— 880 9,289 918 11,093
Others
— — 2,434 (546) 1,880
Balance as of December 31, 2022
— 21,504 328,132 14,604 364,240
Note 1: Amortization of intangible assets is included in “Cost of sales” and “Selling, general and administrative expenses” in the consolidated statement of profit and loss.
Note 2: Impairment losses on intangible assets are included in “Cost of sales” and “Selling, general and administrative expenses,” impairment losses on goodwill are included in “Other operating ex-
penses,” and reversals of impairment losses on intangible assets are included in “Other operating income” in the consolidated statement of profit and loss.
Note 3: There are no intangible assets pledged as collateral for liabilities.
Note 4: Contractual commitments related to the purchase of intangible assets are presented in “38. Commitments” of the Notes.
[
Carrying amount
]
Millions of yen
Goodwill
Intangible assets
Trademark rights Software Others Total
Balance as of January 1, 2021
54,429 143,373 49,071 5,308 197,753
Balance as of December 31, 2021
50,429 40,633 58,456 2,725 101,814
Balance as of December 31, 2022
57,879 45,947 74,480 2,788 123,217
Thousands of
U.S. dollars
Goodwill
Intangible assets
Trademark rights Software Others Total
Balance as of December 31, 2022
438,876 348,400 564,756 21,140 934,311
There were no material borrowing costs included in the cost of intangible assets in the previous or current fiscal years.
Expenditures for R&D activities recognized as expenses during the previous fiscal year and the current fiscal year were ¥25,814 million and
¥26,678 million ($202,290 thousand), respectively.
010_0252087912303.indd 41010_0252087912303.indd 41 2023/04/12 20:09:392023/04/12 20:09:39
42
Shiseido | Integrated Report 2023
(2) Significant goodwill and intangible assets
Significant goodwill and intangible assets, which were acquired through business combinations or licensing agreements, are as follows:
Millions of yen Thousands of U.S. dollars
Carrying amount
IFRS transition date
(January 1, 2021)
2021/12 2022/12 2022/12
Remaining amortization
period
Goodwill
Shiseido America (Note 1)
5,429 23,915 27,399 207,757 Unamortized
Drunk Elephant
(Americas Business) (Note 1)
25,190 — — — —
Drunk Elephant
(China Business)
4,703 5,255 6,020 45,648 Unamortized
Drunk Elephant
(EMEA Business)
5,172 5,778 6,620 50,197 Unamortized
Drunk Elephant
(Travel Retail Business)
5,701 6,368 7,296 55,323 Unamortized
Trademark rights
DOLCE & GABBANA
63,510 — — — —
bareMinerals
33,611 — — — —
Drunk Elephant (Note 2)
30,912 34,533 39,564 300,000 Unamortized
Note 1: In the previous fiscal year, the sales model for export from the United States was reviewed and the performance management, which was previously managed independently, was incorporat-
ed to Shiseido Americas Corporation. Reflecting this change, Drunk Elephant cash-generating unit, which was an independent unit within Americas Business, was incorporated to Shiseido
Americas cash-generating unit.
Note 2: The trademark right of Drunk Elephant is included in the Shiseido Americas cash-generating unit for impairment testing.
(3) Impairment test for goodwill and intangible assets with indefinite useful lives
The carrying amounts of major goodwill and intangible assets with indefinite useful lives that are allocated to each cash-generating unit are as pre-
sented in (2) Significant goodwill and intangible assets. The main intangible assets with indefinite useful lives are trademark rights of brands, etc.
They are not amortized as they are expected to remain as long as the business continues, and their useful lives are considered to be indefinite.
The carrying amounts of goodwill and intangible assets with indefinite useful lives that are individually immaterial as of the date of transition to IFRS,
December 31, 2021 and December 31, 2022 are ¥19,714 million, ¥11,621 million, and ¥13,595 million ($103,086 thousand), respectively.
The recoverable amounts of Drunk Elephant and the Shiseido America cash-generating unit are mainly determined at fair value less costs of dis-
posal, estimated primarily using discounted cash flows. Fair value less costs of disposal is determined by discounting the estimated cash flows based
on management-approved, five-year business plans to the present value using a discount rate based on the weighted average cost of capital. Busi-
ness plans reflect management assessments of future trends in the industry as well as past data, and are prepared based on both external and inter-
nal information, with factors including sales and profit margins based on sales expansion plans and the increased cost rates during the current fiscal
year, serving as the basis for calculation. For periods beyond the period covered by the business plan, the terminal value is calculated by discounting
the projected pre-tax cash flows to present value using a conservative growth rate determined by taking into account the conditions in the country
and industry to which the cash-generating unit or group of cash-generating units belong.
The key assumptions used in the calculation of the recoverable amount of each cash-generating unit or a group of cash-generating units to which
significant goodwill and intangible assets with indefinite useful lives are allocated are as follows. They are classified as level 3 of the fair value hierar-
chy in the fair value measurement.
IFRS transition date
(January 1, 2021)
2021/12 2022/12
Discount rate 8.8%~11.5% 8.3%~11.0% 10.8%~12.5%
Growth rate 1.5%~4.0% 1.5~4.0% 1.5~4.0%
A change in the key assumptions used in the impairment test could give rise to an impairment loss.
Impairment losses of ¥25,317 million were recognized in the Shiseido America cash-generating unit in the previous fiscal year. The recoverable
amounts of other cash-generating units or groups of cash-generating units are well above the carrying amounts of the cash-generating units or
groups of cash-generating units concerned, and even if the key assumptions used in the impairment test change within a reasonably foreseeable
range, it is considered unlikely that the recoverable amounts would be less than the carrying amounts.
The recoverable amounts of each cash-generating unit or a group of cash-generating units were well above their carrying amounts in the current
fiscal year, and even if the key assumptions used in the impairment test change within a reasonably foreseeable range, it is considered unlikely that
the recoverable amounts would be less than the carrying amounts.
The total amount of impairment losses is presented in “15. Impairment of Non-financial Assets.”
010_0252087912303.indd 42010_0252087912303.indd 42 2023/04/12 20:09:392023/04/12 20:09:39

43
CORPORATE DATA
15.
Impairment of Non-financial Assets
The Group has recorded impairment losses for the following asset groups.
In measuring impairment losses, the Group generally groups its assets based on the smallest units of asset groups that are identified as
generating largely independent cash inflows. Among the assets for business use, store assets are grouped by store.
For the fiscal year 2021
The Company’s subsidiary Beauté Prestige International S.A.S. had concluded a global license agreement with Dolce&Gabbana S.r.l., but during the
previous fiscal year, the two companies agreed to terminate the agreement. Following the termination of this agreement, the carrying amount (net of
related liabilities) of the assets has been reduced to the recoverable amount as the profitability of the trademark rights, which are the principal assets
for business use, declined and recovery of investment was no longer expected. The recoverable amount is measured at value in use, and value in
use net of related liabilities is assessed at zero. The impairment losses recognized is included in “Selling, general and administrative expenses” in
the consolidated statement of profit and loss.
Furthermore, in line with the conclusion of an agreement to transfer the assets related to three prestige makeup brands (bareMinerals, BUXOM,
and Laura Mercier), the carrying amount of the asset group related to this business has been reduced to the recoverable amount. The recoverable
amount is measured at fair value less costs of disposal, which is classified as level 3 of the fair value hierarchy. The impairment losses recognized
are included in “Selling, general and administrative expenses” and “Other operating expenses” in the consolidated statement of profit and loss.
In addition, following the decision to discontinue the production of hyaluronic acid, the carrying amount of the asset group related to this business
at the Company’s factory has been reduced to the recoverable amount. The recoverable amount is measured at value in use, and is assessed at
zero. The impairment losses recognized are included in “Cost of sales” in the consolidated statement of profit and loss.
Among the domestic subsidiaries, the carrying amount of the assets groups of stores whose profitability has declined, have been reduced to the
recoverable amount. The recoverable amount is measured at value in use, which is calculated by using a discount rate of 6.2%. The impairment
losses recognized are included in “Selling, general and administrative expenses” in the consolidated statement of profit and loss.
Reportable segment Location Use Type Millions of yen
EMEA
Business
Paris, France
Madrid, Spain
Assets for business use
Trademark rights 15,582
Others 18
Total 15,600
Americas
Business
Delaware, United States Assets for business use
Buildings and structures 112
Tools, furniture and fixtures 862
Goodwill 11,579
Trademark rights 9,011
Other intangible assets 419
Right-of-use assets 3,332
Total 25,317
Other
Kakegawa-shi, Shizuoka
Pref., Japan
Assets for business use
Buildings and structures 1,829
Machinery, equipment and vehicles 1,445
Others 51
Total 3,326
Tokyo, Japan Assets for business use
Buildings and structures 92
Others 16
Total 109
Japan Business
(Note)
Tokyo, Japan Assets for business use Right-of-use assets 118
44,472
Note: The Group has revised its reportable segment classifications from the fiscal year ended December 31, 2022. Accordingly, the Others segment has been changed to the Japan Business.
010_0252087912303.indd 43010_0252087912303.indd 43 2023/04/12 20:09:392023/04/12 20:09:39
44
Shiseido | Integrated Report 2023
For the fiscal year 2022
As a result of a decline in the profitability of offices subleased by Shiseido Americas Corporation, their carrying amount has been reduced to the
recoverable amount. Value in use is used as the recoverable amount. The impairment losses recognized are included in “Selling, general and
administrative expenses” in the consolidated statement of profit and loss.
Furthermore, among the domestic subsidiaries, the carrying amount of the assets groups of stores whose profitability has declined, have been
reduced to the recoverable amount. The recoverable amount is measured at value in use, which is calculated by using a discount rate of 6.9%, and
for some stores the value in use is assessed at zero. The impairment losses recognized are included in “Selling, general and administrative
expenses” in the consolidated statement of profit and loss.
Impairment losses are also recognized for assets held for sale in line with the conclusion of an agreement to transfer the production business of
personal care products conducted at Shiseido Kuki Factory and Shiseido Vietnam Factory. Non-current assets classified as held for sale are
measured at the lower of the carrying amount or fair value less costs to sell, and they are classified as level 3 of the fair value hierarchy. The
impairment losses recognized are included in “Cost of sales” and “Selling, general and administrative expenses” in the consolidated statement of
profit and loss.
Millions of yen Thousands of U.S. dollars
Reportable segment Location Use Type Amount
Americas Business New York, United States Assets for business use Right-of-use assets 2,809 21,300
Other Tokyo, Japan, etc. Assets for business use
Buildings and structures 50 379
Right-of-use assets 123 933
Others 8 61
Total 182 1,380
Other
Kuki-shi, Saitama Pref.,
Japan
Assets for business use
Buildings and structures 3,087 23,408
Machinery, equipment and
vehicles
6,764 51,289
Others 819 6,210
Total 10,671 80,914
Other
Dong Nai Province,
Vietnam
Assets for business use
Buildings and structures 1,134 8,599
Machinery, equipment and
vehicles
1,117 8,470
Others 675 5,118
Total 2,927 22,194
16,592 125,811
010_0252087912303.indd 44010_0252087912303.indd 44 2023/04/12 20:09:392023/04/12 20:09:39

45
CORPORATE DATA
16.
Investments Accounted for Using Equity Method
(1) Significant associates
A significant associate for the Group is FineToday Holdings Co., Ltd. (located in Chiyoda-ku, Tokyo), which is mainly engaged in the Personal Care
Business. The Company acquired 35% stake in FineToday Holdings Co., Ltd. in July 2021.
As a result of the conclusion of an agreement to transfer the production business of personal care products conducted at Shiseido Kuki Factory
and Shiseido Vietnam Factory during the current fiscal year, the application of the equity method has been discontinued for the portion of the shares
scheduled to be transferred in the fiscal year 2023.
The reconciliation table for the condensed consolidated financial information of FineToday Holdings Co., Ltd. and the carrying amount of the
Group’s share in said company is as follows:
Millions of yen Thousands of U.S. dollars
2021/12 2022/12 2022/12
Current assets 56,405 65,711 498,264
Non-current assets 131,770 136,969 1,038,588
Current liabilities 25,264 27,107 205,543
Non-current liabilities 107,823 112,908 856,142
Total equity 55,088 62,664 475,159
Group’s share of total equity 19,280 21,932 166,303
Amount equivalent to goodwill and consolidation adjustment (Note) 0 (9,044) (68,577)
Carrying amount of investments 19,281 12,888 97,725
Note: As a result of the conclusion of an agreement to transfer the production business of personal care products conducted at Shiseido Kuki Factory and Shiseido Vietnam Factory during the current
fiscal year, the portion of the shares scheduled to be transferred in the fiscal year 2023 has been classified as assets held for sale. For details, refer to “12. Non-current Assets Held for Sale and
Disposal Groups” of the Notes.
Millions of yen Thousands of U.S. dollars
2021/12 2022/12 2022/12
Net sales 54,729 108,321 821,360
Profit (5,813) 5,899 44,730
Other comprehensive income 1,472 1,683 12,762
Comprehensive income (4,340) 7,583 57,499
Group’s share
Profit (2,034) 2,180 16,530
Other comprehensive income 515 890 6,749
Comprehensive income (1,519) 3,071 23,286
In addition to the above, impairment losses of ¥966 million ($7,325 thousand) were recognized on investments accounted for using the equity meth-
od in FineToday Holdings Co., Ltd. in the current fiscal year, and these amounts were included in “Share of profit (loss) of investment accounted for
using equity method” in the consolidated statement of profit and loss.
No dividends were received from FineToday Holdings Co., Ltd. in the previous or current fiscal years.
(2) Immaterial associates
The carrying amounts of investments in associates that are individually immaterial for the Group are as follows:
Millions of yen Thousands of U.S. dollars
IFRS transition date
(January 1, 2021)
2021/12 2022/12 2022/12
Total carrying amount
2,224 2,410 2,647 20,071
The Group’s share of profit, other comprehensive income, and comprehensive income of associates that are individually immaterial are as follows:
Millions of yen Thousands of U.S. dollars
2021/12 2022/12 2022/12
Profit 325 392 2,972
Other comprehensive income (0) 7 53
Comprehensive income 325 399 3,025
010_0252087912303.indd 45010_0252087912303.indd 45 2023/04/12 20:09:392023/04/12 20:09:39
46
Shiseido | Integrated Report 2023
17.
Income Taxes
(1) Deferred tax assets and deferred tax liabilities
Major components of and changes in deferred tax assets and deferred tax liabilities are as follows:
For the fiscal year 2021
Millions of yen
2021/1/1
Amount recognized
through profit or loss
Amount recognized
through other
comprehensive income
Others 2021/12/31
Deferred tax assets
Inventories
22,411 (2,554) — 833 20,689
Property, plant and equipment and
intangible assets
4,426 (308) — 59 4,178
Other current liabilities
14,998 10,486 — 1,026 26,511
Lease liabilities
29,245 (6,378) — 40 22,906
Retirement benefit liability
15,587 (236) (2,441) 34 12,943
Tax losses carried forward
10,295 (1,831) — 763 9,227
Others
18,499 (2,237) (44) 355 16,573
Total
115,463 (3,061) (2,485) 3,113 113,029
Deferred tax liabilities
Property, plant and equipment and
intangible assets
18,996 (10,233) — 742 9,505
Right-of-use assets
33,144 (3,819) — 815 30,140
Retained earnings of subsidiaries
and associates
3,448 (133) — 20 3,336
Other financial assets
2,372 (604) 56 7 1,832
Others
1,023 1,213 — 149 2,386
Total
58,986 (13,576) 56 1,735 47,201
For the fiscal year 2022
Millions of yen
2022/1/1
Amount recognized
through profit or loss
Amount recognized
through other
comprehensive income
Others 2022/12/31
Deferred tax assets
Inventories
20,689 (4,702) — 802 16,789
Property, plant and equipment and
intangible assets
4,178 1,787 — 30 5,995
Other current liabilities
26,511 (6,705) — 534 20,339
Lease liabilities
22,906 (2,827) — 108 20,188
Retirement benefit liability
12,943 (251) (5,357) 87 7,421
Tax losses carried forward
9,227 7,427 — 962 17,617
Others
16,573 737 (43) 94 17,361
Total
113,029 (4,535) (5,401) 2,620 105,713
Deferred tax liabilities
Property, plant and equipment and
intangible assets
9,505 813 — 935 11,253
Right-of-use assets
30,140 (4,626) — 1,211 26,726
Retained earnings of subsidiaries
and associates
3,336 (126) — 42 3,251
Other financial assets
1,832 (200) (223) 11 1,420
Others
2,386 (595) — 62 1,854
Total
47,201 (4,735) (223) 2,262 44,505
010_0252087912303.indd 46010_0252087912303.indd 46 2023/04/12 20:09:402023/04/12 20:09:40

47
CORPORATE DATA
Thousands of U.S. dollars
2022/1/1
Amount recognized
through profit or loss
Amount recognized
through other
comprehensive income
Others 2022/12/31
Deferred tax assets
Inventories
156,877 (35,654) — 6,081 127,305
Property, plant and equipment and
intangible assets
31,680 13,550 — 227 45,458
Other current liabilities
201,024 (50,842) — 4,049 154,224
Lease liabilities
173,688 (21,436) — 819 153,079
Retirement benefit liability
98,142 (1,903) (40,620) 660 56,271
Tax losses carried forward
69,965 56,316 — 7,295 133,584
Others
125,667 5,588 (326) 713 131,642
Total
857,059 (34,387) (40,954) 19,867 801,585
Deferred tax liabilities
Property, plant and equipment and
intangible assets
72,073 6,165 — 7,090 85,328
Right-of-use assets
228,541 (35,077) — 9,183 202,654
Undistributed earnings of
associates
25,296 (955) — 318 24,651
Other financial assets
13,891 (1,517) (1,691) 83 10,767
Others
18,092 (4,512) — 470 14,058
Total
357,909 (35,904) (1,691) 17,152 337,466
Deductible temporary differences, tax losses carried forward, and tax credits carried forward for which deferred tax assets are not recognized are as
follows. The amounts are shown on a tax basis.
Millions of yen Thousands of U.S. dollars
IFRS transition date
(January 1, 2021)
2021/12 2022/12 2022/12
Deductible temporary difference
15,443 25,526 31,025 235,252
Tax losses carried forward
7,231 18,111 17,494 132,651
Tax credits carried forward
1,312 1,837 2,514 19,063
Total
23,987 45,474 51,034 386,973
Tax losses carried forward and tax credits carried forward for which deferred tax assets are not recognized will expire as follows. The amounts are
shown on a tax basis.
Millions of yen Thousands of U.S. dollars
IFRS transition date
(January 1, 2021)
2021/12 2022/12 2022/12
Tax losses carried forward
1st year
38 1 284 2,153
2nd year
43 19 — —
3rd year
— 9 — —
4th year
— — 2 15
5th year and beyond
7,149 18,080 17,207 130,475
Total
7,231 18,111 17,494 132,651
010_0252087912303.indd 47010_0252087912303.indd 47 2023/04/12 20:09:402023/04/12 20:09:40
48
Shiseido | Integrated Report 2023
Millions of yen Thousands of U.S. dollars
IFRS transition date
(January 1, 2021)
2021/12 2022/12 2022/12
Tax credits carried forward
1st year — — 295 2,237
2nd year — — — —
3rd year — — 446 3,382
4th year — — — —
5th year and beyond 1,312 1,837 1,772 13,436
Total 1,312 1,837 2,514 19,063
The total amount of taxable temporary differences related to investments in subsidiaries, etc. for which deferred tax liabilities were not recognized on
the date of transition to IFRS, December 31, 2021, and December 31, 2022 were ¥86,308 million, ¥85,512 million, and ¥87,805 million ($665,795
thousand), respectively. The Group does not recognize them as deferred tax liabilities because the Group is able to control the timing of the reversal
of the temporary differences and it is probable that these temporary differences will not reverse in the foreseeable future.
(2) Income tax expense
The breakdown of income tax expense is as follows:
Millions of yen Thousands of U.S. dollars
2021/12 2022/12 2022/12
Current tax expense 60,176 13,045 98,916
Deferred tax expense (10,515) (199) (1,509)
Total 49,661 12,845 97,399
Current tax expense includes prior tax expenses of ¥(1,165) million for 2021/12.
Factors behind the differences in the statutory effective tax rate and the average actual tax rate are as follows.
Income taxes applicable to the Group consist mainly of corporation tax, inhabitants’ tax, and enterprise tax. The statutory effective tax rate calcu-
lated based on the foregoing was 31.0% for both the previous and current fiscal years. However, overseas subsidiaries are subject to the income tax-
es of the jurisdictions in which they are located.
%
2021/12 2022/12
Statutory effective tax rate 31.0 31.0
Permanently non-deductible expenses (e.g., entertainment expenses) 1.6 12.5
Permanently non-taxable income (e.g., dividend income) 0.3 (11.1)
Tax credits (2.8) (2.1)
Differences in effective tax rates (5.6) (12.1)
Effect of assessment of recoverability of deferred tax assets 21.7 6.5
Impact of business transfer 2.8 —
Withholding tax on dividends, etc. from overseas subsidiaries — 3.6
Others 1.3 (2.8)
Average actual tax rate 50.1 25.5
010_0252087912303.indd 48010_0252087912303.indd 48 2023/04/12 20:09:402023/04/12 20:09:40

49
CORPORATE DATA
18.
Trade and Other Payables
The breakdown of trade and other payables is as follows:
Millions of yen Thousands of U.S. dollars
IFRS transition date
(January 1, 2021)
2021/12 2022/12 2022/12
Notes and accounts payable
21,187 28,021 28,530 216,333
Electronically recorded obligations - operating
55,740 40,584 38,910 295,041
Other payables
78,433 100,145 96,938 735,047
Refund liabilities
30,259 34,780 39,341 298,309
Others
276 187 49 372
Total
185,896 203,718 203,770 1,545,117
Trade and other payables are classified as financial liabilities measured at amortized cost.
(1) Breakdown of bonds and borrowings
The breakdown of bonds and borrowings is as follows:
Millions of yen Thousands of U.S. dollars %
IFRS transition date
(January 1, 2021)
2021/12 2022/12 2022/12
Average interest
rate
Repayment due
Current liabilities
Short-term borrowings 56,491 — 75 569 0.00 —
Current portion of long-term borrowings 10,730 730 15,915 120,678 0.43 —
Current portion of bonds payable — 15,000 10,000 75,827 — —
Total 67,221 15,730 25,990 197,073
Non-current liabilities
Long-term borrowings 167,861 95,915 80,000 606,612 0.10 2024–2027
Bonds 65,000 50,000 60,000 454,959 0.22 2025–2027
Total 232,861 145,915 140,000 1,061,571
Notes: 1. Average interest rates are the weighted average interest rates for balances at the end of the current fiscal year.
2. Fixed interest rates after executing the interest rate swaps are applied to borrowings for which hedge accounting is applied using interest rate swaps.
3. Bonds and borrowings are classified as financial liabilities measured at amortized cost.
19.
Bonds and Borrowings
010_0252087912303.indd 49010_0252087912303.indd 49 2023/04/12 20:09:402023/04/12 20:09:40
50
Shiseido | Integrated Report 2023
A summary of the terms of bond issuance is as follows:
Millions of yen
Thousands of
U.S. dollars
Company name Issue Issue date
IFRS
transition date
(January
1, 2021)
2021/12 2022/12 2022/12 Interest rate Collateral
Redemption
date
Shiseido
Company,
Limited
8th
Unsecured
straight bonds
June 17,
2015
15,000 15,000 — —
0.374 None
June 17,
2022
(—) (15,000) (—) (—)
Shiseido
Company,
Limited
10th
Unsecured
straight bonds
February
26, 2020
20,000 20,000 20,000 151,653
0.080 None
February
26, 2025
(—) (—) (—) (—)
Shiseido
Company,
Limited
11th
Unsecured
straight bonds
December
17, 2020
10,000 10,000 10,000 75,827
0.040 None
December
15, 2023
(—) (—) (10,000) (75,827)
Shiseido
Company,
Limited
12th
Unsecured
straight bonds
December
17, 2020
20,000 20,000 20,000 151,653
0.120 None
December
17, 2025
(—) (—) (—) (—)
Shiseido
Company,
Limited
13th
Unsecured
straight bonds
December
8, 2022
— — 20,000 151,653
0.450 None
December
8, 2027
(—) (—) (—) (—)
Total
65,000 65,000 70,000 530,786
(—) (15,000) (10,000) (75,827)
Note: Figures in parentheses represent the current portion.
(2) Assets pledged as collateral
Assets pledged as collateral are as follows:
Millions of yen Thousands of U.S. dollars
IFRS transition date
(January 1, 2021)
2021/12 2022/12 2022/12
Cash and cash equivalents
1,834 1,736 1,830 13,876
Property, plant and equipment
11,725 11,548 11,158 84,607
Other financial assets (non-current)
16,355 16,355 16,355 124,014
Total
29,915 29,640 29,345 222,513
The corresponding debts are as follows:
Millions of yen Thousands of U.S. dollars
IFRS transition date
(January 1, 2021)
2021/12 2022/12 2022/12
Current portion of long-term borrowings
730 730 15,915 120,678
Long-term borrowings
16,645 15,915 — —
Total
17,375 16,645 15,915 120,678
010_0252087912303.indd 50010_0252087912303.indd 50 2023/04/12 20:09:402023/04/12 20:09:40

51
CORPORATE DATA
20.
Other Financial Liabilities
The breakdown of other financial liabilities is as follows:
Millions of yen Thousands of U.S. dollars
IFRS transition date
(January 1, 2021)
2021/12 2022/12 2022/12
Other financial liabilities (current)
Financial liabilities measured at amortized cost
Deposits received 4,410 3,397 3,427 25,986
Others 499 1,016 1,227 9,304
Financial liabilities measured at fair value through profit
or loss
Derivative liabilities 16 501 88 667
Total 4,926 4,914 4,744 35,972
Other financial liabilities (non-current)
Financial liabilities measured at amortized cost
Long-term other payables 52,877 4,671 4,139 31,385
Others 474 422 461 3,496
Financial liabilities measured at fair value through profit
or loss
Derivative liabilities 344 201 — —
Others 350 350 350 2,654
Total 54,046 5,646 4,950 37,534
21.
Leases
(1) As lessee
The Group mainly leases land for office buildings, retail stores, etc., real estate such as buildings, and tools, furniture and fixtures such as molds and
dies, using lease arrangements.
(i) Breakdown of Right-of-use assets
The breakdown of Right-of-use assets is as follows:
Millions of yen Thousands of U.S. dollars
IFRS transition date
(January 1, 2021)
2021/12 2022/12 2022/12
Right-of-use assets for which buildings and structures are
the underlying assets
92,544 85,574 75,227 570,420
Right-of-use assets for which machinery, equipment and
vehicles are the underlying assets
8,636 12,274 10,798 81,877
Right-of-use assets for which tools, furniture and fixtures
are the underlying assets
4,516 4,953 3,886 29,466
Right-of-use assets for which land is the underlying asset 25,515 24,671 24,128 182,954
Others 451 358 234 1,774
Total 131,665 127,832 114,276 866,515
Increases in right-of-use assets in the previous fiscal year and the current fiscal year were ¥24,087 million and ¥12,638 million ($95,830 thou-
sand), respectively.
(ii) Lease liabilities
Information on maturity analysis of lease liabilities is presented in “35. Financial Instruments (2) Financial risk management ii. Liquidity risk
management” of the Notes.
(iii) Profit/loss and cash outflows associated with right-of-use assets
Profit/loss associated with right-of-use assets is as follows:
010_0252087912303.indd 51010_0252087912303.indd 51 2023/04/12 20:09:402023/04/12 20:09:40
52
Shiseido | Integrated Report 2023
Millions of yen Thousands of U.S. dollars
2021/12 2022/12 2022/12
Depreciation of right-of-use assets
Right-of-use assets for which buildings and structures are the underlying
assets
19,468 19,603 148,643
Right-of-use assets for which machinery, equipment and vehicles are the
underlying assets
1,265 1,422 10,783
Right-of-use assets for which tools, furniture and fixtures are the underlying
assets
2,192 2,397 18,176
Right-of-use assets for which land is the underlying asset 1,035 1,139 8,637
Others 133 124 940
Total depreciation 24,095 24,687 187,193
Interest expenses on lease liabilities 1,663 1,703 12,913
Lease expenses subject to exemptions for short-term leases 2,942 2,818 21,368
Lease expenses subject to exemptions for leases of low-value assets 1,717 2,291 17,372
Variable lease payments not included in measurement of lease liabilities 1,902 1,567 11,882
Revenue from sublease of right-of-use assets (483) (1,137) (8,621)
Depreciation of right-of-use assets, short-term lease expenses, lease expenses of low-value assets, and variable lease payments are included in
“Cost of sales” and “Selling, general and administrative expenses,” and interest expenses on lease liabilities are included in “Finance costs” in
the consolidated statement of profit and loss.
Cash outflows associated with leases are as follows:
Millions of yen Thousands of U.S. dollars
2021/12 2022/12 2022/12
Cash outflows associated with leases 33,029 38,085 288,785
(2) As lessor
The Group mainly leases buildings, land, etc.
22.
Employee Benefits
The Company and its consolidated subsidiaries in Japan adopt the corporate pension fund plan as a defined benefit plan and the defined contribu-
tion pension plan or the retirement benefit advance payment plan as a defined contribution plan. In some cases, premium severance pay, etc.,
which are treated as retirement benefit expenses at the time of payment, may be paid to employees at the time of their retirement. In addition, some
overseas consolidated subsidiaries adopt the defined benefit corporate pension plan, lump-sum retirement payment plan, and defined contribution
plan. Defined benefit plans are typically exposed to general investment risks, interest rate risks, inflation risks and other actuarial risks.
Funded defined benefit plans are managed by pension funds that are legally separate from the Group. These plans are required by law to meet
the minimum funding requirement, and if they are underfunded, additional contributions must be made within a specified time frame.
These pension funds are responsible for managing plan assets in accordance with a policy specified by the Company.
(1) Defined benefit plans
(i) Reconciliation of defined benefit obligations and plan assets
The relationships between defined benefit obligations and plan assets, and net defined benefit liability (asset) recognized in the consolidated
statement of financial position are as follows:
010_0252087912303.indd 52010_0252087912303.indd 52 2023/04/12 20:09:402023/04/12 20:09:40

53
CORPORATE DATA
Millions of yen Thousands of U.S. dollars
IFRS transition date
(January 1, 2021)
2021/12 2022/12 2022/12
Present value of funded defined benefit obligations 276,289 275,953 238,770 1,810,510
Fair value of plan assets (228,269) (235,485) (214,308) (1,625,023)
Subtotal 48,020 40,468 24,462 185,487
Present value of unfunded defined benefit obligations 1,882 1,691 883 6,695
Net defined benefit liability (asset) 49,902 42,159 25,346 192,190
Amount recognized in the consolidated statement of
financial position
Retirement benefit liability 49,902 42,159 25,346 192,190
Retirement benefit asset
(Other non-current assets)
— — — —
Net defined benefit liability (asset)
recognized in the consolidated statement of financial
position
49,902 42,159 25,346 192,190
(ii) Reconciliation of present value of defined benefit obligations
Changes in the present value of defined benefit obligations are as follows:
Millions of yen Thousands of U.S. dollars
2021/12 2022/12 2022/12
Beginning balance of present value of defined benefit obligations
Service costs 278,171 277,644 2,105,278
Interest costs 7,083 7,203 54,618
Remeasurements 1,894 1,963 14,885
Actuarial differences arising from changes in demographic assumptions (90) (713) (5,406)
Actuarial differences arising from changes in financial assumptions (606) (33,764) (256,021)
Actuarial differences arising from experience adjustments 3,738 (35) (265)
Retirement benefits paid (10,575) (11,950) (90,613)
Effects of business combinations and disposals (2,396) (928) (7,037)
Others 425 235 1,782
Ending balance of present value of defined benefit obligations 277,644 239,654 1,817,213
For the benefit plans of the Company and its major subsidiaries in Japan, which account for a significant portion of the Group’s defined benefit
obligations, the weighted average duration of the defined benefit obligations on the date of transition to IFRS, December 31, 2021, and
December 31, 2022 were 16.4 years, 15.9 years, and 14.3 years, respectively.
(iii) Reconciliation of fair value of plan assets
Changes in the fair value of plan assets are as follows:
Millions of yen Thousands of U.S. dollars
2021/12 2022/12 2022/12
Beginning balance of fair value of plan assets 228,269 235,485 1,785,601
Interest income 1,601 1,687 12,792
Remeasurements
Return on plan assets 10,444 (18,020) (136,639)
Contribution from employers 6,883 6,671 50,584
Retirement benefits paid (10,017) (11,403) (86,465)
Effects of business combinations and disposals (1,852) (118) (895)
Others 157 7 53
Ending balance of fair value of plan assets 235,485 214,308 1,625,023
The Group plans to contribute ¥6,290 million ($47,695 thousand) in the following fiscal year.
010_0252087912303.indd 53010_0252087912303.indd 53 2023/04/12 20:09:402023/04/12 20:09:40
54
Shiseido | Integrated Report 2023
(iv) Components of plan assets
Major components of plan assets are as follows:
Millions of yen Thousands of U.S. dollars
IFRS transition date
(January 1, 2021)
2021/12 2022/12 2022/12
Publicly quoted market price in active
markets
Publicly quoted market price in active
markets
Publicly quoted market price in
active markets
Publicly quoted market price in
active markets
Yes No Total Yes No Total Yes No Total Yes No Total
Cash and cash equivalents
8,419 — 8,419 10,863 — 10,863 10,659 — 10,659 80,823 — 80,823
Commingled investment fund
Equity instruments
— 45,539 45,539 — 41,821 41,821 — 35,732 35,732 — 270,943 270,943
Debt instruments
— 126,220 126,220 — 115,643 115,643 — 93,283 93,283 — 707,332 707,332
Alternative investments
— 41,941 41,941 — 60,743 60,743 — 68,122 68,122 — 516,545 516,545
General account of life
insurance companies
— 6,148 6,148 — 6,412 6,412 — 6,510 6,510 — 49,363 49,363
Total
8,419 219,850 228,269 10,863 224,621 235,485 10,659 203,648 214,308 80,823 1,544,192 1,625,023
Note: The commingled investment fund for equity instruments has invested approximately 10% of its funds in domestic shares and approximately 90% in foreign shares at the date of transition to
IFRS, in the previous fiscal year and the current fiscal year.
The commingled investment fund for debt instruments has invested approximately 20% of its funds in domestic bonds and approximately 80% in foreign bonds at the date of transition to
IFRS, and approximately 10% in domestic bonds and approximately 90% in foreign bonds in the previous fiscal year and the current fiscal year.
Alternative investments include hedge funds, etc.
The Group’s policy for managing plan assets is based on internal rules, and is aimed at generating stable returns over the medium to long
term to ensure the future payment of retirement benefit obligations. Specifically, a target rate of return and the asset composition ratios for
each asset type are determined within the scope of risk tolerance specified each year, and investments are made while maintaining these
ratios. Furthermore, the asset composition ratios are revised as necessary.
(v) Principal actuarial assumptions
The principal assumptions used in the actuarial calculations for the benefit plans of the Company and its major subsidiaries in Japan, which
account for a significant portion of the Group’s defined benefit obligations, are as follows:
IFRS transition date
(January 1, 2021)
FY2021 FY2022
Discount rate 0.7 0.7 1.5
The mortality is determined based on publicly-available life tables, mortality rates, etc. that are typically used in making actuarial assumptions.
(vi) Sensitivity analysis
Concerning the benefit plans of the Company and its main domestic subsidiaries, which account for a significant portion of the Group’s
defined benefit obligations, the impact of a 0.5 percentage point change in the discount rate used in the actuarial calculations on the present
value of defined benefit obligations is as follows. This analysis assumes that all other variables remain constant, but changes in other
assumptions could affect the sensitivity analysis.
Millions of yen Thousands of U.S. dollars
FY2021 FY2022 FY2022
0.5 percentage point increase in discount rate (19,341) (14,677) (111,291)
0.5 percentage point decrease in discount rate 19,694 16,316 123,719
(2) Defined contribution plans
The amounts of expenses recognized for defined contribution plans for the previous fiscal year and the current fiscal year were ¥4,610 million and
¥4,992 million ($37,853 thousand), respectively.
010_0252087912303.indd 54010_0252087912303.indd 54 2023/04/12 20:09:402023/04/12 20:09:40

55
CORPORATE DATA
23.
Provisions
The breakdown of and changes in provisions are as follows:
Millions of yen
Asset retirement obligations Provision for restructuring costs Other provisions Total
January 1, 2022
2,217 8,524 1,855 12,596
Increase during the period
104 2,301 3,057 5,464
Interest expenses for discount
calculation during the period
8 — — 8
Decrease during the period (intended use)
(483) (5,041) (287) (5,813)
Decrease during the period (reversal)
(117) (2,900) (38) (3,056)
Exchange differences on translation of foreign operations
30 599 81 711
Others (Note)
(437) — (8) (445)
December 31, 2022
1,321 3,483 4,660 9,464
Thousands of U.S. dollars
Asset retirement obligations Provision for restructuring costs Other provisions Total
January 1, 2022
16,811 64,635 14,066 95,511
Increase during the period
789 17,448 23,180 41,432
Interest expenses for discount
calculation during the period
61 — — 61
Decrease during the period (intended use)
(3,662) (38,224) (2,176) (44,078)
Decrease during the period (reversal)
(887) (21,990) (288) (23,173)
Exchange differences on translation of foreign operations
227 4,542 614 5,391
Others (Note)
(3,314) — (61) (3,374)
December 31, 2022
10,017 26,410 35,335 71,762
Note: Others refer to the transfer to liabilities directly related to assets held for sale.
The breakdown of provisions in the consolidated statement of financial position is as follows:
Millions of yen Thousands of U.S. dollars
IFRS transition date
(January 1, 2021)
2021/12 2022/12 2022/12
Current liabilities 2,773 10,843 8,136 61,692
Non-current liabilities 1,679 1,753 1,328 10,070
Total 4,453 12,596 9,464 71,762
Asset retirement obligations comprise the amounts expected to be paid in the future to fulfill the obligations to restore offices and buildings leased by
the Group to their original condition, based on past restoration experience. These expenses are expected to be paid after the lapse of the expected
period of use, which is determined by taking into account the useful life of the internal structures in the offices, etc., but will be affected by future
business plans and other factors.
Provision for restructuring costs mainly comprise amounts of premium severance pay, etc. that are expected to be paid in the future in line with
business portfolio restructuring and other structural reforms. The timing of the payment of these expenses will be affected by future business plans
and other factors.
Other provisions include provisions for losses arising from expenses related to litigation risk, product liability risk, etc. and provisions for losses as-
sociated with the discontinuation of brands and the withdrawal from businesses. The timing of the payment of these expenses will be affected by fu-
ture business plans and other factors.
010_0252087912303.indd 55010_0252087912303.indd 55 2023/04/12 20:09:402023/04/12 20:09:40
56
Shiseido | Integrated Report 2023
24.
Other Liabilities
25.
Equity and Other Equity Items
The breakdown of other liabilities (current) is as follows:
Millions of yen Thousands of U.S. dollars
IFRS transition date
(January 1, 2021)
2021/12 2022/12 2022/12
Accrued expenses 38,131 37,322 52,486 397,983
Accrued consumption taxes 17,220 15,641 9,387 71,178
Accrued bonuses 15,189 29,726 31,963 242,364
Accrued paid absences 11,720 11,925 12,033 91,242
Contract liabilities 6,739 8,038 6,942 52,639
Others 1,415 4,816 3,367 25,531
Total 90,417 107,470 116,180 880,952
(1) Number of shares authorized and total number of shares issued
Changes in the number of shares authorized and total number of shares issued are as follows:
Shares
2021/12 2022/12
Number of shares authorized
Ordinary shares 1,200,000,000 1,200,000,000
Total number of shares issued
Beginning balance 400,000,000 400,000,000
Change during the period — —
Ending balance 400,000,000 400,000,000
Note: All the shares issued by the Company are non-par-value ordinary shares that have no restrictions on any rights, and the shares issued are fully paid in.
(2) Treasury shares
Changes in the number of treasury shares are as follows:
Shares
2021/12 2022/12
Beginning balance 534,198 506,767
Change during the period (27,431) (54,315)
Ending balance 506,767 452,452
Note: The main factors behind the changes during the period are the exercise of stock options, disposal under the performance-linked stock compensation plan as a
long-term incentive compensation, buyback or additional purchase request of shares of less than one unit.
(3) Capital surplus
The Companies Act of Japan (the “Companies Act”) provides that at least half of the amount paid in or delivered at share issue shall be credited to
share capital and the remainder may be credited to additional paid-in capital included in capital surplus. The Companies Act also provides that legal
capital surplus may be credited to share capital subject to a resolution of the general meeting of shareholders.
Furthermore, the Company operates a stock option plan and a performance share unit plan, and the portion accounted for as equity-settled
stock-based payment is recognized as capital surplus. Contract terms, amounts, etc. are presented in “34. Stock-based Compensation” of the
Notes.
010_0252087912303.indd 56010_0252087912303.indd 56 2023/04/12 20:09:402023/04/12 20:09:40

57
CORPORATE DATA
(4) Other components of equity
(i) Exchange differences on translation of foreign operations
Exchange differences arising from the translation of financial statements of foreign operations prepared in foreign currencies.
(ii) Financial assets measured at fair value through other comprehensive income
Valuation differences of the fair value of financial assets measured at fair value through other comprehensive income.
(iii) Cash flow hedges
Cumulative total amount of the effective portion of the hedges, out of the gains or losses arising from changes in the fair value of hedging in-
struments used for cash flow hedges.
(iv) Remeasurements of defined benefit plans
The impact of differences between actuarial assumptions at the beginning of the term and actual results, and the impact of changes in actu-
arial assumptions.
(5) Retained earnings
The Companies Act stipulates that an amount equal to one-tenth of the amount paid as dividends of surplus shall be reserved as legal capital sur-
plus or legal retained earnings until the total amount of legal capital surplus and legal retained earnings reaches one-fourth of share capital. Legal re-
tained earnings reserved may be used to cover deficits. Legal retained earnings may also be reversed subject to a resolution of the general meeting
of shareholders.
26.
Dividends
The amounts of dividends paid are as follows:
For the fiscal year 2021
1. Dividends paid
Resolution date Type of shares Total amount of dividends
(Millions of yen)
Dividend per share
Yen
Record date Effective date
March 25, 2021
General Meeting of Shareholders
Ordinary
shares
7,989 20.00
December 31,
2020
March 26,
2021
August 5, 2021
Board of Directors meeting
Ordinary
shares
7,989 20.00
June 30,
2021
September 3,
2021
2. Dividends for which the effective date is in the following fiscal year are as follows:
Resolution date Type of shares Total amount of dividends
(Millions of yen)
Dividend per share
Yen
Record date Effective date
March 25, 2022
General Meeting of Shareholders
Ordinary
shares
11,984 30.00
December 31,
2021
March 28,
2022
For the fiscal year 2022
1. Dividends paid
Resolution date Type of shares Total amount of dividends
(Millions of yen)
Dividend per share
Yen
Record date Effective date Total amount of dividends
Thousands of U.S. dollars
Dividend per share
(U.S. dollars)
March 25, 2022
General Meeting of Shareholders
Ordinary
shares
11,984 30.00
December 31,
2021
March 28,
2022
90,870 0.23
August 10, 2022
Board of Directors meeting
Ordinary
shares
9,988 25.00
June 30,
2022
September 5,
2022
75,736 0.19
2. Dividends for which the effective date is in the following fiscal year are as follows:
Resolution date Type of shares Total amount of dividends
(Millions of yen)
Dividend per share
Yen
Record date Effective date Total amount of dividends
Thousands of U.S. dollars
Dividend per share
(U.S. dollars)
March 24, 2023
General Meeting of Shareholders
Ordinary
shares
29,966 75.00
December 31,
2022
March 27,
2023
227,222 0.57
Note: Dividend per share includes a commemorative dividend of ¥50 ($0.38) for the 150th anniversary of our founding.
010_0252087912303.indd 57010_0252087912303.indd 57 2023/04/12 20:09:402023/04/12 20:09:40
58
Shiseido | Integrated Report 2023
27.
Net Sales
28.
Breakdown of Expenses by Nature
(1) Contract balances
The breakdown of the Group’s contract balance is as follows:
Millions of yen Thousands of U.S. dollars
IFRS transition date
(January 1, 2021)
2021/12 2022/12 2022/12
Receivables arising from contracts with customers
Notes and accounts receivable 144,874 151,139 170,183 1,290,438
Contract liabilities 6,739 8,038 6,942 52,639
Contract liabilities mainly consist of advances received in connection with customer loyalty programs that award points to customers.
In the consolidated statement of financial position, notes and accounts receivable are included in “Trade and other receivables” and “Other
financial assets (non-current)” and contract liabilities are included in “Other current liabilities.”
The balances of contract liabilities as of the beginning of the previous and current fiscal years have each been recognized as revenue for the
previous and current fiscal years, respectively.
The amounts of revenue recognized from performance obligations satisfied in prior periods were immaterial in the previous and current fiscal
years.
(2) Transaction price allocated to remaining performance obligations
As the Group has no significant transactions for which the individual expected contract period exceeds one year, it has applied the practical
expedient and omitted the presentation of information on remaining performance obligations. In addition, considerations arising from contracts with
customers do not include any significant amounts that are not included in transaction prices.
(3) Assets recognised from the costs to obtain or fulfil contracts with a customer
The amounts of assets recognized from costs to obtain or fulfill contracts with customers were immaterial in the previous and current fiscal years. If
the amortization period of an asset to be recognized is one year or less, the Group applies the practical expedient and recognizes the incremental
costs of obtaining a contract as an expense as incurred.
The breakdown of cost of sales and selling, general and administrative expenses by nature is as follows:
Millions of yen Thousands of U.S. dollars
2021/12 2022/12 2022/12
Purchase costs of raw materials and merchandise 153,693 209,923 1,591,773
Changes in finished goods and work in process 33,022 10,441 79,170
Employee benefit expenses 274,597 269,123 2,040,666
Depreciation and amortization 76,058 75,718 574,143
Outsourced processing expenses 27,987 42,528 322,475
Media expenses 109,665 104,677 793,729
Sample and sales equipment expenses 51,012 44,775 339,513
Others 312,777 287,726 2,181,726
Total 1,038,815 1,044,913 7,923,210
010_0252087912303.indd 58010_0252087912303.indd 58 2023/04/12 20:09:402023/04/12 20:09:40

59
CORPORATE DATA
29.
Other Operating Income and Operating Expenses
30.
Finance Income and Finance Costs
The breakdown of other operating income is as follows:
Millions of yen Thousands of U.S. dollars
2021/12 2022/12 2022/12
Rental income from buildings 442 441 3,344
Subsidy income 2,715 4,917 37,284
Gain on sale of non-current assets 584 4,319 32,749
Reversal of impairment losses 719 494 3,746
Gain on transfer of businesses 133,843 15,294 115,969
Others 2,693 2,105 15,961
Total 140,999 27,573 209,076
Details of gain on sale of businesses are presented in “36. Major Subsidiaries.”
The breakdown of other operating expenses is as follows:
Millions of yen Thousands of U.S. dollars
2021/12 2022/12 2022/12
Restructuring costs — 3,442 26,099
Impairment losses 11,579 — —
Total 11,579 3,442 26,099
The breakdown of finance income is as follows:
Millions of yen Thousands of U.S. dollars
2021/12 2022/12 2022/12
Interest income
Financial assets measured at amortized cost 1,244 4,871 36,935
Lease receivables 36 57 432
Dividend income
Financial assets measured at fair value through other comprehensive income 273 71 538
Financial assets measured at fair value through profit or loss 0 8 61
Gain on revaluation of fair value
Financial assets measured at fair value through profit or loss — 831 6,301
Foreign exchange gains 2,369 — —
Others 155 38 288
Total 4,079 5,877 44,563
The breakdown of finance costs is as follows:
Millions of yen Thousands of U.S. dollars
2021/12 2022/12 2022/12
Interest expenses
Financial liabilities measured at amortized cost 1,088 513 3,890
Lease liabilities 1,663 1,703 12,913
Retirement benefit liability 293 276 2,093
Unwinding of provisions due to passage of time 11 8 61
Foreign exchange losses — 531 4,026
Interest on other financial liabilities
Financial liabilities measured at amortized cost 529 115 872
Others 243 479 3,632
Total 3,829 3,627 27,502
Financial liabilities measured at amortized cost in the amounts of interest expenses include the amounts reclassified from cash flow hedge reserve
arising from derivatives to profit or loss (refer to “35. Financial Instruments” of the Notes.)
010_0252087912303.indd 59010_0252087912303.indd 59 2023/04/12 20:09:402023/04/12 20:09:40
60
Shiseido | Integrated Report 2023
31.
Other Comprehensive Income
The amounts arising during the year, reclassification adjustments to profit and loss, and the impact on tax effects for each item of other
comprehensive income are as follows:
Millions of yen Thousands of U.S. dollars
2021/12 2022/12 2022/12
Items that will not be reclassified to profit or loss:
Financial assets measured at fair value through other comprehensive income
Amount arising during the year 166 (898) (6,809)
Tax effect (56) 223 1,691
Amount after tax effect adjustment 110 (675) (5,118)
Remeasurements of defined benefit plans
Amount arising during the year 7,403 16,492 125,053
Tax effect (2,441) (5,357) (40,620)
Amount after tax effect adjustment 4,961 11,134 84,425
Share of other comprehensive income of investments accounted for using
equity method
Amount arising during the year 0 24 182
Tax effect — — —
Amount after tax effect adjustment 0 24 182
Items that may be reclassified to profit or loss
Exchange differences on translation of foreign operations
Amount arising during the year 35,079 39,987 303,207
Reclassification adjustments (16) 36 273
Amount before tax effect adjustment 35,062 40,024 303,488
Tax effect — — —
Amount after tax effect adjustment 35,062 40,024 303,488
Cash flow hedges
Amount arising during the year (61) (52) (394)
Reclassification adjustments 204 191 1,448
Amount before tax effect adjustment 142 139 1,054
Tax effect (44) (43) (326)
Amount after tax effect adjustment 98 96 728
Share of other comprehensive income of investments accounted for using
equity method
Amount arising during the year 515 873 6,620
Reclassification adjustments — — —
Amount before tax effect adjustment 515 873 6,620
Tax effect — — —
Amount after tax effect adjustment 515 873 6,620
Total other comprehensive income:
Amount arising during the year 43,102 56,426 427,859
Reclassification adjustments 187 228 1,729
Amount before tax effect adjustment 43,290 56,655 429,595
Tax effect (2,542) (5,178) (39,263)
Amount after tax effect adjustment 40,748 51,477 390,332
010_0252087912303.indd 60010_0252087912303.indd 60 2023/04/12 20:09:402023/04/12 20:09:40

61
CORPORATE DATA
32.
Earnings Per Share
33.
Cash Flow Information
(1) Basis for the calculation of basic earnings per share
2021/12 2022/12 2022/12
Profit attributable to owners of parent (Millions of yen/ Thousands of U.S.
dollars)
46,909 34,202 259,342
Profit not attributable to common shareholders of parent (Millions of yen/
Thousands of U.S. dollars)
— — —
Profit used for calculating basic earnings per share (Millions of yen/ Thousands
of U.S. dollars)
46,909 34,202 259,342
Weighted-average number of shares of common stock 399,480 399,538
(Thousands of shares)
Basic earnings per share (Yen/ U.S. dollars) 117.43 85.60 0.65
(2) Basis for the calculation of diluted earnings per share
2021/12 2022/12 2022/12
Profit attributable to owners of parent (Millions of yen/ Thousands of U.S.
dollars)
46,909 34,202 259,342
Profit not attributable to common shareholders of parent (Millions of yen/
Thousands of U.S. dollars)
— — —
Profit used for calculating diluted earnings per share (Millions of yen/ Thousands
of U.S. dollars)
46,909 34,202 259,342
Weighted-average number of shares of common stock 399,480 399,538
(Thousands of shares)
Increase in common stock
Increase from stock options (Thousands of shares) 335 284
Diluted weighted number of shares of common stock 399,816 399,822
after dilution (Thousands of shares)
Diluted earnings per share (Yen/Thousands of U.S. dollars) 117.33 85.54 0.65
(1) Changes in liabilities related to financing activities are as follows:
Millions of yen
January 1, 2021
Changes involving
cash flows
Changes not involving cash flows
December 31,
2021
New leases
Exchange
differences on
translation of foreign
operations
Others
Short-term borrowings and commercial
papers
56,491 (57,885) — 1,394 — —
Long-term borrowings
(including current portion)
178,591 (84,714) — 2,768 — 96,645
Bonds (including current portion)
65,000 — — — — 65,000
Lease liabilities (Note 1)
144,555 (24,804) 25,236 6,917 (7,712) 144,192
Long-term accounts payable
(including current portion) (Note 2)
52,437 (3,437) — 1,624 (48,255) 2,370
Total
497,076 (170,841) 25,236 12,704 (55,968) 308,208
Note 1: “Others” in lease liabilities are mainly decreases resulting from the revision of considerations due to lease modifications.
Note 2: “Others” in long-term accounts payable are decreases resulting from the termination of a global license agreement with Dolce&Gabbana S.r.l.
010_0252087912303.indd 61010_0252087912303.indd 61 2023/04/12 20:09:402023/04/12 20:09:40
62
Shiseido | Integrated Report 2023
Millions of yen
January 1, 2022
Changes involving
cash flows
Changes not involving cash flows
December 31, 2022
New leases
Exchange
differences on
translation of foreign
operations
Others
Short-term borrowings and commercial
papers
— 73 — 1 — 75
Long-term borrowings
(including current portion)
96,645 (730) — — — 95,915
Bonds (including current portion)
65,000 5,000 — — — 70,000
Lease liabilities (Note 1)
144,192 (29,704) 13,211 8,510 (5,011) 131,198
Long-term accounts payable
(including current portion)
2,370 (295) — 690 — 2,765
Total
308,208 (25,656) 13,211 9,202 (5,011) 299,954
Note: “Others” in lease liabilities are mainly decreases resulting from the revision of considerations due to lease modifications.
Thousands of U.S. dollars
January 1, 2022
Changes involving
cash flows
Changes not involving cash flows
December 31, 2022
New leases
Exchange
differences on
translation of foreign
operations
Others
Short-term borrowings and commercial
papers
— 554 — 8 — 569
Long-term borrowings
(including current portion)
732,825 (5,535) — — — 727,290
Bonds (including current portion)
492,872 37,913 — — — 530,786
Lease liabilities
1,093,358 (225,235) 100,174 64,528 (37,997) 994,829
Long-term accounts payable
(including current portion)
17,971 (2,237) — 5,232 — 20,966
Total
2,337,034 (194,540) 100,174 69,776 (37,997) 2,274,446
(2) Non-cash transactions
The amount of assets related to newly recognized lease transactions is as follows:
Millions of yen Thousands of U.S. dollars
2021/12 2022/12 2022/12
Right-of-use assets 24,087 12,638 95,830
The decrease in assets resulting from the termination of a global license agreement with Dolce&Gabbana S.r.l. is as follows:
Millions of yen Thousands of U.S. dollars
2021/12 2022/12 2022/12
Trademark rights 48,255 — —
(3) Loss of control over subsidiaries
Information about the loss of control over subsidiaries is presented in “36. Major Subsidiaries” of the Notes.
010_0252087912303.indd 62010_0252087912303.indd 62 2023/04/12 20:09:402023/04/12 20:09:40

63
CORPORATE DATA
34.
Share-based Payments
(1) Stock option plan
(i) Details of stock option plan
The Company adopts a stock option plan. Stock options are granted to directors and executive officers of the Company or its subsidiaries with
an aim to incentivize and motivate them to increase corporate value. All stock options issued by the Company are equity-settled stock-based
compensation. The exercise period is specified in the allotment contract, and the options will be forfeited if they are not exercised within that
period. New stock options are no longer issued due to the introduction of performance-linked compensation from the fiscal year ended De-
cember 31, 2019.
Details of stock options issued by the Company are as follows:
• Vesting conditions: Continuous service from the grant date to the vesting date (the day before the date of start of the exercise period) (The
person must maintain the position of a director or an executive officer of the Company at the time of rights exercise. However, this shall not
apply in the case of retirement due to expiration of term of office, mandatory retirement, or when there are other justifiable reasons.)
• Exercise period: 12 years from the first day of the month containing the day on which three years have passed since the grant date (for the
FY2011–FY2014 portion of grants) or 12 years and six months from the first day of the month containing the day on which two years and six
months have passed since the grant date (for the FY2015–FY2018 portion of grants)
Note: Details of the stock option plan are presented below.
The objective of this plan is to issue stock acquisition rights as stock options to directors and corporate officers of the Company and its
associated Group companies pursuant to Articles 236 and 238 of the Companies Act.
Fiscal Year 2011 Stock
Options (28th and 29th Series
Stock Acquisition Rights)
Fiscal Year 2012 Stock
Options (30th and 31st Series
Stock Acquisition Rights)
Fiscal Year 2013 Stock
Options (32nd and 33rd Series
Stock Acquisition Rights)
Resolution date Resolved at the Ordinary
General Meeting of
Shareholders held on June
24, 2011 and the Board of
Directors meeting held on
July 29, 2011
Resolved at the Ordinary
General Meeting of
Shareholders held on June
26, 2012 and the Board of
Directors meeting held on
July 31, 2012
Resolved at the Ordinary
General Meeting of
Shareholders held on June
25, 2013 and the Board of
Directors meeting held on
July 31, 2013
Title and number of grantees 5 directors of the Company
12 corporate officers of the
Company
5 directors of the Company
14 corporate officers of the
Company
6 directors of the Company
10 corporate officers of the
Company
Number of stock acquisition rights (Units)* 51 (Note 1) 280 (Note 1) 303 (Note 1)
[278]
Class, details, and number of shares to be issued
upon exercise of stock acquisition rights (Shares)*
Ordinary shares
5,100 (Note 2)
Ordinary shares
28,000 (Note 2)
Ordinary shares
30,300 (Note 2)
[27,800]
Amount paid in upon exercise of stock acquisition
rights (Yen)
1 (Note 3) 1 (Note 3) 1 (Note 3)
Exercise period of stock acquisition rights* August 1, 2014–
July 31, 2026
August 1, 2015–
July 31, 2027
August 1, 2016–
July 31, 2028
Issue price and amount credited to equity in the
event of issuance of shares upon exercise of stock
acquisition rights (Yen)*
Issue price: 1,295 (Note 4)
Amount credited to equity:
648
Issue price: 1,002 (Note 4)
Amount credited to equity:
501
Issue price: 1,435 (Note 4)
Amount credited to equity:
718
Conditions for exercising stock acquisition rights* (Note 5) (Note 5) (Note 5)
Transfer of stock acquisition rights* The transfer of stock
acquisition rights shall be
subject to the approval of
the Board of Directors.
The transfer of stock
acquisition rights shall be
subject to the approval of
the Board of Directors.
The transfer of stock
acquisition rights shall be
subject to the approval of
the Board of Directors.
Delivery of stock acquisition rights in the event of
the Reorganization*
(Note 6) (Note 6) (Note 6)
010_0252087912303.indd 63010_0252087912303.indd 63 2023/04/12 20:09:402023/04/12 20:09:40
64
Shiseido | Integrated Report 2023
Fiscal Year 2014 Stock
Options (34th and 35th Series
Stock Acquisition Rights)
Fiscal Year 2015 Stock
Options (36th and 37th Series
Stock Acquisition Rights)
Fiscal Year 2016 Stock
Options (38th and 39th Series
Stock Acquisition Rights)
Resolution date Resolved at the Ordinary
General Meeting of
Shareholders held on June
25, 2014 and the Board of
Directors meeting held on
July 31, 2014
Resolved at the Ordinary
General Meeting of
Shareholders held on June
23, 2015 and the Board of
Directors meeting held on
February 23, 2016
Resolved at the Ordinary
General Meeting of
Shareholders held on March
25, 2016 and the Board of
Directors meeting held on
February 23, 2017
Title and number of grantees 5 directors of the Company
1 individual who was the
Chairman (Representative
Director) until the close of
the 114th General Meeting
of Shareholders
12 corporate officers of the
Company
3 directors of the Company
13 corporate officers of the
Company or its wholly
owned subsidiaries
2 individuals who were
corporate officers of the
Company until December
31, 2015
3 directors of the Company
20 corporate officers of the
Company or its wholly
owned subsidiaries
1 employee of a subsidiary
of the Company (1
individual who was a
corporate officer of the
Company until December
31, 2016)
Number of stock acquisition rights (Units)* 321 (Note 1) 178 (Note 1)
[168]
855 (Note 1)
[585]
Class, details, and number of shares to be issued
upon exercise of stock acquisition rights (Shares)*
Ordinary shares
32,100 (Note 2)
Ordinary shares
17,800 (Note 2)
[16,800]
Ordinary shares
85,500 (Note 2)
[58,500]
Amount paid in upon exercise of stock acquisition
rights (Yen)
1 (Note 3) 1 (Note 3) 1 (Note 3)
Exercise period of stock acquisition rights* August 1, 2017–
July 31, 2029
September 1, 2018–
February 28, 2031
September 1, 2019–
February 29, 2032
Issue price and amount credited to equity in the
event of issuance of shares upon exercise of stock
acquisition rights (Yen)*
Issue price: 1,899.5 (Note 4)
Amount credited to equity:
950
Issue price: 2,516.5 (Note 4)
Amount credited to equity:
1,259
Issue price: 2,991 (Note 4)
Amount credited to equity:
1,496
Conditions for exercising stock acquisition rights* (Note 5) (Note 5) (Note 5)
Transfer of stock acquisition rights* The transfer of stock
acquisition rights shall be
subject to the approval of
the Board of Directors.
The transfer of stock
acquisition rights shall be
subject to the approval of
the Board of Directors.
The transfer of stock
acquisition rights shall be
subject to the approval of
the Board of Directors.
Delivery of stock acquisition rights in the event of
the Reorganization*
(Note 6) (Note 6) (Note 6)
Fiscal Year 2017 Stock Options
(40th and 41st Series Stock
Acquisition Rights)
Fiscal Year 2018 Stock Options
(42nd and 43rd Series Stock
Acquisition Rights)
Resolution date Resolved at the Ordinary
General Meeting of
Shareholders held on March
28, 2017 and the Board of
Directors meeting held on
March 6, 2018
Resolved at the Ordinary
General Meeting of
Shareholders held on March
27, 2018 and the Board of
Directors meeting held on
February 21, 2019
Title and number of grantees 3 directors of the Company
13 corporate officers of the
Company or its wholly
owned subsidiaries
5 individuals who were
corporate officers of the
Company or its wholly
owned subsidiaries until
December 31, 2017
3 directors of the Company
12 corporate officers of the
Company or its wholly
owned subsidiaries
3 individuals who were
corporate officers of the
Company or its wholly
owned subsidiaries until
December 31, 2018
Number of stock acquisition rights* 602 (Note 1)
[585]
154 (Note 1)
Class, details, and number of shares to be issued
upon exercise of stock acquisition rights (Shares)*
Ordinary shares
60,200 (Note 2)
[58,500]
Ordinary shares
15,400 (Note 2)
Amount paid in upon exercise of stock acquisition
rights (Yen)
1 (Note 3) 1 (Note 3)
Exercise period of stock acquisition rights* September 1, 2020–
February 28, 2033
September 1, 2021–
February 28, 2034
Issue price and amount credited to equity in the
event of issuance of shares upon exercise of stock
acquisition rights (Yen)*
Issue price: 6,616 (Note 4)
Amount credited to equity:
3,308
Issue price: 7,865 (Note 4)
Amount credited to equity:
3,933
Conditions for exercising stock acquisition rights* (Note 5) (Note 5)
Transfer of stock acquisition rights* The transfer of stock
acquisition rights shall be
subject to the approval of
the Board of Directors.
The transfer of stock
acquisition rights shall be
subject to the approval of
the Board of Directors.
Delivery of stock acquisition rights in the event of
the Reorganization*
(Note 6) (Note 6)
* The description above represents the status as of the end of the current fiscal year (December 31, 2022). The details changed between December 31, 2022 and February 28, 2023, which is the
end of the month preceding to the filing month, are shown in square brackets based on the status as of February 28, 2023. The other details have not changed from December 31, 2022.
010_0252087912303.indd 64010_0252087912303.indd 64 2023/04/12 20:09:402023/04/12 20:09:40

65
CORPORATE DATA
(ii) Number and weighted average exercise price of stock options
2021/12 2022/12
Number of shares
Weighted average exercise
price
Number of shares
Weighted average exercise
price
Shares Yen Shares Yen
Outstanding at the beginning of the year 392,000 1 319,500 1
Granted — — — —
Exercised (30,300) 1 (45,100) 1
Forfeited (42,200) 1 — —
Outstanding at the end of the year 319,500 1 274,400 1
Exercisable at the end of the year 319,500 1 274,400 1
Notes
1. The weighted average share price at the time of exercise of stock options exercised during the previous fiscal year and the current fiscal year was ¥7,454 and ¥6,127 ($46.46), respectively.
2. The exercise price of stock options outstanding as of the end of the previous fiscal year and the current fiscal year was both ¥1.
3. The weighted average remaining contract years of stock options outstanding as of the end of the previous fiscal year and the current fiscal year were 9.0 years and 8.2 years, respectively.
(iii) Share-based payment expenses
Share-based payment expenses included in “Selling, general and administrative expenses” in the consolidated statement of profit and loss
were ¥69 million in the previous fiscal year. No expenses were incurred in the current fiscal year as no new stock options were issued and the
vesting of outstanding stock options had been completed by the end of the previous fiscal year.
Notes: 1. The number of shares to be issued upon exercise of one stock acquisition right shall be 100 shares.
2. In the event that the Company implements a stock split (including gratis allocation of the Company’s shares) or stock consolidation, the number of shares to be issued upon exercise of
stock acquisition rights (the “Number of Subject Shares”) shall be adjusted in accordance with the following formula, with any fraction of one share occurring upon such adjustment
discarded:
Number of Subject Shares after adjustment = Number of Subject Shares before adjustment × Split/consolidation ratio
In addition, upon the occurrence of any unavoidable event that requires adjustment to the Number of Subject Shares, an adjustment shall be made thereto to the extent it is reasonable.
3. The amount of property to be contributed upon exercise of each stock acquisition right shall be the amount of cash to be paid in for each of the shares to be delivered upon exercise thereof,
which shall be ¥1, multiplied by the Number of Subject Shares.
4. The issue price is the sum of the amount paid in upon the exercise of each stock acquisition right (¥1 per share) and the fair value of each stock acquisition right (¥1,294 per share for the
28th and 29th Series; ¥1,001 per share for the 30th and 31st Series; ¥1,434 per share for the 32nd and 33rd Series; ¥1,898.5 per share for the 34th and 35th Series; ¥2,515.5 per share
for the 36th and 37th Series; ¥2,990 per share for the 38th and 39th Series; ¥6,615 per share for the 40th and 41st Series; and ¥7,864 per share for the 42nd and 43rd Series) at the grant
date.
5. (1) Any allottee of stock acquisition rights shall remain in office as director or corporate officer of the Company when he/she exercises the rights, unless he/she leaves office upon expiration
of the term of office or due to any other justifiable reasons.
(2) If any allottee of stock acquisition rights dies prior to the expiration of the exercise period of the stock acquisition rights, only one heir to such allottee shall be entitled to succeed to his/
her rights and no one can succeed to such heir.
(3) Any other conditions for exercising stock acquisition rights shall be governed by a “contract of allotting stock acquisition rights” to be entered into between the Company and the relevant
allottee of the stock acquisition rights.
6. In the event that the Company is merged (as a result of which, the Company shall be dissolved), or conducts an absorption-type company split, incorporation-type company split, share
exchange or share transfer (collectively, the “Reorganization”), the Company shall, with regard to the stock acquisition rights outstanding when the Reorganization becomes effective (the
“Outstanding Stock Acquisition Rights”), deliver to any allottee thereof stock acquisition rights of relevant corporations (“Reorganizing Companies”) listed in Article 236, paragraph 1, item 8
(a) through (e) of the Companies Act, in accordance with the following conditions. In such case, the Outstanding Stock Acquisition Rights shall become null and void and the Reorganizing
Companies shall newly issue stock acquisition rights, only if and when the delivery of stock acquisition rights of the Reorganizing Companies is stipulated in accordance with the following
conditions in the absorption-type merger agreement, consolidation-type merger agreement, absorption-type company split agreement, incorporation-type company split plan, share
exchange agreement or share transfer plan.
(1) Number of stock acquisition rights of the Reorganizing Company to be delivered
The same number as that of the Outstanding Stock Acquisition Rights held by each allottee thereof shall be delivered.
(2) Class of shares of the Reorganizing Company to be issued upon exercise of stock acquisition rights
Ordinary shares of the Reorganizing Company
(3) Number of shares of the Reorganizing Company to be issued upon exercise of stock acquisition rights
The number of such shares shall be determined in accordance with Note 2 above, by taking into account the conditions of the Reorganization.
(4) Amount of property to be contributed upon exercise of each stock acquisition right
The amount of property to be contributed upon exercise of each stock acquisition right to be delivered shall be an amount obtained by multiplying the paid-in amount after the
Reorganization set forth below by the number of shares of the Reorganizing Company be issued upon exercise of each of the stock acquisition rights, which shall be determined as set
forth in (3) above. The paid-in amount after the Reorganization shall be ¥1 per share of the Reorganizing Company that can be delivered upon exercise of each stock acquisition right
delivered.
(5) Exercise period of stock acquisition rights
From later of the first day of the exercise period of the Outstanding Stock Acquisition Rights and the day on which the Reorganization becomes effective, to the last day of the exercise
period of the Outstanding Stock Acquisition Rights
(6) Matters concerning share capital and legal capital surplus to be increased in the event that the Reorganizing Company issues shares upon exercise of stock acquisition rights
Such matters shall be determined in accordance with the provisions set forth for the Outstanding Stock Acquisition Rights.
(7) Restriction on acquisition of stock acquisition rights by transfer
Any acquisition of stock acquisition rights by transfer shall be subject to the approval by resolution of the board of directors of the Reorganizing Company.
(8) Terms and conditions of acquisition of stock acquisition rights
Such terms and conditions shall be determined in accordance with the terms and conditions specified for the Outstanding Stock Acquisition Rights.
(9) Other conditions for exercising stock acquisition rights
Such conditions shall be determined in accordance with the conditions for exercising the Outstanding Stock Acquisition Rights.
010_0252087912303.indd 65010_0252087912303.indd 65 2023/04/12 20:09:402023/04/12 20:09:40
66
Shiseido | Integrated Report 2023
(2) Performance-linked stock compensation plan
(i) Details of performance-linked stock compensation plan
The Company adopts a performance share unit plan under which shares in the Company or money are granted according to the rate of
achievement of several predetermined evaluation indicators and other factors. This plan provides an effective incentive for generating and
maintaining corporate value over the long term, and is designed to encourage its personnel to share with its shareholders an awareness of the
importance of sustainably generating profits.
Each fiscal year, the Company grants share units (one unit = one share) to eligible members (directors, executive officers, and employees).
Multiple evaluation indicators are determined in advance, with three fiscal years, including the fiscal year subject to grant, set as the period
subject to evaluation. After the end of the evaluation period, the Company calculates a payout ratio within a range of 50% to 150% based on
the achievement rate of each evaluation indicator. After adjusting the number of share units based on the payout ratio, the Company grants
monetary compensation claims and money for the delivery of the Company’s ordinary shares in proportion to the number of such stock units to
each grantee. All such monetary compensation claims are to be contributed in kind in order to deliver the Company’s ordinary shares to each
grantee.
(ii) Method of measuring the fair unit price of the Company’s shares granted during the period based on the performance-linked stock compensa-
tion plan
The fair value of the Company’s shares granted during the period is determined based on the share price on the grant date.
The number of share units granted during the period and their fair value are as follows:
Yen U.S. dollars
2021/12 2022/12 2022/12
Number of units granted during the period (units) 128,177 161,446
Weighted average fair value 7,439 6,438 48.82
(iii) Share-based payment expenses
Share-based payment expenses included in “Selling, general and administrative expenses” in the consolidated statement of profit and loss
are as follows:
Millions of yen Thousands of U.S. dollars
2021/12 2022/12 2022/12
Equity-settled 649 892 6,764
Cash-settled 277 385 2,919
Total liabilities arising from share-based payment transactions are as follows:
Millions of yen Thousands of U.S. dollars
IFRS transition date
(January 1, 2021)
2021/12 2022/12 2022/12
Total carrying amount of liabilities 266 558 881 6,680
Total intrinsic value of vested liabilities 266 558 881 6,680
010_0252087912303.indd 66010_0252087912303.indd 66 2023/04/12 20:09:402023/04/12 20:09:40
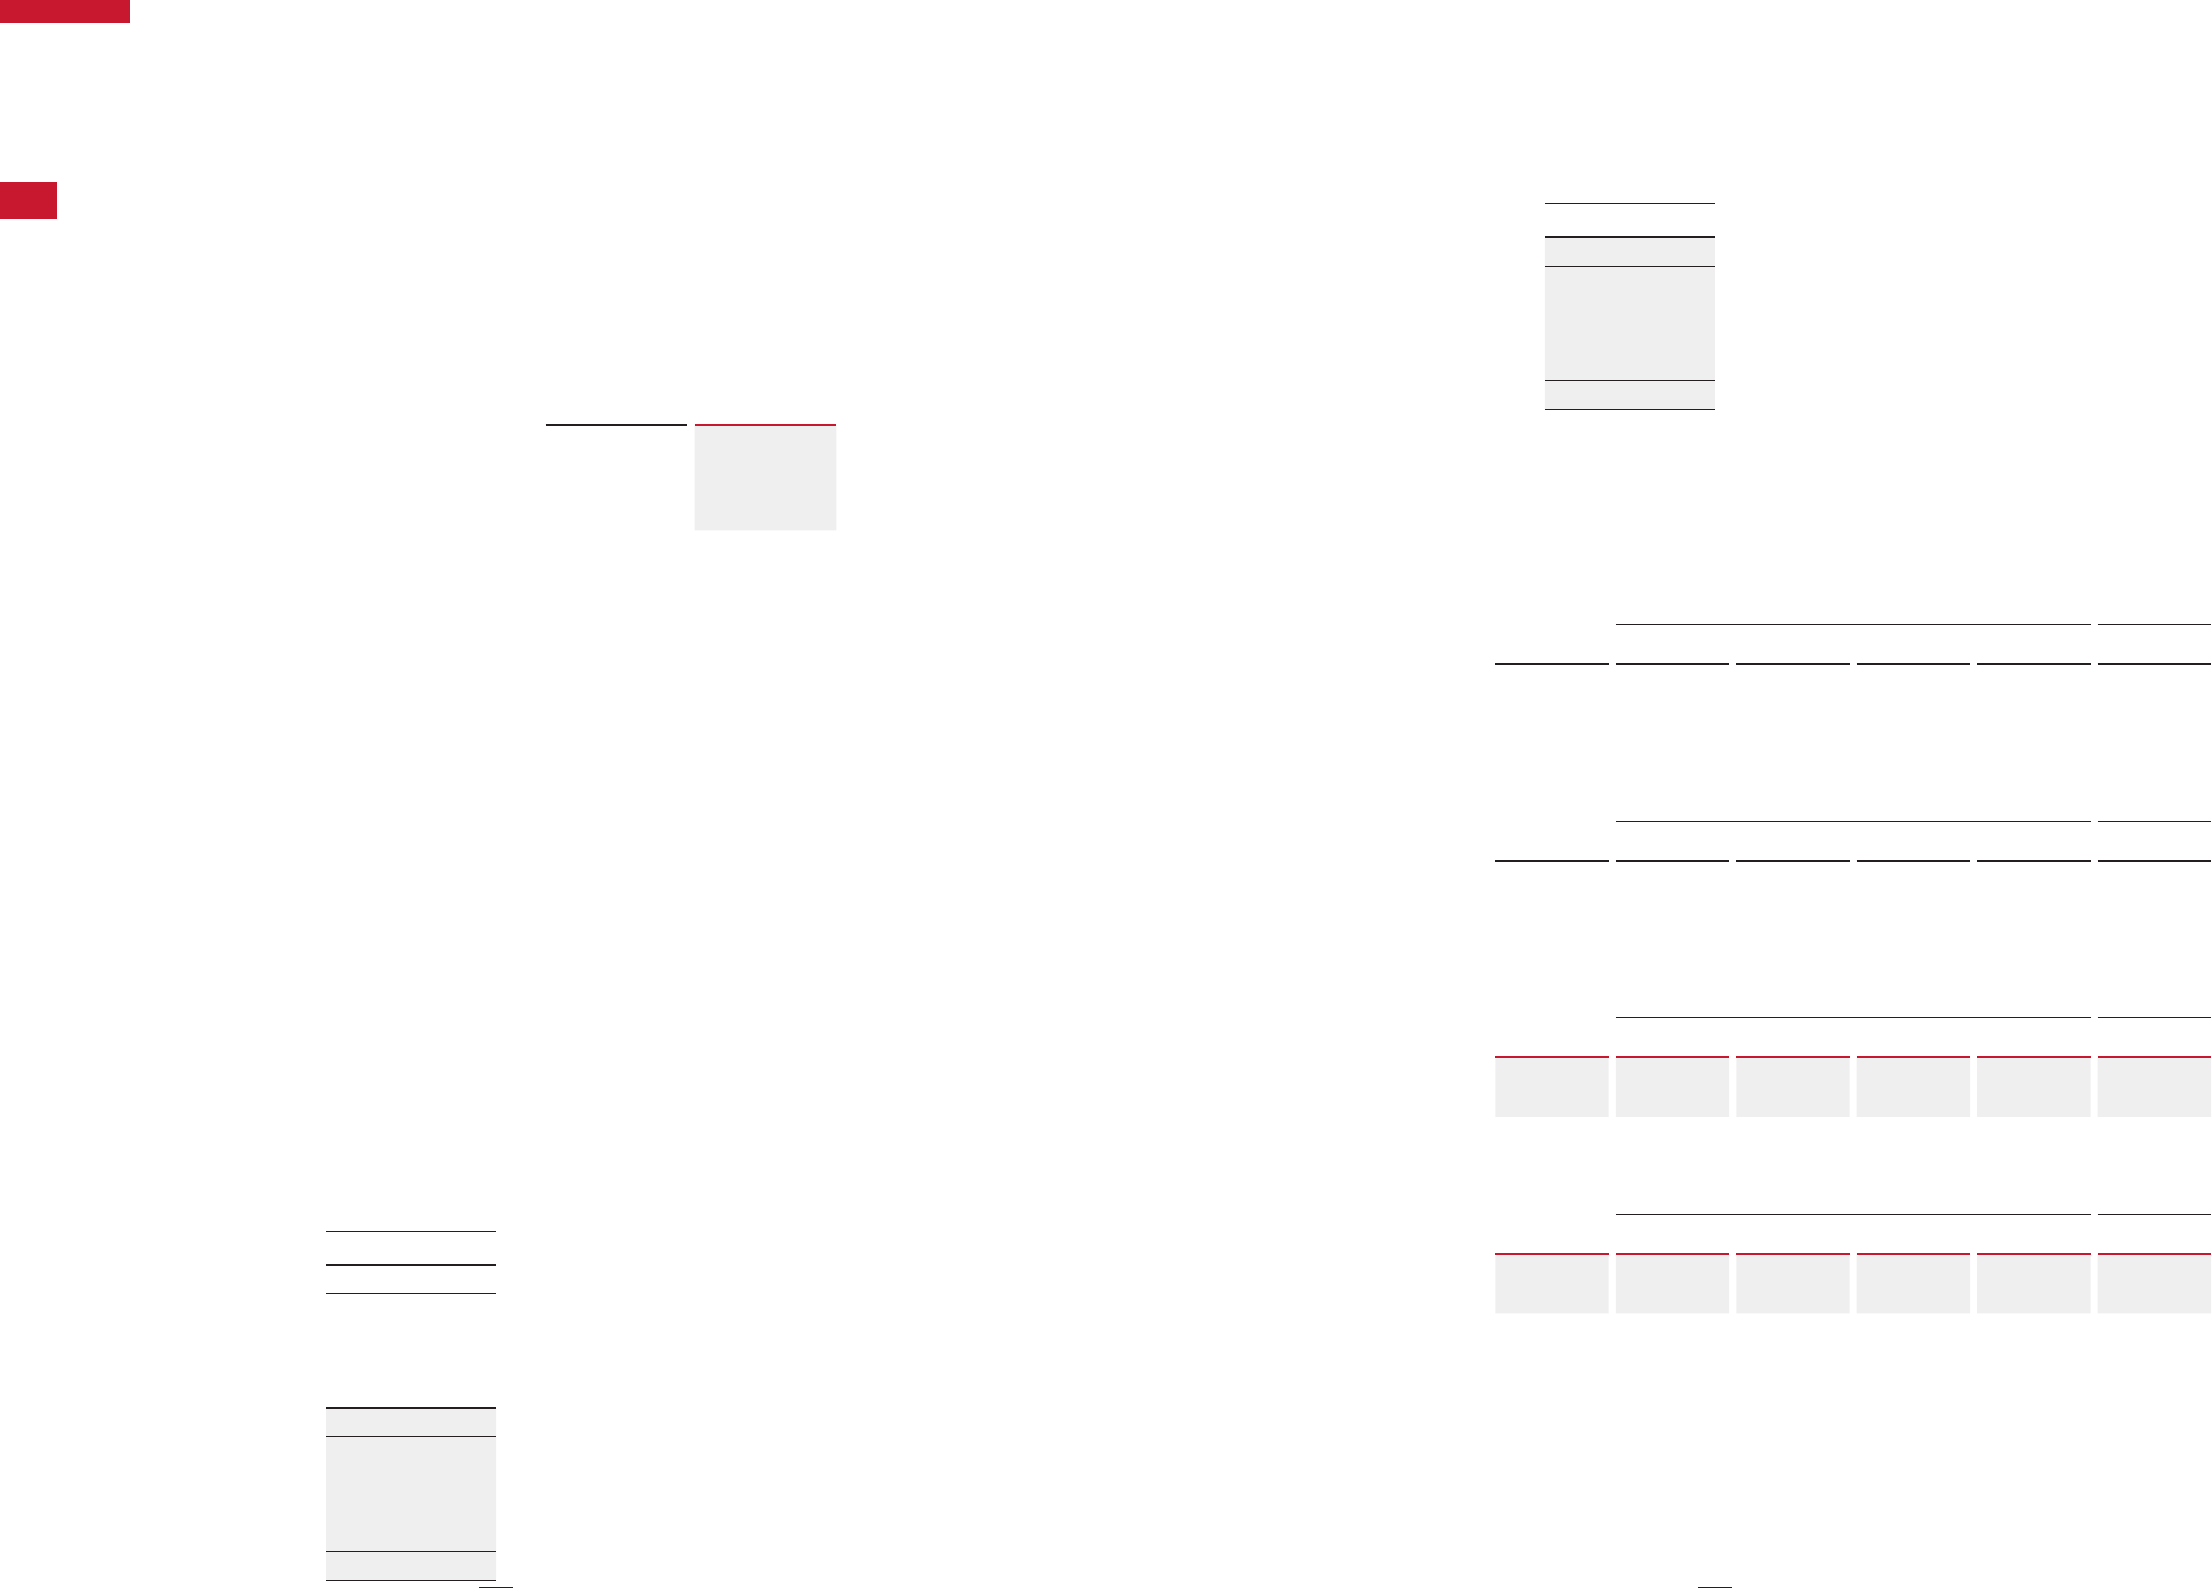
67
CORPORATE DATA
35.
Financial Instruments
(1) Capital management
The Group’s basic policy for capital management is to endeavor to maintain its shareholders’ equity at an appropriate level as well as to improve its
capital efficiency in order to achieve sustainable growth and maximize its corporate value.
Major indicators used by the Group to manage its capital are net interest-bearing debt to EBITDA ratio, net debt-equity ratio, return on equity
(ROE), and return on invested capital (ROIC).
The Group’s net interest-bearing debt to EBITDA ratio, net debt-equity ratio, ROE, and ROIC are as follows:
2021/12 2022/12
Net interest-bearing debt to EBITDA ratio (times) (Note 1) (0.11) 0.31
Net debt-equity ratio (times) (Note 2) (0.02) 0.05
ROE (%) (Note 3) 9.3 6.0
ROIC (%) (Note 4) 2.9 5.2
Note 1: (Interest-bearing debt (excluding lease liabilities) − Cash and cash equivalents − Time deposits with maturities exceeding 3 months) ÷ EBITDA
EBITDA = Core operating profit + Depreciation and amortization (excluding amortization of right-of-use assets)
2: (Interest-bearing debt (excluding lease liabilities) − Cash and cash equivalents − Time deposits with maturities exceeding 3 months) ÷ Equity attributable to owners of parent
3: Profit attributable to owners of parent ÷ Equity attributable to owners of parent (average of the beginning and ending balances)
4: Core operating profit × (1 − Tax rate) ÷ (Interest-bearing debt (average of the beginning and the ending balances, excluding lease liabilities) + Equity attributable to owners of parent (average
of the beginning and the ending balances))ollowing formula, with any fraction of one share occurring upon such adjustment
The Group is not subject to any significant capital restrictions (excluding the Companies Act and other general regulations).
(2) Financial risk management
The Group is exposed to financial risks (credit risk, liquidity risk, and market risk) in the course of its business activities. To mitigate such financial
risks, the Group carries out risk management in accordance with certain policies. The Group limits its investment to short-term deposits and securi-
ties, and other similar instruments, and has a policy to use bank borrowings, commercial papers, bonds, and other instruments to procure funds.
The Group uses derivatives to avoid the risk of foreign exchange fluctuations of foreign currency-denominated receivables and payables and the risk
of fluctuation of borrowing interest rates. The Group limits the use of derivatives to within the balance of receivables and payables and the scope of
actual demand, and does not engage in speculative transactions. The Group executes and manages derivatives in accordance with the internal rules
and regulations that prescribe transaction authority.
i. Credit risk management
Credit risk is the risk that a counterparty to a financial asset held by the Group will default on its contractual obligations, resulting in a financial loss
to the Group. Credit risk arises principally from the Group’s receivables from customers, loans receivable, and derivatives.
The Group manages due dates and outstanding balances for each counterparty and periodically monitors the credit status of major counterpar-
ties. The Group does not have any credit risk overly concentrated in a specific counterparty or a group to which such counterparty belongs.
To mitigate counterparty risk associated with the use of derivatives, the Group enters into derivatives only with highly creditworthy financial insti-
tutions and other such counterparties.
The carrying amount of impaired financial assets presented in the consolidated financial statements represents the maximum exposure of the
Group’s financial assets to credit risk, without taking into account the assessed value of collateral obtained.
Fluctuation analysis of allowance for doubtful accounts
The changes in allowance for doubtful accounts related to trade receivables are as follows:
Millions of yen
Lifetime expected credit losses
Balance as of January 1, 2021
3,777
Increase during period
951
Decrease during period (intended use)
(536)
Decrease during period (reversal)
(335)
Other changes
203
Balance as of January 1, 2022
4,060
Increase during period
1,288
Decrease during period (intended use)
(368)
Decrease during period (reversal)
(270)
Other changes
264
Balance as of December 31, 2022
4,972
010_0252087912303.indd 67010_0252087912303.indd 67 2023/04/12 20:09:402023/04/12 20:09:40
68
Shiseido | Integrated Report 2023
Thousands of U.S. dollars
Lifetime expected credit losses
Balance as of January 1, 2022
30,786
Increase during period
9,766
Decrease during period (intended use)
(2,790)
Decrease during period (reversal)
(2,047)
Other changes
2,002
Balance as of December 31, 2022
37,701
There are no financial assets that were directly written off in the current fiscal year but for which collection activities are still ongoing.
A maturity analysis of the carrying amount of trade receivables and the corresponding allowance for doubtful accounts is as follows. For financial as-
sets other than trade receivables, there are no items that are materially past due or have significant credit risk exposure.
IFRS transition date
(January 1, 2021)
Millions of yen
Not yet due
Past due
Within 30 days Over 30 days Over 60 days Over 90 days Total
Trade receivables
113,210 19,046 6,236 1,818 4,562 144,874
Allowance for doubtful accounts
187 136 113 25 3,313 3,777
2021/12
Millions of yen
Not yet due
Past due
Within 30 days Over 30 days Over 60 days Over 90 days Total
Trade receivables
131,314 12,997 2,495 828 3,503 151,139
Allowance for doubtful accounts
304 239 34 189 3,292 4,060
2022/12
Millions of yen
Not yet due
Past due
Within 30 days Over 30 days Over 60 days Over 90 days Total
Trade receivables
150,426 10,865 4,524 602 3,763 170,183
Allowance for doubtful accounts
1,136 20 34 27 3,753 4,972
2022/12
Thousands of U.S. dollars
Not yet due
Past due
Within 30 days Over 30 days Over 60 days Over 90 days Total
Trade receivables
1,140,628 82,386 34,304 4,565 28,534 1,290,438
Allowance for doubtful accounts
8,614 152 258 205 28,458 37,701
ii. Liquidity risk management
Liquidity risk is the risk that the Group is unable to perform the repayment obligations of financial liabilities on their due dates.
The Group strives to generate stable operating cash flows and secure a wide range of financing sources, while always seeking to appropriately
secure adequate funds for its business activities, maintain liquidity, and achieve a sound financial condition. The Group limits its investments to
short-term deposits and securities, and other similar instruments.
The Group manages its liquidity risk mainly by preparing and updating a cash management plan on a monthly basis.
010_0252087912303.indd 68010_0252087912303.indd 68 2023/04/12 20:09:402023/04/12 20:09:40

69
CORPORATE DATA
The balances of financial liabilities (including derivative financial instruments) by due date are as follows. The table below does not include financial
liabilities included in current liabilities other than those listed below as they are all due within one year and their carrying amounts are equal to the
contractual cash flows.
IFRS transition date
(January 1, 2021)
Millions of yen
Carrying
amount
Contractual
cash flow
Due within one
year
Due after one
year through
two years
Due after two
years through
three years
Due after three
years through
four years
Due after four
years through
five years
Due after five
years
Non-derivative financial liabilities
Borrowings 235,082 237,496 68,046 1,388 57,681 30,107 10,105 70,166
Bonds 65,000 65,279 100 15,069 10,043 40 40,025 —
Lease liabilities 144,555 147,247 23,267 20,962 17,911 14,794 10,461 59,850
Long-term other accounts
payable
(including current portion)
55,979 64,463 4,317 5,237 5,539 5,788 6,030 37,549
Derivative financial liabilities
Derivative liabilities 361 361 16 15 329 ———
Notes: 1. Receivables and payables arising from derivatives are presented on a net basis.
2. The above amounts of liabilities are presented as the sum of current liabilities and non-current liabilities.
2021/12
Millions of yen
Carrying
amount
Contractual
cash flow
Due within one
year
Due after one
year through
two years
Due after two
years through
three years
Due after three
years through
four years
Due after four
years through
five years
Due after five
years
Non-derivative financial liabilities
Borrowings 96,645 97,616 1,065 16,146 30,117 5,115 100 45,071
Bonds 65,000 65,178 15,069 10,043 40 40,025 ——
Lease liabilities 144,192 148,141 26,347 21,370 17,287 12,756 9,936 60,442
Long-term other accounts
payable
(including current portion)
5,543 6,050 880 1,205 1,205 1,263 460 1,035
Derivative financial liabilities
Derivative liabilities 703 703 501 201 ————
2022/12
Millions of yen
Carrying
amount
Contractual
cash flow
Due within one
year
Due after one
year through
two years
Due after two
years through
three years
Due after three
years through
four years
Due after four
years through
five years
Due after five
years
Non-derivative financial liabilities
Borrowings 95,990 96,379 16,169 30,064 5,063 55 45,026 —
Bonds 70,000 70,553 10,133 130 40,115 90 20,084 —
Lease liabilities 131,198 138,721 24,629 20,541 14,969 12,421 9,607 56,551
Long-term other accounts
payable
(including current portion)
5,054 5,460 923 1,080 1,124 1,181 503 647
Derivative financial liabilities
Derivative liabilities 88 88 88 —————
010_0252087912303.indd 69010_0252087912303.indd 69 2023/04/12 20:09:402023/04/12 20:09:40
70
Shiseido | Integrated Report 2023
2022/12
Thousands of U.S. dollars
Carrying
amount
Contractual
cash flow
Due within one
year
Due after one
year through
two years
Due after two
years through
three years
Due after three
years through
four years
Due after four
years through
five years
Due after five
years
Non-derivative financial liabilities
Borrowings 727,859 730,808 122,604 227,965 38,391 417 341,416 —
Bonds 530,786 534,979 76,835 986 304,178 682 152,290 —
Lease liabilities 994,829 1,051,873 186,753 155,755 113,505 94,184 72,847 428,806
Long-term accounts payable
(including current portion)
38,323 41,401 6,999 8,189 8,523 8,955 3,814 4,906
Derivative financial liabilities
Derivative liabilities 667 667 667 —————
Notes: 1. Receivables and payables arising from derivatives are presented on a net basis.
2. The above amounts of liabilities are presented as the sum of current liabilities and non-current liabilities.
iii. Market risk management
The Group is exposed to risks associated with market fluctuations such as foreign exchange fluctuations and interest rate fluctuations in the
course of its business activities. To appropriately manage these market risks, the Group may use derivatives, including foreign exchange forward
contracts, currency swap contracts, and interest rate swap contracts. The Group executes and manages derivatives in accordance with the
internal rules and regulations that prescribe transaction authority. The Group does not use derivatives for speculative purposes. Therefore,
changes in the fair value of derivatives held by the Company generally have the effect of effectively offsetting changes in the fair value or cash
flows of the corresponding transactions.
(i) Foreign exchange risk
The Group is engaged in business on a global scale and therefore is exposed to the risk of foreign exchange fluctuations of foreign curren-
cy-denominated receivables and payables mainly arising from foreign currency transactions. The risk of foreign exchange fluctuations associ-
ated with foreign currency transactions are hedged using derivatives (foreign exchange forward contracts and foreign currency options) to
mitigate its impact on operating results.
The Group’s net exposures to foreign exchange fluctuation risk associated with receivables and payables denominated in the principal
foreign currencies of the US dollar, Euro, and Chinese yuan that it held at the end of each fiscal year are as follows. The following table ex-
cludes the amounts for which foreign exchange fluctuation risk is hedged by derivatives.
Millions of yen Thousands of U.S. dollars
2021/12 2022/12 2022/12
US dollar 11,022 21,728 164,756
Euro 8,177 4,072 30,877
Chinese yuan (512) 164 1,244
Concerning foreign currency-denominated receivables and payables held by the Group at the end of each fiscal year, the effect of a 10%
appreciation of the Japanese yen on profit before tax in the consolidated statement of profit and loss is as follows.
This analysis does not include the effects of translating financial instruments denominated in functional currencies as well as assets and
liabilities, and income and expenses of foreign operations into the Japanese yen. It also assumes that currencies other than the respective
currencies used in the calculations remain constant.
Millions of yen Thousands of U.S. dollars
2021/12 2022/12 2022/12
US dollar (1,102) (2,172) (16,470)
Euro (817) (407) (3,086)
Chinese yuan (51) (16) (121)
010_0252087912303.indd 70010_0252087912303.indd 70 2023/04/12 20:09:402023/04/12 20:09:40

71
CORPORATE DATA
(ii) Interest rate risk management
The Group is exposed to various interest rate fluctuation risks in its business activities. Among interest-bearing debts, short-term borrowings
and commercial papers are primarily used to procure funds for operating transactions, whereas long-term borrowings, bonds, and lease
liabilities are primarily used to procure funds for investments and loans, capital expenditures, and operating transactions. Floating-rate
borrowings are exposed to interest rate fluctuation risk. For some of these long-term borrowings, derivatives (interest rate swap contracts
and interest rate and currency swap contracts) are used as hedging instruments on an individual contract basis to reduce the risk of
interest rate fluctuations and fix interest payments.
Therefore, exposure to the interest rate fluctuation risk of the Company is limited, and the impact on the interest rate fluctuation is deter-
mined to be immaterial.
(3) Fair value of financial instruments
Financial instruments measured at fair value are classified into the following three levels according to the observability and materiality of inputs used
to measure such financial instruments.
Level 1: quoted prices (unadjusted) in active markets for identical assets or liabilities
Level 2: fair value measured by directly or indirectly using observable prices, other than level 1 prices
Level 3: fair value measured using valuation techniques that incorporate unobservable inputs
i. Methods of fair value measurement
The methods of measuring the fair value of financial instruments are as follows:
(Cash and cash equivalents, trade and other receivables, trade and other payables)
The fair value of these instruments is measured at their carrying amount as their fair value approximates their carrying amount because of their
short settlement periods.
(Other financial assets, other financial liabilities)
Of the financial assets measured at fair value through other comprehensive income, listed shares are measured at the quoted market price at
the fiscal year-end, whereas unlisted shares are primarily measured using the discounted cash flow (DCF) method.
Other financial assets measured at amortized cost mainly include long-term loans receivable and guarantee and leasehold deposits. Other
financial liabilities measured at amortized cost mainly include long-term accounts payable. The fair value of long-term loans receivable, guaran-
tee and leasehold deposits, and long-term accounts payable is measured at the fair value of future cash flows discounted at the current market
interest rate, etc. The fair value of financial assets and financial liabilities measured at amortized cost that have short settlement periods is
measured at the carrying amount as their fair value approximates their carrying amount.
Derivatives, which are either financial assets or financial liabilities measured at fair value through profit or loss, mainly include foreign
exchange forward contracts and interest rate swap contracts. The fair value of these instruments is measured based on forward foreign ex-
change rates provided by counterparty financial institutions or interest rates of interest rate swap contracts, etc. at the end of the accounting
period.
(Bonds and borrowings)
The fair value of short-term borrowings is measured at their carrying amount as their fair value approximates their carrying amount because of
their short settlement periods.
The fair value of long-term borrowings with floating interest rates is measured at their carrying amount as their fair value reflects the market
interest rates within a short period of time and therefore approximates their carrying amount.
The fair value of long-term borrowings with fixed interest rates is measured at the present value of future cash flows discounted at an interest
rate assumed to be applied if similar contracts were newly executed.
The fair value of bonds is measured based on quoted market prices, etc.
ii. Financial instruments measured at amortized cost
The carrying amount and the fair value of financial instruments measured at amortized cost are as follows. The table below does not include finan-
cial instruments whose fair value closely approximates their carrying amount.
010_0252087912303.indd 71010_0252087912303.indd 71 2023/04/12 20:09:412023/04/12 20:09:41
72
Shiseido | Integrated Report 2023
Millions of yen Thousands of U.S. dollars
IFRS transition date
(January 1, 2021)
2021/12 2022/12 2022/12
Carrying amount Fair value Carrying amount Fair value Carrying amount Fair value Carrying amount Fair value
Assets:
Other financial assets
Guarantee and leasehold deposits 26,457 23,470 24,832 21,791 24,574 18,682 186,336 141,659
Long-term loans receivable 0031,116 31,116 39,183 28,643 297,111 217,190
Total 26,457 23,470 55,948 52,907 63,758 47,326 483,455 358,857
Note: Their fair value is categorized as level 2 of the fair value hierarchy.
iii. Financial instruments measured at fair value
The fair value hierarchy of financial instruments measured at fair value is as follows:
IFRS transition date
(January 1, 2021)
Level 1 Level 2 Level 3 Total
Assets:
Financial assets measured at fair value through profit or loss
Other financial assets
Derivatives — 308 — 308
Others 1,014 — 2,963 3,978
Financial assets measured at fair value through other comprehensive income
Other financial assets
Shares and investments in capital 7,583 153 3,847 11,585
Total 8,598 462 6,811 15,872
Liabilities:
Financial liabilities measured at fair value through profit or loss
Other financial liabilities
Derivatives — 361 — 361
Total — 361 — 361
As of December 31, 2021
2021/12
Millions of yen
Level 1 Level 2 Level 3 Total
Assets:
Financial assets measured at fair value through profit or loss
Other financial assets
Derivatives — — — —
Others — — 3,250 3,250
Financial assets measured at fair value through other comprehensive income
Other financial assets
Shares and investments in capital 4,802 126 3,712 8,640
Total 4,802 126 6,963 11,891
Liabilities:
Financial liabilities measured at fair value through profit or loss
Other financial liabilities
Derivatives — 703 — 703
Total — 703 — 703
010_0252087912303.indd 72010_0252087912303.indd 72 2023/04/12 20:09:412023/04/12 20:09:41

73
CORPORATE DATA
As of December 31, 2022
2022/12
Millions of yen
Level 1 Level 2 Level 3 Total
Assets:
Financial assets measured at fair value through profit or loss
Other financial assets
Derivatives — 2,043 — 2,043
Others — — 6,540 6,540
Financial assets measured at fair value through other comprehensive income
Other financial assets
Shares and investments in capital 5,914 146 3,656 9,717
Total 5,914 2,189 10,196 18,300
Liabilities:
Financial liabilities measured at fair value through profit or loss
Other financial liabilities
Derivatives — 88 — 88
Total — 88 — 88
2022/12
Thousands of U.S. dollars
Level 1 Level 2 Level 3 Total
Assets:
Financial assets measured at fair value through profit or loss
Other financial assets
Derivatives — 15,491 — 15,491
Others — — 49,591 49,591
Financial assets measured at fair value through other comprehensive income
Other financial assets
Shares and investments in capital 44,844 1,107 27,722 73,681
Total 44,844 16,598 77,313 138,763
Liabilities:
Financial liabilities measured at fair value through profit or loss
Other financial liabilities
Derivatives — 667 — 667
Total — 667 — 667
No transfer was made between level 1 and level 2 of the fair value hierarchy during each fiscal year.
iv. Information on fair value measurement of financial instruments categorized as level 3
Financial instruments categorized as level 3 mainly consist of unlisted shares and investments in capital, and their fair value is measured primarily
using the DCF method.
The fair value of financial instruments categorized as level 3 is measured in accordance with the group accounting policy and accounting
guidelines using valuation techniques that appropriately reflect the nature, characteristics, and risk of the financial instruments, as well as using
cash flows and other inputs. The valuation and the analysis of the valuation results are performed by the members in charge in the responsible
department. The valuation results are reviewed and approved by the head of the responsible department.
For financial instruments categorized as level 3, no significant change in their fair value is expected when changing any of the unobservable
inputs to reflect reasonably possible alternative assumptions.
010_0252087912303.indd 73010_0252087912303.indd 73 2023/04/12 20:09:412023/04/12 20:09:41
74
Shiseido | Integrated Report 2023
v. Reconciliation of financial instruments categorized as level 3
Changes in the balances of financial instruments categorized as level 3 from the beginning to the end of each fiscal year are as follows:
Millions of yen Thousands of U.S. dollars
2021/12 2022/12 2022/12
Financial assets
measured at fair value
through other
comprehensive
income
Financial assets
measured at fair value
through profit or loss
Financial assets
measured at fair value
through other
comprehensive
income
Financial assets
measured at fair value
through profit or loss
Financial assets
measured at fair value
through other
comprehensive
income
Financial assets
measured at fair value
through profit or loss
Beginning balance 3,847 2,963 3,712 3,250 28,147 24,644
Total gains and losses
Profit or loss (Note 1) — 126 — 120 — 910
Other comprehensive income (Note 2) 148 — (241) — (1,827) —
Purchase — 38 169 1,696 1,281 12,860
Sale (292) (10) — (1,182) — (8,963)
Others 7 132 16 2,654 121 20,124
Ending balance 3,712 3,250 3,656 6,540 27,722 49,591
Notes: 1. The amounts of profit or loss are included in “Finance income” and “Finance costs” in the consolidated statement of profit and loss. Amounts attributable to changes in unrealized gains or
losses related to financial assets measured at fair value through profit or loss held as of December 31, 2021 and 2022 were ¥126 million and ¥120 million ($910 thousand), respectively.
2. The amounts of other comprehensive income are included in “Financial assets measured at fair value through other comprehensive income” in the consolidated statement of comprehen-
sive income.
(4) Hedge accounting
i. Risk management policy
The Group enters into derivatives for the following purposes: (i) foreign exchange forward contracts and foreign currency options to hedge the risk
of foreign exchange fluctuations of foreign currency-denominated receivables and payables, and foreign currency-denominated receivables and
payables that are certainly expected to arise from forecast transactions; (ii) interest rate swap contracts to hedge the risk of interest rate fluctua-
tions associated with borrowings; and (iii) interest rate and currency swap contracts to hedge the risk of foreign exchange fluctuations and the risk
of interest rate fluctuations associated with foreign currency-denominated borrowings. Of these derivatives, the Group designates interest rate
swap contracts that qualify for hedge accounting as cash flow hedges and applies hedge accounting.
In applying hedge accounting, the same notional amount, term (maturity), and underlying interest rates are set for the hedging instrument and
the hedged item, in principle, to maintain the effectiveness of the hedging relationship throughout the hedge period. The Group sets an appropri-
ate hedge ratio based on the relationship between the hedging instrument and the hedged item, which is generally one-to-one.
ii. Information on items designated as hedging instruments
Amounts of items designated as hedging instruments are as follows. The maximum period over which the cash flow fluctuations will be hedged is
one year.
IFRS transition date
Millions of yen
(January 1, 2021)
Carrying amount
Notional amount
Of which, due after
one year
Assets Liabilities
Weighted average
interest rate (fixed)
Line item in the consolidated
statement of financial position
Interest rate risk
Interest rate swap contracts 17,375 16,645 — 344 1.155%
Other financial liabilities
(non-current)
Millions of yen
2021/12
Carrying amount
Notional amount
Of which, due after
one year
Assets Liabilities
Weighted average
interest rate (fixed)
Line item in the consolidated
statement of financial position
Interest rate risk
Interest rate swap contracts 16,645 15,915 — 201 1.155%
Other financial liabilities
(non-current)
010_0252087912303.indd 74010_0252087912303.indd 74 2023/04/12 20:09:412023/04/12 20:09:41
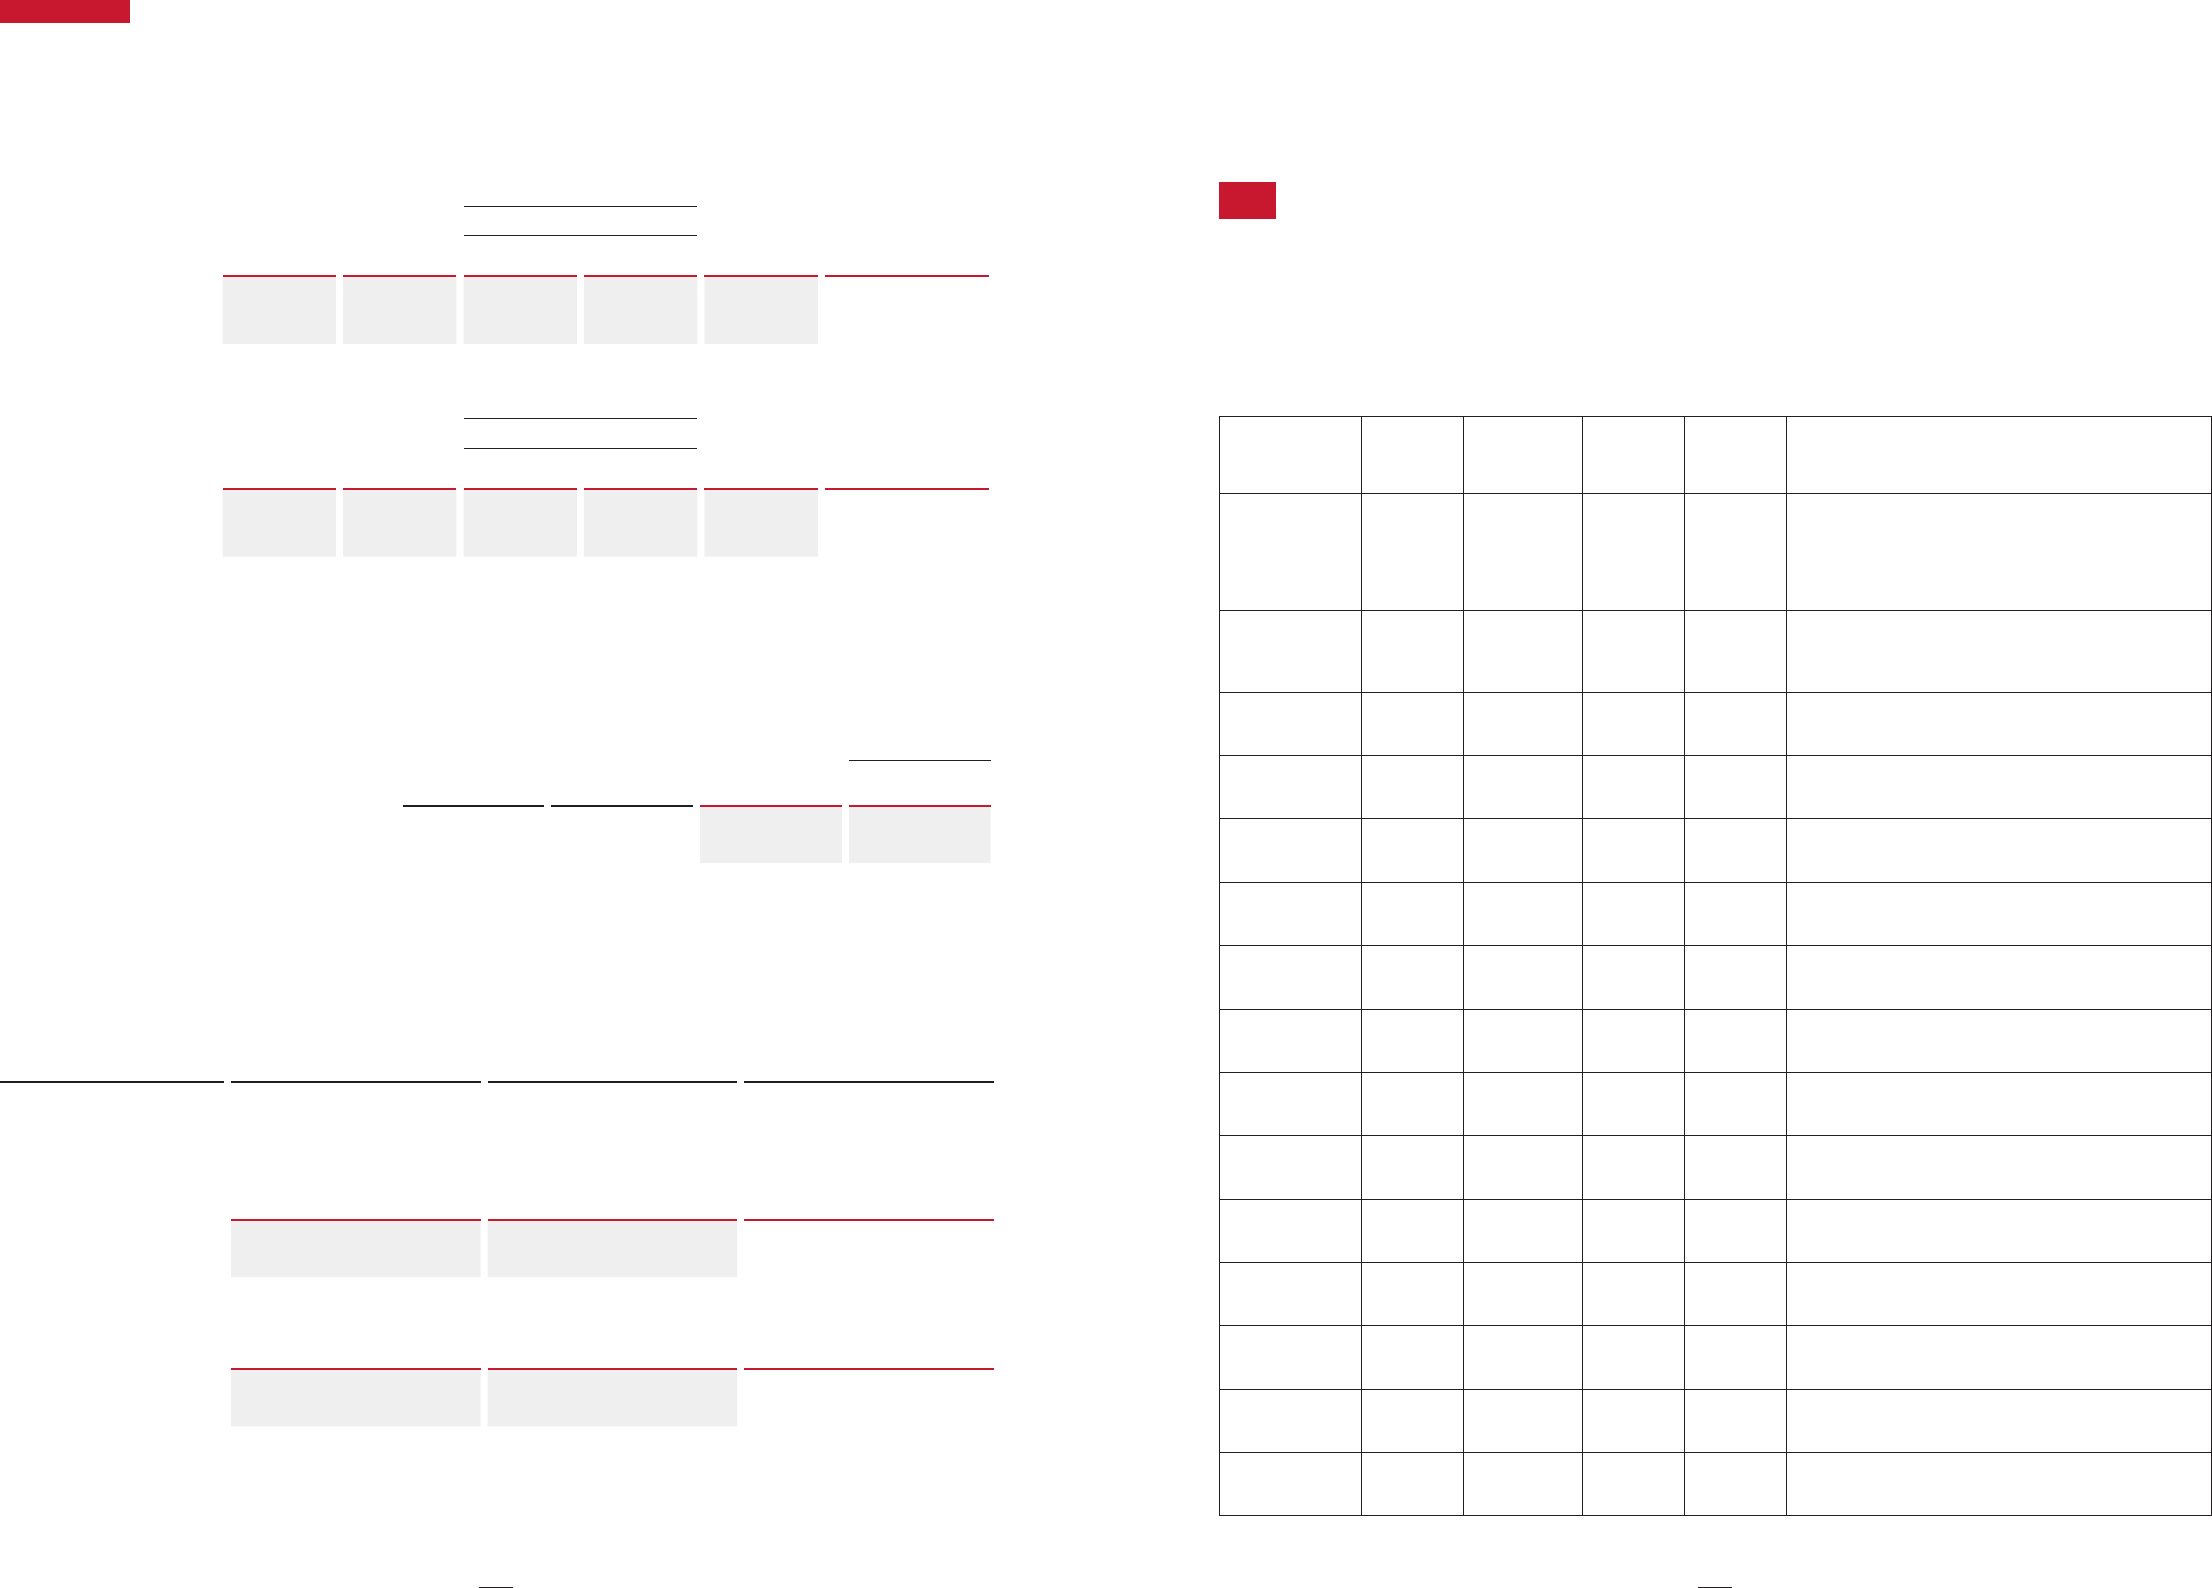
75
CORPORATE DATA
Millions of yen
2022/12
Carrying amount
Notional amount
Of which, due after
one year
Assets Liabilities
Weighted average
interest rate (fixed)
Line item in the consolidated
statement of financial position
Interest rate risk
Interest rate swap contracts 15,915 — — 62 1.155%
Other financial liabilities
(current)
Thousands of U.S. dollars
2022/12
Carrying amount
Notional amount
Of which, due after
one year
Assets Liabilities
Weighted average
interest rate (fixed)
Line item in the consolidated
statement of financial position
Interest rate risk
Interest rate swap contracts 120,678 — — 470 1.155%
Other financial liabilities
(current)
iii. Information on items designated as hedged items
For items designated as hedged items, the balance of cash flow hedge reserve for continuing hedges is as follows.
There was no cash flow hedge reserve arising from hedge relationships for which hedge accounting was discontinued. As the amount of the
ineffective portion of hedges recognized in profit or loss was immaterial, the disclosure of changes in fair value is omitted for the hedging instru-
ments and hedged items used as a basis for recognizing the ineffective portion.
Millions of yen Thousands of U.S. dollars
IFRS transition date
(January 1, 2021)
2021/12 2022/12 2022/12
Interest rate risk
Interest rate swap contracts (237) (139) (43) (326)
iv. Impact of the application of hedge accounting on the consolidated statement of profit and loss and the consolidated statement of comprehensive
income
The impact of the application of hedge accounting on the consolidated statement of profit and loss and the consolidated statement of other
comprehensive income (before tax effect) is as follows:
2021/12
Millions of yen
Hedging gains or losses recognized in other
comprehensive income
Amount reclassified from cash flow hedge
reserve into profit or loss
Line item in profit or loss affected by
reclassification
Interest rate risk
Interest rate swap contracts (61) 204 Finance costs
2022/12
Millions of yen
Hedging gains or losses recognized in other
comprehensive income
Amount reclassified from cash flow hedge
reserve into profit or loss
Line item in profit or loss affected by
reclassification
Interest rate risk
Interest rate swap contracts (52) 191 Finance costs
2022/12
Thousands of U.S. dollars
Hedging gains or losses recognized in other
comprehensive income
Amount reclassified from cash flow hedge
reserve into profit or loss
Line item in profit or loss affected by
reclassification
Interest rate risk
Interest rate swap contracts (394) 1,448 Finance costs
010_0252087912303.indd 75010_0252087912303.indd 75 2023/04/12 20:09:412023/04/12 20:09:41
76
Shiseido | Integrated Report 2023
36.
Major Subsidiaries
(1) Major subsidiaries
The status of major subsidiaries as of December 31, 2022 is as stated below.
Compared from the previous fiscal year, the number of subsidiaries increased by five and decreased by three.
Subsidiaries and Associates
i. Consolidated subsidiaries
Company name Address
Share capital or
investments in
capital
(Thousands of yen)
Main line of
business
Ownership
percentage of
voting rights (%)
Description of relationship
Shiseido Japan
Co., Ltd.
Chuo-ku,
Tokyo
100,000
Japan
Business
100.0
Purchaser of cosmetics, etc.
Leasing of buildings and equipment owned by the Company
Leasing out of buildings, land, and equipment to the
Company
Interlocking directorates: Yes; Secondment and concurrent
employment of employees: Yes
Shiseido Beauty
Salon Co., Ltd.
Chuo-ku,
Tokyo
100,000
Japan
Business
100.0
Business transactions: No; Leasing of buildings and
equipment owned by the Company
Interlocking directorates: No; Secondment and concurrent
employment of employees: Yes
Shiseido
Pharmaceutical
Co., Ltd.
Chuo-ku,
Tokyo
100,000
Japan
Business
100.0
Purchaser of pharmaceutical products
Interlocking directorates: No; Secondment and concurrent
employment of employees: Yes
Ettusais Co., Ltd.
Chuo-ku,
Tokyo
100,000
Japan
Business
100.0
Business transactions: No
Interlocking directorates: Yes; Secondment and concurrent
employment of employees: Yes
Shiseido FITIT Co.,
Ltd.
Chuo-ku,
Tokyo
10,000
Japan
Business
100.0
Purchaser of cosmetics, etc.
Interlocking directorates: Yes; Secondment and concurrent
employment of employees: Yes
Shiseido
International Inc.
Chuo-ku,
Tokyo
30,000
Japan
Business
100.0
Purchaser of cosmetics, etc.
Interlocking directorates: No; Secondment and concurrent
employment of employees: Yes
Shiseido China Co.,
Ltd.
Shanghai,
China
CNY565,093
thousand
China
Business
100.0
Purchaser of cosmetics, etc.
Interlocking directorates: Yes; Secondment and concurrent
employment of employees: Yes
Shiseido Liyuan
Cosmetics Co., Ltd.
Beijing,
China
CNY94,300
thousand
China
Business
65.0
(32.9)
Purchaser of raw materials
Interlocking directorates: Yes; Secondment and concurrent
employment of employees: Yes
Shiseido Hong
Kong Ltd.
Hong Kong,
China
HKD123,000
thousand
China
Business
100.0
Purchaser of cosmetics, etc.
Interlocking directorates: Yes; Secondment and concurrent
employment of employees: No
Shiseido Asia
Pacific Pte. Ltd.
Singapore
SGD49,713
thousand
Asia Pacific
Business
100.0
Purchaser of cosmetics, etc.
Interlocking directorates: No; Secondment and concurrent
employment of employees: Yes
Shiseido Thailand
Co., Ltd. (Note 2)
Bangkok,
Thailand
THB10,000
thousand
Asia Pacific
Business
49.0
Purchaser of cosmetics, etc.
Interlocking directorates: No; Secondment and concurrent
employment of employees: No
FLELIS
International Inc.
Taipei,
Taiwan
TWD246,460
thousand
Asia Pacific
Business
100.0
(100.0)
Purchaser of cosmetics, etc.
Interlocking directorates: Yes; Secondment and concurrent
employment of employees: No
Shiseido Korea Co.,
Ltd.
Seoul, Korea
KRW 61,698
million
Asia Pacific
Business
100.0
(100.0)
Purchaser of cosmetics, etc.
Interlocking directorates: Yes; Secondment and concurrent
employment of employees: Yes
Taiwan Shiseido
Co., Ltd.
Taoyuan,
Taiwan
TWD1,154,588
thousand
Asia Pacific
Business
51.0
Purchaser of cosmetics, etc.
Interlocking directorates: Yes; Secondment and concurrent
employment of employees: Yes
Shiseido Americas
Corporation
Delaware,
United States
USD403,070
thousand
Americas
Business
100.0
Purchaser and supplier of cosmetics, etc.
Interlocking directorates: Yes; Secondment and concurrent
employment of employees: Yes
010_0252087912303.indd 76010_0252087912303.indd 76 2023/04/12 20:09:412023/04/12 20:09:41

77
CORPORATE DATA
Company name Address
Share capital or
investments in
capital
(Thousands of yen)
Main line of
business
Ownership
percentage of
voting rights (%)
Description of relationship
Shiseido Canada
Inc.
Ontario,
Canada
CAD9,561
thousand
Americas
Business
100.0
(100.0)
Purchaser of cosmetics, etc.
Interlocking directorates: No; Secondment and concurrent
employment of employees: No
Shiseido America,
Inc.
New York,
United States
USD28,000
thousand
Americas
Business
100.0
(100.0)
Supplier of cosmetics, etc. and purchaser of raw materials
Interlocking directorates: No; Secondment and concurrent
employment of employees: No
Shiseido Europe
S.A.
Paris, France
EUR257,032
thousand
EMEA
Business
100.0
Business transactions: No
Interlocking directorates: Yes; Secondment and concurrent
employment of employees: No
Shiseido
International
France S.A.S.
Paris, France
EUR36,295
thousand
EMEA
Business
100.0
(100.0)
Supplier of cosmetics, etc. and purchaser of raw materials
Interlocking directorates: No; Secondment and concurrent
employment of employees: Yes
Shiseido (RUS),
LLC.
Moscow,
Russia
RUB106,200
thousand
EMEA
Business
100.0
(100.0)
Business transactions: No
Interlocking directorates: No; Secondment and concurrent
employment of employees: No
Shiseido Italy
S.p.A.
Milan, Italy
EUR5,036
thousand
EMEA
Business
100.0
(100.0)
Business transactions: No
Interlocking directorates: No; Secondment and concurrent
employment of employees: No
Shiseido Germany
GmbH
Düsseldorf,
Germany
EUR8,700
thousand
EMEA
Business
100.0
(100.0)
Business transactions: No
Interlocking directorates: No; Secondment and concurrent
employment of employees: No
Beauté Prestige
International S.A.S.
Paris, France
EUR32,937
thousand
EMEA
Business
100.0
(100.0)
Purchaser of cosmetics, etc.
Interlocking directorates: No; Secondment and concurrent
employment of employees: Yes
Shiseido Spain
S.A.U.
Madrid,
Spain
EUR998
thousand
EMEA
Business
100.0
(100.0)
Business transactions: No
Interlocking directorates: No; Secondment and concurrent
employment of employees: No
Shiseido UK
Limited
London,
United
Kingdom
GBP105
thousand
EMEA
Business
100.0
(100.0)
Business transactions: No
Interlocking directorates: No; Secondment and concurrent
employment of employees: No
Shiseido Travel
Retail Asia Pacific
Pte. Ltd.
Singapore
USD48
thousand
Travel Retail
Business
100.0
(100.0)
Purchaser of cosmetics, etc.
Interlocking directorates: No; Secondment and concurrent
employment of employees: Yes
IPSA Co., Ltd.
Minato-ku,
Tokyo
100,000 Others 100.0
Purchaser of cosmetics, etc.; Leasing of buildings owned by
the Company
Interlocking directorates: Yes; Secondment and concurrent
employment of employees: Yes
Shiseido Parlour
Co., Ltd.
Chuo-ku,
Tokyo
100,000 Others 99.3
Outsourced contractor for operations of directly-managed
restaurants
Leasing of buildings and equipment owned by the Company
Leasing out of buildings to the Company
Interlocking directorates: Yes; Secondment and concurrent
employment of employees: Yes
THE GINZA Co.,
Ltd.
Chuo-ku,
Tokyo
100,000 Others 98.1
Purchaser and supplier of cosmetics, etc.
Interlocking directorates: Yes; Secondment and concurrent
employment of employees: Yes
Selan Anonymous
Association (Note
2)
(Business
operator)
Chiyoda-ku,
Tokyo
11,600,000 Others
—
[100.0]
Business transactions: No; Leasing out of a building and
equipment of SHIODOME TOWER (Shiodome Office) to the
Company
Interlocking directorates: No; Secondment and concurrent
employment of employees: No
Shiseido Cosmetics
Manufacturing Co.,
Ltd.
Shanghai,
China
CNY418,271
thousand
Others
92.6
(66.3)
Purchaser of raw materials
Interlocking directorates: Yes; Secondment and concurrent
employment of employees: Yes
Shiseido Vietnam
Inc.
Dong Nai,
Vietnam
VND1,061,993
million
Others 100.0
Supplier of cosmetics, etc. and purchaser of raw materials
Interlocking directorates: Yes; Secondment and concurrent
employment of employees: Yes
42 other
companies
— — — — —
Notes: 1. Segment names are presented in the “Main line of business” column.
2. Although the Company’s equity interest in each of these companies is 50% or less, they are considered to be consolidated subsidiaries because they are effectively controlled by the
Company.
3. The figures in parentheses ( ) presented under “Ownership percentage of voting rights” indicate the percentage of indirect ownership, while the figures in brackets [ ], which are stated for
reference, refer to the percentage of ownership of persons with whom the Company has a close relationship or who have agreed to exercise the same voting rights as the Company.
010_0252087912303.indd 77010_0252087912303.indd 77 2023/04/12 20:09:412023/04/12 20:09:41
78
Shiseido | Integrated Report 2023
ii. Associates accounted for using equity method
Company name Address
Share capital or
investments in
capital
(Thousands of yen)
Main line of
business
Ownership
percentage of
voting rights (%)
Description of relationship
Pierre Fabre Japon
Co., Ltd.
Minato-ku,
Tokyo
100,000
Japan
Business
50.0
Supplier of cosmetics, etc.
Interlocking directorates: Yes; Secondment and concurrent
employment of employees: Yes
FineToday
Holdings Co., Ltd.
(Note 2)
Chiyoda-ku,
Tokyo
10 Others 35.0
Entrusted with manufacturing and distribution of personal
care products
Interlocking directorates: Yes; Secondment and concurrent
employment of employees: No
14 other
companies
— — — — —
Notes: 1. Segment names are presented in the “Main line of business” column.
2. FineToday Holdings Co., Ltd. has changed its name from K.K. Asian Personal Care Holding.
(2) Gain or loss associated with loss of control of subsidiaries
For the fiscal year 2021
i. Overview of loss of control
The Transfer of the Personal Care business
On July 1, 2021, the Personal Care business (the “Business”)was succeeded by Fine Today Shiseido Co., Ltd. (the “New FTS”) through a compa-
ny split from the Company and its subsidiaries in Japan (Shiseido Japan Co., Ltd. (“SJ”) and FT Shiseido Co., Ltd.), and all of the outstanding
shares of the New FTS were transferred to Oriental Beauty Holding Co., Ltd. (“OBH”). Additionally, on July 1, 2021, the Company acquired 35%
of the shares of K.K. Asian Personal Care Holding, the wholly owning parent company of OBH, through a contribution in kind. As of October 1,
2021, a merger was carried out with OBH as the surviving company and the New FTS as the disappearing company, and the trade name of OBH
after the merger was changed to FineToday Shiseido Co., Ltd. (currently known as “FineToday Co., Ltd.” effective January 1, 2023).
In addition, on July 1, 2021, two of the Company’s Chinese subsidiaries, Shiseido China Co., Ltd. and Shiseido Cosmetics Manufacturing Co.,
Ltd., and on September 1, 2021, one of its Chinese subsidiaries, Shiseido Hong Kong Ltd., and two Asia Pacific subsidiaries, Shiseido Singapore
Co., (Pte.) Ltd. and Shiseido Korea Co., Ltd., transferred their assets of the Business to affiliates of OBH.
In addition to the above transactions, the total consideration for the transfer of shares and assets, adjusted for the decrease in net working capital,
etc., is ¥143,153 million. Furthermore, this adjustment did not have any impact on gain on sale of business recorded in the previous fiscal year.
Excluding the above noted subsidiaries, seven of the Company’s subsidiaries that operate the Business in Asia Pacific (Taiwan Shiseido Co.,
Ltd. (“TS”), FLELIS International Inc. (“FI”), Shiseido Thailand Co., Ltd., Shiseido Malaysia Sdn. Bhd., Shiseido Philippines Corporation, PT. Shise-
ido Cosmetics Indonesia, and Shiseido Cosmetics Vietnam Co., Ltd.) transfer their assets of the Business in 2022 and thereafter.
All operations of the company split, share transfer, asset transfer and contribution in kind of share purchase are pursuant to the Purchase
Agreement between the Company and OBH.
The following section details the company split and share transfer of the Business in Japan executed in the fiscal year 2021 and asset transfer
related to the Business of three Chinese subsidiaries and two Asia Pacific subsidiaries.
ii. Breakdown of assets and liabilities at the time of loss of control
Millions of yen
Breakdown of assets at the time of loss of control
Current assets 22,283
Non-current assets 577
Breakdown of liabilities at the time of loss of control
Current liabilities 11,463
Non-current liabilities 590
iii. Relationship between consideration received and income and expenditure due to sale
Millions of yen
Consideration received by cash 125,698
Cash and cash equivalents of assets at the time of loss of control —
Income from the sale of the business 125,698
010_0252087912303.indd 78010_0252087912303.indd 78 2023/04/12 20:09:412023/04/12 20:09:41

79
CORPORATE DATA
iv. Gain or loss associated with loss of control
Out of the gain on sale of business of ¥132,019 million, ¥17,018 million was caused by measuring retained investment in the former subsidiary at
fair value as of the date of loss of control. These amounts are included in “Other operating income” in the consolidated statement of profit and
loss.
Transfer of Prestige Makeup Brands bareMinerals, BUXOM, and Laura Mercier
i. Overview of loss of control
Related to the prestige makeup brands (bareMinerals, BUXOM and Laura Mercier), the Company announced that Shiseido Americas Corporation,
the Company’s regional headquarters for the Americas and its subsidiary (registered in Delaware, United States; “SAC”) transferred the related as-
sets (including all of the shares of Bare Escentuals K.K. (Japan), a SAC’s subsidiary and the operating company of bareMinerals in Japan) to AI
Beauty holdings Ltd. owned by independent private equity partnership Advent International Corporation (registered in Massachusetts, United
States; “Advent”) on December 6, 2021.
Under its medium-to-long-term business strategy “WIN 2023 and Beyond,” the Shiseido Group is shifting to a new business structure, with skin
beauty positioned as its core category. To that end, we have launched a fundamental business transformation and aim to become a global leader
in skin beauty by 2030. Amid an extremely volatile business environment, mostly impacted by the spread of COVID-19, during three years from
2021 to 2023, we are focusing on profitability and cash-flow management, in order to solidify the business foundation required for a global Skin
Beauty Company.
Under this strategy, as we are taking steps to give order of priority to brands, optimize our portfolio, and strengthen our competitive advantages
under this strategy, we have decided to transfer the business of three of the Company’s makeup brands—bareMinerals and BUXOM, acquired in
2010, and Laura Mercier, acquired in 2016—to an external party, with consideration of the employees as the highest priority.
The transfer price of the assets related to the brands shall be 700 million US dollars (¥80,577 million), of which 350 million US dollars
(¥40,288 million) shall be paid in cash upon closing, and the remainder as deferred payment in the form of a seller note* payable on the seventh
anniversary of the closing. Relating to the above asset transfer, the Company shall also contribute 118 million US dollars (¥13,582 million) to the
transferee, AI Beauty Holdings Ltd., mainly as working capital adjustments and initial funds.
*A type of debt financing in which the seller partially extends credit to the buyer
ii. Breakdown of assets and liabilities at the time of loss of control
Millions of yen
Breakdown of assets at the time of loss of control
Current assets 11,875
Non-current assets 53,419
Breakdown of liabilities at the time of loss of control
Current liabilities 1,114
Non-current liabilities 848
iii. Relationship between consideration received and income and expenditure due to sale
Millions of yen
Consideration received by cash 40,288
Working capital contributions resulting from transfer of business (13,582)
Foreign currency translation difference (1,194)
Cash and cash equivalents of assets at the time of loss of control (1,272)
Income from sale of business 24,238
iv. Gain or loss associated with loss of control
Gain on transfer of business associated with loss of control was ¥1,824 million, and the amount is included in “Other operating income” in the
consolidated statement of profit and loss.
010_0252087912303.indd 79010_0252087912303.indd 79 2023/04/12 20:09:412023/04/12 20:09:41
80
Shiseido | Integrated Report 2023
For the fiscal year 2022
Company split in the Professional business, and share transfer and asset transfer of the successor company
(1) Overview of loss of control
On July 1, 2022, the Professional business (the “Business”) was succeeded by Shiseido Professional Inc. (“SPI”) through an absorption-type
company split, followed by a transfer of 80% of its shares to Henkel Nederland B.V. (“HNBV”), a subsidiary of Henkel AG & Co. KGaA (“Hen-
kel”), and all of the outstanding shares of Shiseido Professional (Thailand) Co., Ltd. were transferred to Henkel Group Company. In addition, two
of the Company’s Chinese subsidiaries, Shiseido China Co., Ltd. and Shiseido Hong Kong Ltd., and two Asia Pacific subsidiaries, Shiseido Singa-
pore Co., (Pte.) Ltd. and Shiseido Korea Co., Ltd., transferred their assets of the Business to Henkel Group companies.
Excluding the above noted subsidiaries, two of the Company’s subsidiaries that operate the Business in Asia Pacific (FLELIS International Inc.
and Shiseido Malaysia Sdn. Bhd.) received consideration for the transfer in December 2022, and transferred their assets of the Business on Jan-
uary 1, 2023.
In addition to the above transaction, the total amount of consideration for transfer of equity and assets after adjustment for net decrease in op-
erating capital, etc. was ¥11,884 million ($ 90,112 thousand). Furthermore, this adjustment did not have any impact on gain on sale of business
recorded for the current fiscal year.
All operations of the company split, share transfer, asset transfer and contribution in kind of share purchase are pursuant to the Purchase
Agreement between the Company and Henkel on February 9, 2022.
The following section details the transfer of the Business executed in 2022.
(2) Breakdown of assets and liabilities at the time of loss of control
Millions of yen
Thousands of
U.S. dollars
Breakdown of assets at the time of loss of control
Current assets 5,910 44,813
Non-current assets 1,155 8,758
Breakdown of liabilities at the time of loss of control
Current liabilities 3,414 25,887
Non-current liabilities 1,057 8,015
(3) Relationship between consideration received and income and expenditure due to sale
Millions of yen
Thousands of
U.S. dollars
Consideration received by cash 12,121 91,909
Cash and cash equivalents of assets at the time of loss of control 3,020 22,900
Income from sale of business 9,101 69,010
(4) Gain or loss associated with loss of control
Out of the gain on transfer of business of ¥10,901 million ($ 82,658 thousand), ¥2,060 million ($ 15,620 thousand) was caused by measuring
retained investment in the former subsidiary at fair value as of the date of loss of control. These amounts are included in “Other operating in-
come” in the consolidated statement of profit and loss.
010_0252087912303.indd 80010_0252087912303.indd 80 2023/04/12 20:09:412023/04/12 20:09:41

81
CORPORATE DATA
37.
Related Parties
(1) Related party transactions
For the fiscal year 2021
Not applicable.
For the fiscal year 2022
Type of
relationship
Name Description of transaction
Transaction
amount
(Millions of yen)
Outstanding
balance
(Millions of yen)
Transaction
amount
(thousands of
U.S. dollars)
Outstanding
balance
(Thousands of
U.S. dollars)
Officer Masahiko Uotani
Exercise of stock acquisition rights
(stock options)
37 — 281 —
(2) Key management personnel compensation
Compensation paid to key management personnel is as follows:
Millions of yen Thousands of U.S. dollars
2021/12 2022/12 2022/12
Short-term employee benefits 1,799 1,996 15,135
Post-retirement benefits 53 51 387
Share-based payments 444 694 5,262
Others 99 20 152
Total 2,398 2,763 20,951
38.
Commitments
39.
Contingent Liabilities
40.
Significant Subsequent Events
Commitments related to expenditures after the balance sheet date are as follows:
Millions of yen Thousands of U.S. dollars
IFRS transition date
(January 1, 2021)
2021/12 2022/12 2022/12
Purchase of property, plant and equipment 16,391 1,663 1,133 8,591
Purchase of intangible assets (Note) 718 32,166 25,016 189,688
Total 17,110 33,829 26,149 198,279
In addition to the above, the amount of contracted lease transactions that had not commenced as of December 31, 2022 was ¥451 million ($3,420
thousand). Since the lease term for this contract has not commenced, no right-of-use assets or lease liabilities has been recorded.
Note: The Group has concluded a blanket contract for system development, and operation and maintenance services, for which the total contract amount has already been determined, but since the
amount of consideration for part of the contract has yet to be determined, the amounts shown above refer to the contract balance.
Accordingly, the above amounts include the amounts to be expensed in future periods.
Not applicable.
(A dispute from a business partner regarding the agreement)
In February 2023, European subsidiary of the Company has received a dispute from a business partner regarding performance of the services stipu-
lated in the agreement with the business partner. The Group is currently assessing the alleged claim. As the Group is in the process of gathering evi-
dences, given the legal ground and the nature of the claim is unclear and it takes certain time to investigate the alleged claim, the Group is unable to
reasonably estimate the amount of payment, and has not recorded any liability related to this claim.
010_0252087912303.indd 81010_0252087912303.indd 81 2023/04/12 20:09:412023/04/12 20:09:41
82
Shiseido | Integrated Report 2023
(Company split and share transfer of succeeding company accompanying the transfer of the manufacturing operations of personal care products)
On April 1, 2023, the manufacturing operations of personal care products conducted by the Company at the Kuki Factory (the “Business”) were
succeeded by FineToday Industries (“FTI”) through an absorption-type company split, followed by a transfer of all of the outstanding shares of FTI to
FineToday Holdings Co., Ltd. (“FTH”), a subsidiary of Oriental Beauty Holding (HK) Limited (“OBHHK”), directly or indirectly financed by funds ad-
vised by CVC Capital Partners (“CVC”).
The amount of assets and liabilities, as well as profit and loss incurred during the fiscal year 2023 are under evaluation.
This company split and share transfer of succeeding company were executed based on the transfer agreement between the Company and CVC
signed on August 1, 2022.
Subsequently, based on said agreement, all of the equity interest of the Company in its wholly owned subsidiary Shiseido Vietnam Inc., which op-
erates the Vietnam Factory, will be transferred to FTH during the fiscal year 2023.
In addition, on March 31, 2023, the Company transferred a portion of its shares to OBHHK and reduced its shareholding ratio to 20.7%. The
Company’s shareholding ratio after the capital increase of OBHHK, which took place on the same date, is 20.1%.
010_0252087912303.indd 82010_0252087912303.indd 82 2023/04/12 20:09:412023/04/12 20:09:41

83
CORPORATE DATA
41.
First-time adoption of IFRS
The Group disclosed its consolidated financial statements in accordance with IFRS from the fiscal year ended December 31, 2022. The most recent
consolidated financial statements prepared in accordance with Generally Accepted Accounting Principles in Japan (“Japanese GAAP”) are those for
the fiscal year ended December 31, 2021, and the date of transition to IFRS (hereinafter the “transition date”) is January 1, 2021.
(1) Exemption in IFRS 1
In principle, IFRS requires that companies adopting IFRS for the first time (hereinafter, “First-time Adopter”) apply the standards required under
IFRS retrospectively. However, for some of the standards required under IFRS, IFRS 1 First-Time Adoption of International Financial Reporting
Standards (hereinafter, “IFRS 1”) specifies standards for which the exemption is applied mandatorily and those for which the exemption is ap-
plied voluntarily. The impact based on the application of these exemptions is adjusted in retained earnings and other components of equity at the
transition date. The exemptions that the Group applies in connection with the transition from Japanese GAAP to IFRS are as follows:
• Business combinations
IFRS 1 permits a First-time Adopter to elect not to apply IFRS 3 Business Combinations (hereinafter, “IFRS 3”) retrospectively to business com-
binations that occurred before the date of transition to IFRS. The Group elected to apply this exemption and not to apply IFRS 3 retrospectively
to the business combinations that occurred before the transition date. Accordingly, goodwill arising in business combinations that occurred be-
fore the transition date was recorded at the carrying amount under Japanese GAAP at the transition date.
Goodwill is tested for impairment at the transition date, regardless of whether there is an indication of impairment.
• Exchange differences on translation of foreign operations
IFRS 1 permits a First-time Adopter to elect to deem the cumulative translation differences for all foreign operations to be zero at the date of
transition to IFRS. The Group elected to deem the cumulative translation differences of all foreign operations to be zero at the transition date.
• Share-based payments
A First-time Adopter is encouraged, but not required, to apply IFRS 2 Share-based Payment (hereinafter, “IFRS 2”) to equity instruments that
were granted after November 7, 2002 and vested before the date of transition to IFRS. The Group elected not to apply IFRS 2 to share-based
payments vested before the transition date.
• Leases
IFRS 1 permits a First-time Adopter to assess whether a contract contains a lease on the basis of facts and circumstances existing at the transi-
tion date. In addition, IFRS 1 permits a First-time Adopter to measure a lease liability at the present value of the remaining lease payments, dis-
counted using the lessee’s incremental borrowing rate at the date of transition to IFRS, and to measure a right-of-use asset, on a lease-by-lease
basis, at either: its carrying amount as if IFRS 16 Lease had been applied since the commencement date of the lease, but using the lessee’s
incremental borrowing rate at the transition date as discounted rate; or an amount equal to the lease liability.
Furthermore, IFRS 1 permits a First-time Adopter, as practical expedients, to recognize a lease for which the lease term ends within 12
months of the date of transition to IFRS or for which the underlying asset is of low value as an expense.
The Group applies these exemptions and practical expedients, and recognize and measure leases.
• Decommissioning liabilities included in the cost of property, plant and equipment
With respect to the measurement of liabilities associated with decommissioning, etc. (hereinafter “decommissioning liabilities”) which are in-
cluded in the cost of property, plant and equipment, IFRS 1 permits to choose either a method in which decommissioning liabilities are mea-
sured retroactively from the point in time when such liabilities first arose, or a method in which decommissioning liabilities are measured at the
transition date. The Group elected for the former in measuring decommissioning liabilities which are included in the cost of property, plant and
equipment.
• Borrowing costs
IFRS 1 permits to begin capitalizing borrowing costs relating to qualifying assets on the date of transition to IFRS. The Group capitalizes borrow-
ing costs relating to qualifying assets for which the commencement date for capitalization is on or after the transition date.
• Designation of financial instruments recognized before the transition date
IFRS 1 permits an entity to assess the classification under IFRS 9 Financial Instruments (hereinafter, “IFRS 9”) on the basis of the facts and
circumstances that exist at the transition date rather than those that exist at initial recognition. IFRS 1 also permits an entity to designate chang-
es in the fair value of an equity instruments as financial assets measured through other comprehensive income on the basis of the facts and
circumstances that exist at the transition date.
The Group assesses the classification under IFRS 9 on the basis of the facts and circumstances that exist at the transition date and desig-
nates investments to all equity instruments, which are not held for sale, as financial assets measured at fair value through other comprehensive
income.
010_0252087912303.indd 83010_0252087912303.indd 83 2023/04/12 20:09:412023/04/12 20:09:41
84
Shiseido | Integrated Report 2023
(2) Mandatory exceptions under IFRS 1
IFRS 1 prohibits the retrospective application of IFRS concerning “estimates,” “derecognition of financial assets and financial liabilities,” “hedge ac-
counting,” “non-controlling interests,” “classification and measurement of financial instruments” and others. The Group prospectively applies these
items from the transition date.
(3) Reconciliations
The reconciliations required to be disclosed at the first-time adoption of IFRS are as follows.
In the reconciliations below, “Reclassification” includes items that do not affect retained earnings and comprehensive income, while “Differences
in recognition and measurement” include items that affect retained earnings and comprehensive income.
Reconciliations of equity as of transition date (January 1, 2021)
Line items under Japanese GAAP Japanese GAAP Reclassification
Differences in
recognition and
measurement IFRS Notes Line items under IFRSs
Millions of yen Millions of yen Millions of yen Millions of yen
Assets Assets
Current assets Current assets
Cash and time deposits 130,013 6,334 — 136,347 1, 4 Cash and cash equivalents
Notes and accounts receivable 144,728 1,041 738 146,507 2, 3 Trade and other receivables
Short-term investment securities 21,000 (5,170) — 15,829 1, 3, 4 Other financial assets
Inventories 170,031 276 (7,306) 163,001 17 Inventories
Other current assets 52,634 (6,241) (1,694) 44,698 2 Other current assets
Allowance for doubtful accounts (3,644) 3,644 — —3
Total current assets 514,763 (115) (8,262) 506,385 Total current assets
Fixed assets Non-current assets
Property, plant and equipment 341,044 (13,011) 1,444 329,478 6, 8, 18
Property, plant and
equipment
Goodwill 54,429 — — 54,429 Goodwill
Trademark rights 131,636 54,380 11,736 197,753 7, 19 Intangible assets
Other intangible assets 55,326 (55,047) (278) —
— 24,320 107,344 131,665 8, 19, 21 Right-of-use assets
— 2,230 (6) 2,224 9
Investments accounted for
using equity method
Investment securities 13,527 25,766 4,952 44,246 3, 4, 9, 28 Other financial assets
Long-term prepaid expenses 14,125 (14,125) — — 6, 10
Deferred tax assets 42,501 — 17,927 60,428 27 Deferred tax assets
Other investments 37,015 (23,485) (366) 13,163 4, 10 Other non-current assets
Allowance for doubtful accounts (140) 140 — —3
Total fixed assets 689,466 1,168 142,754 833,390 Total non-current assets
Total assets 1,204,229 1,053 134,492 1,339,775 Total assets
010_0252087912303.indd 84010_0252087912303.indd 84 2023/04/12 20:09:412023/04/12 20:09:41

85
CORPORATE DATA
Line items under Japanese GAAP Japanese GAAP Reclassification
Differences in
recognition and
measurement IFRS Notes Line items under IFRSs
Millions of yen Millions of yen Millions of yen Millions of yen
Liabilities and equity
Liabilities Liabilities
Current liabilities Current liabilities
Notes and accounts payable 21,187 164,863 (154) 185,896 11 Trade and other payables
Electronically recorded
obligations - operating
55,740 (55,740) — — 11
Short-term debt 56,491 10,730 — 67,221 12 Bonds and borrowings
Current portion of long-term
debt
10,730 (10,730) — — 12
Lease obligations 8,344 — 14,436 22,781 21 Lease liabilities
Other payables 75,695 (75,695) — — 11
Accrued income taxes 7,374 — — 7,374 Income taxes payable
Reserve for sales returns 6,227 (6,227) — — 11
Refund liabilities 10,518 (10,518) — — 11
Accrued bonuses for employees 15,024 (15,024) — — 15
Accrued bonuses for directors 165 (165) — — 15
Provision for liabilities and
charges
545 2,228 — 2,773 13 Provisions
Provision for loss on business
withdrawal
725 (725) — — 13
— 4,926 — 4,926 14 Other financial liabilities
Other current liabilities 84,208 (7,646) 13,855 90,417
13, 14, 15,
23, 24, 25
Other current liabilities
Total current liabilities 352,977 276 28,136 381,390 Total current liabilities
010_0252087912303.indd 85010_0252087912303.indd 85 2023/04/12 20:09:412023/04/12 20:09:41
86
Shiseido | Integrated Report 2023
Line items under Japanese GAAP Japanese GAAP Reclassification
Differences in
recognition and
measurement IFRS Notes Line items under IFRSs
Millions of yen Millions of yen Millions of yen Millions of yen
Long-Term Liabilities Non-current liabilities
Bonds 65,000 167,861 — 232,861 12 Bonds and borrowings
Long-term debt 167,861 (167,861) — — 12
Lease obligations 15,872 — 105,902 121,774 21 Lease liabilities
Long-term payables 52,968 824 253 54,046 14 Other financial liabilities
Liability for retirement benefits 27,189 777 21,935 49,902 26 Retirement benefit liability
Allowance for losses on
guarantees
350 (350) — — 14
— 1,679 — 1,679 13 Provisions
Deferred tax liabilities 2,944 — 1,007 3,951 27 Deferred tax liabilities
Other long-term liabilities 12,472 (2,153) (7,460) 2,858
13, 14,
25, 29
Other non-current liabilities
Total long-term liabilities 344,658 777 121,638 467,073 Total non-current liabilities
Total liabilities 697,635 1,053 149,775 848,464 Total liabilities
Net assets Equity
Common stock 64,506 — — 64,506 Share capital
Capital surplus 70,741 1,399 555 72,696 16, 29 Capital surplus
Treasury stock (2,455) — — (2,455) Treasury shares
Stock acquisition rights 1,399 (1,399) — — 16
Retained earnings 339,817 — (3,939) 335,878 31 Retained earnings
Total accumulated other
comprehensive income
11,678 — (11,916) (237) 26, 28, 30 Other components of equity
485,688 — (15,300) 470,388
Total equity attributable to
owners of parent
Non-controlling interests in
consolidated subsidiaries
20,905 — 17 20,922 Non-controlling interests
Total net assets 506,593 — (15,283) 491,310 Total equity
Total liabilities and net assets 1,204,229 1,053 134,492 1,339,775 Total liabilities and equity
010_0252087912303.indd 86010_0252087912303.indd 86 2023/04/12 20:09:412023/04/12 20:09:41

87
CORPORATE DATA
Reconciliations of equity as of December 31, 2021(Date of most recent consolidated financial statements based on Japanese GAAP)
Line items under Japanese GAAP Japanese GAAP Reclassification
Differences in
recognition and
measurement IFRS Notes Line items under IFRSs
Millions of yen Millions of yen Millions of yen Millions of yen
Assets Assets
Current assets Current assets
Cash and time deposits 172,056 (15,553) — 156,503 1, 4 Cash and cash equivalents
Notes and accounts receivable 151,115 6,237 1,439 158,791 2, 3 Trade and other receivables
Short-term investment securities — 16,429 — 16,429 1, 3, 4 Other financial assets
Inventories 143,758 (1,422) (8,188) 134,147 17 Inventories
Other current assets 58,636 (11,553) (1,965) 45,117 2 Other current assets
Allowance for doubtful accounts (4,032) 4,032 — —3
Total current assets 521,533 (1,829) (8,715) 510,989 Subtotal
— 1,933 — 1,933 5 Assets held for sale
521,533 104 (8,715) 512,922 Total current assets
Fixed assets Non-current assets
Property, plant and equipment 357,405 (19,156) 1,787 340,037 6, 8, 18
Property, plant and
equipment
Goodwill 44,159 — 6,269 50,429 19, 20 Goodwill
Trademark rights 40,322 61,458 33 101,814 7, 19 Intangible assets
Other intangible assets 62,007 (62,007) — —
— 29,013 98,818 127,832 8, 19, 21 Right-of-use assets
— 2,418 19,273 21,691 9, 22
Investments accounted for
using equity method
Investment securities 9,717 55,212 8,847 73,777 3, 4, 9, 28 Other financial assets
Long-term loans receivable 31,116 (31,116) — —4
Long-term prepaid expenses 12,367 (12,367) — — 6, 10
Deferred tax assets 72,968 — (5,534) 67,433 27 Deferred tax assets
Other investments 27,792 (22,636) (115) 5,040 4, 10 Other non-current assets
Allowance for doubtful accounts (30) 30 — —3
Total fixed assets 657,827 849 129,380 788,056 Total non-current assets
Total assets 1,179,360 953 120,664 1,300,979 Total assets
010_0252087912303.indd 87010_0252087912303.indd 87 2023/04/12 20:09:412023/04/12 20:09:41
88
Shiseido | Integrated Report 2023
Line items under Japanese GAAP Japanese GAAP Reclassification
Differences in
recognition and
measurement IFRS Notes Line items under IFRSs
Millions of yen Millions of yen Millions of yen Millions of yen
Liabilities and equity
Liabilities Liabilities
Current liabilities Current liabilities
Notes and accounts payable 28,021 175,699 (2) 203,718 11 Trade and other payables
Electronically recorded
obligations - operating
40,584 (40,584) — — 11
Short-term debt — 15,730 — 15,730 12 Bonds and borrowings
Current portion of long-term
debt
730 (730) — — 12
Current portion of corporate
bonds scheduled for redemption
15,000 (15,000) — — 12
Lease obligations 9,664 — 15,618 25,283 21 Lease liabilities
Other payables 96,488 (96,488) — — 11
Accrued income taxes 45,600 — — 45,600 Income taxes payable
Reserve for sales returns 3,379 (3,379) — — 11
Refund liabilities 13,631 (13,631) — — 11
Accrued bonuses for employees 29,557 (29,557) — — 15
Accrued bonuses for directors 169 (169) — — 15
Provision for liabilities and
charges
293 10,708 (158) 10,843 13 Provisions
Provision for loss on business
withdrawal
95 (95) — — 13
Provision for structural reforms 8,524 (8,524) — — 13
— 4,914 — 4,914 14 Other financial liabilities
Other current liabilities 92,291 1,233 13,945 107,470
13, 14, 15,
23, 24, 25
Other current liabilities
Total current liabilities 384,031 126 29,404 413,561 Total current liabilities
010_0252087912303.indd 88010_0252087912303.indd 88 2023/04/12 20:09:412023/04/12 20:09:41

89
CORPORATE DATA
Line items under Japanese GAAP Japanese GAAP Reclassification
Differences in
recognition and
measurement IFRS Notes Line items under IFRSs
Millions of yen Millions of yen Millions of yen Millions of yen
Long-Term Liabilities Non-current liabilities
Bonds 50,000 95,915 — 145,915 12 Bonds and borrowings
Long-term debt 95,915 (95,915) — — 12
Lease obligations 19,673 (12) 99,248 118,909 21 Lease liabilities
Long-term payables 4,756 772 117 5,646 14 Other financial liabilities
Liability for retirement benefits 18,587 827 22,745 42,159 26 Retirement benefit liability
Allowance for losses on
guarantees
350 (350) — — 14
— 1,753 — 1,753 13 Provisions
Deferred tax liabilities 1,040 — 564 1,605 27 Deferred tax liabilities
Other long-term liabilities 37,573 (2,163) (26,161) 9,248
13, 14,
22, 25, 29
Other non-current liabilities
Total long-term liabilities 227,896 827 96,514 325,237 Total non-current liabilities
Total liabilities 611,927 953 125,918 738,799 Total liabilities
Net assets Equity
Common stock 64,506 — — 64,506 Share capital
Capital surplus 70,741 1,067 1,226 73,035 16, 29 Capital surplus
Treasury stock (2,338) — — (2,338) Treasury shares
Stock acquisition rights 1,067 (1,067) — — 16
Retained earnings 366,306 — 5,895 372,202 31 Retained earnings
Total accumulated other
comprehensive income
45,805 — (12,516) 33,288 26, 28, 30 Other components of equity
546,089 — (5,394) 540,695
Total equity attributable to
owners of parent
Non-controlling interests in
consolidated subsidiaries
21,343 — 141 21,484 Non-controlling interests
Total net assets 567,433 — (5,253) 562,179 Total equity
Total liabilities and net assets 1,179,360 953 120,664 1,300,979 Total liabilities and equity
Notes on reconciliation of equity
(Reclassification)
Reclassifications consist mainly of the following:
1) Reclassification of cash and deposits
Short-term investments whose redemption date is due within three months from the acquisition date, which were included in “Short-term
investment securities” under Japanese GAAP, are reclassified to “Cash and cash equivalents” under IFRS.
2) Reclassification of account receivables
Account receivables, which were included in “Other current assets” under Japanese GAAP, are reclassified to “Trade and other receivables”
under IFRS.
3) Reclassification of allowance for doubtful accounts
“Allowance for doubtful accounts (current),” which was separately presented under Japanese GAAP, is reclassified to be presented on a net
basis by directly deducting the item from “Trade and other receivables” and “Other financial assets (current)” under IFRS. Likewise, “Allow-
ance for doubtful accounts (non-current)” is reclassified to be presented on a net basis by directly deducting the item from “Other financial
liabilities (non-current).”
010_0252087912303.indd 89010_0252087912303.indd 89 2023/04/12 20:09:412023/04/12 20:09:41
90
Shiseido | Integrated Report 2023
4) Reclassification of other financial assets
Time deposits with maturities of more than three months, which were included in “Cash and time deposits” under Japanese GAAP, are re-
classified to “Other financial assets (current)” under IFRS.
Meanwhile, guarantee and leasehold deposits, etc. which were included in “Other investments” and “Long-term loans receivable” in
fixed assets under Japanese GAAP, are reclassified to “Other financial assets (non-current)” under IFRS.
5) Reclassification of assets held for sale
Non-current assets held for sale or disposal groups are presented as “Assets held for sale” under IFRS.
6) Reclassification of property, plant and equipment
Under Japanese GAAP, some store furniture and fixtures in the Cosmetics Business were presented as “Long-term prepaid expenses,” but
they are presented as “Property, plant and equipment” under IFRS.
7) Reclassification of intangible assets
“Trademark rights” of intangible assets, which were stated separately under Japanese GAAP, are presented as “Intangible assets” under
IFRS.
8) Reclassification of right-of-use assets
Rights-to-use assets previously recorded at foreign subsidiaries to which IFRS was applied were included in “Property, plant and equip-
ment.” Under IFRS, they are presented separately as “Right-of-use assets.”
9) Reclassification of recorded amounts of investments accounted for using the equity method
“Investments accounted for using equity method,” which was included in “Investment securities” under Japanese GAAP, is separately pre-
sented under IFRS.
10) Reclassification of other non-current assets
“Long-term prepaid expenses”, which were stated separately under Japanese GAAP, are presented as “Other non-current assets” under
IFRS.
11) Reclassification of trade and other payables
“Notes and accounts payable,” “Electronically recorded obligations,” “Other payable,” “Reserve for sales returns” and “Refund liabilities,”
which were stated separately under Japanese GAAP, are presented as “Trade and other payables” under IFRS.
12) Reclassification of bonds and borrowings
“Short-term debt,” “Current portion of long-term debt,” and “Current portion of corporate bonds scheduled for redemption,” which were
classified as current liabilities under Japanese GAAP, are represented as “Bonds and borrowings (current)” Under IFRS. “Bonds payable”
and “Long-term debt,” which were separately presented as long-term liabilities under Japanese GAAP, are presented as “Bonds and bor-
rowings (non-current)” under IFRS.
13) Reclassification of provisions
“Provision for liabilities and charges,” “Provision for loss on business withdrawal,” and “Provision for structural reforms”, which were sepa-
rately presented under Japanese GAAP, and asset retirement obligations and other provisions, which were included in “Other current liabil-
ities” under current liabilities, under Japanese GAAP, are presented as “Provisions (current)” under IFRS. Asset retirement obligations,
which were included in “Other long-term liabilities” in long-term liabilities under Japanese GAAP, and other provisions are presented as
“Provisions (non-current)” under IFRS.
14) Reclassification of other financial liabilities
Deposits received and temporary receipts included in “Other current liabilities” under Japanese GAAP have been reclassified as “Other fi-
nancial liabilities (current)” under IFRS. Meanwhile, “Allowance for losses on guarantees” and “Long-term payables,” which were present-
ed separately in long-term liabilities and Long-term deposits received, which were included in “Other long-term liabilities,” are reclassified
to “Other financial liabilities (non-current)” under IFRS.
15) Reclassification of other current liabilities
“Accrued bonuses for employees” and “Accrued bonuses for directors,” which were separately presented under Japanese GAAP, are pre-
sented as “Other current liabilities” under IFRS.
16) Reclassification of capital surplus
“Stock acquisition rights,” which were stated separately under Japanese GAAP, are presented as “Capital surplus” under IFRS.
(Recognition and measurement differences)
Recognition and measurement differences consist mainly of the following:
17) Adjustments to the recorded amount of inventories
Promotional assets, which were included in “Inventories” under Japanese GAAP, are recognized as expenses at the time of purchase be-
cause they do not meet the definition of assets under IFRS.
18) Adjustments to recorded amount of property, plant and equipment
Real estate acquisition taxes, which was expensed under Japanese GAAP, are capitalized under IFRS.
010_0252087912303.indd 90010_0252087912303.indd 90 2023/04/12 20:09:412023/04/12 20:09:41

91
CORPORATE DATA
19) Application of impairment accounting
After assessing the recoverability of non-current assets based on IFRS, impairment loss is recorded for certain right-of-use assets and a re-
versal of impairment loss is recorded for certain intangible assets as of the transition date. Difference from impairment loss under Japanese
GAAP is recorded for certain goodwill and intangible assets in the previous fiscal year.
20) Adjustments to recorded amount of goodwill
Under Japanese GAAP, the amortization period for goodwill was estimated and amortized over that number of years. Under IFRS, however,
goodwill is not amortized after the transition date.
21) Adjustments to lease transactions
Operating lease transactions and finance lease transactions that were accounted for as operating leases under Japanese GAAP are ac-
counted for as “Right-of-use assets” under IFRS in accordance with purchase and sale transactions, and the corresponding obligations are
included in “Lease liabilities (current)” and “Lease liabilities (non-current).”
22) Partial sales of shares of subsidiaries that result in a loss of control
In the case that a subsidiary becomes an affiliate due to loss of control as a result of partial sales of shares of subsidiary, the residual in-
vestment was adjusted to investment appraisal value by the equity method under Japanese GAAP, but under IFRS, the residual investment
is measured in fair value.
23) Adjustments to accrued paid absences
Unused paid absences, which were not accounted for under Japanese GAAP, are recoded as liabilities in “Other current liabilities” under
IFRS.
24) Adjustments to the timing of revenue recognition
For points provided to customers in accordance with sales of products, under Japanese GAAP, revenue was recorded in full at the time of
sale and the amount expected to be used by customers in the future was recorded as an allowance. Under IFRS, however, transaction
prices allocated to points expected to be used by customers in the future at the time of sale are recorded as “Other current liabilities” and
revenue is recognized based on the use of points.
25) Adjustments to government subsidies
Under Japanese GAAP, subsidies related to assets were recognized as revenue collectively when they were finalized to be received, but
under IFRS, they are recorded as deferred revenue in “Other current liabilities” and “Other non-current liabilities” and are recognized as
revenue on a regular basis over the period in which the corresponding assets are recognized as expenses.
26) Adjustments to postretirement benefits
Under Japanese GAAP, actuarial gains and losses and past service costs in retirement benefits were recognized in other comprehensive
income when incurred and amortized through profit or loss over a certain number of years within the average remaining service period of
employees when incurred. Under IFRS, remeasurements of defined benefit plans are recognized in other comprehensive income when in-
curred, and past service costs are recognized in profit or loss when incurred. Remeasurements of defined benefit plans recognized in other
comprehensive income are immediately reclassified to “Retained earnings” after being recognized in other components of equity.
In addition, IFRS recalculates the mortality rate, which is one of the assumptions used to determine the defined benefit obligation, using
figures that are expected to change in the future.
27) Adjustments to deferred tax assets and deferred tax liabilities
The amounts of “Deferred tax assets and deferred tax liabilities” have been adjusted due to temporary differences arising from the recon-
ciliation of Japanese GAAP to IFRS and a reexamination of the recoverability of deferred tax assets.
Under Japanese GAAP, the recording of deferred tax assets for elimination of unrealized gains on internal transactions within the con-
solidated group was assessed for recoverability based on taxable income generated by the selling entities and calculated using the effective
tax rate of the selling entities. Under IFRS, the recoverability is assessed based on future taxable income generated by the acquiring enti-
ties and calculated using the effective tax rate of the acquiring entities.
28) Measurements of financial instruments
Under Japanese GAAP, unlisted shares were accounted for based on their historical cost, and impairment losses were recognized as the
issuer’s financial condition deteriorated as required. However, under IFRS, changes in fair value are measured at fair value and recognized
in other comprehensive income. Accumulated amounts recognized in other comprehensive income are immediately reclassified to “Re-
tained earnings” after being recognized in other components of equity.
29) Adjustments to capital surplus
Under Japanese GAAP, the estimated amount of benefits related to stock compensation plans (performance-linked stock compensation
plans) was recorded in “Other long-term liabilities.” Under IFRS, the estimated amount of stock-based benefits is accounted for as equi-
ty-settled stock-based payment, and the adjustments are recorded in “Capital surplus.”
30) Adjustments to cumulative exchange differences on translation of foreign operations
Applying for the exemption of first-time adoption, all cumulative translation differences of foreign operations as of the transition date have
been reclassified to “Retained earnings.”
010_0252087912303.indd 91010_0252087912303.indd 91 2023/04/12 20:09:412023/04/12 20:09:41
92
Shiseido | Integrated Report 2023
31) Adjustments to retained earnings
The impact of the adoption of IFRS on retained earnings is as follows. The tax effect adjustments related to each reconciling item are in-
cluded in adjustments to deferred tax assets and liabilities, and adjustments to non-controlling interests are included in other items.
IFRS transition date
(January 1, 2021)
As of December 31,
2021
Millions of yen Millions of yen
Adjustments to the recorded amount of inventories (Note 17) (7,342) (8,225)
Application of impairment accounting (Note 19) 11,536 (202)
Adjustments to recorded amount of goodwill (Note 20) — 5,996
Adjustments to lease transactions (Note 21) (2,431) (4,935)
Adjustments to recorded amount of investment accounted for equity method (Note 22) — 44,824
Adjustments to accrued paid absences (Note 23) (11,757) (12,021)
Adjustments to the timing of revenue recognition (Note 24) (3,554) (4,059)
Adjustments to governmental subsidies (Note 25) (539) (1,962)
Adjustments to postretirement benefits (Note 26) (18,533) (16,289)
Adjustments to deferred tax assets and deferred tax liabilities(Note 27) 16,813 (6,242)
Measurements of financial instruments (Note 28) 5,827 4,228
Adjustments to cumulative exchange differences on translation of foreign operations (Note 30) 5,257 5,257
Others 784 (470)
Total (3,939) 5,895
010_0252087912303.indd 92010_0252087912303.indd 92 2023/04/12 20:09:412023/04/12 20:09:41

93
CORPORATE DATA
Reconciliations of profit or loss and comprehensive income for the fiscal year ended December 31, 2021 (January 1, 2021 - December 31, 2021)
(Fiscal year of most recent consolidated financial statements based on Japanese GAAP)
Line items under Japanese GAAP Japanese GAAP Reclassification
Differences in
recognition and
measurement IFRS Notes Line items under IFRSs
Millions of yen Millions of yen Millions of yen Millions of yen
Net sales 1,035,165 (25,036) (162) 1,009,966 1 Net sales
Cost of sales 262,959 7,900 948 271,808 2, 6, 7, Cost of sales
Gross profit 772,206 (32,936) (1,110) 738,158 Gross profit
Selling, general and administrative
expenses
730,619 27,232 9,154 767,007
1, 2, 4, 5,
6, 7, 10
Selling, general and
administrative expenses
— 96,383 44,615 140,999 2, 8, 9 Other operating income
— 7,427 4,152 11,579 2, 10 Other operating expenses
Operating profit 41,586 28,787 30,197 100,571 Operating profit
Non-operating income 9,453 (9,453) — —2
Non-operating expenses 6,204 (6,204) — —2
Extraordinary gains 93,066 (93,066) — —2
Extraordinary losses 64,644 (64,644) — —2
— 6,764 (2,685) 4,079 2 Finance income
— 2,790 1,039 3,829 2, 6 Finance costs
— (1,090) (618) (1,709) 2
Share of profit (loss) of
investment accounted for using
equity method
Profit before income taxes 73,256 — 25,854 99,111 Profit before tax
Income taxes – current 61,923 (33,578) 21,316 49,661 3, 11 Income tax expense
Refund of income taxes for prior
years
(1,165) 1,165 — —3
Income taxes – deferred (32,413) 32,413 — —3
Net profit 44,912 — 4,538 49,450 Profit
Other comprehensive income Other comprehensive income
Items that will not be reclassified
to profit or loss
Valuation difference on available-
for-sale securities
(1,779) — 1,889 110
Financial assets measured at
fair value through other
comprehensive income
Adjustment for retirement benefits 3,322 — 1,639 4,961 6
Remeasurements of defined
benefit plans
— (0) 0 0
Share of other comprehensive
income of investments accounted
for using equity method
Items that may be reclassified to
profit or loss
— — 98 98 Cash flow hedges
Foreign currency translation
adjustments
34,247 — 815 35,062
Exchange differences on
translation of foreign operations
Share of other comprehensive
income of associates accounted
for under the equity method
519 0 (4) 515
Share of other comprehensive
income of investments accounted
for using equity method
Total other comprehensive income 36,310 — 4,438 40,748
Other comprehensive income,
net of tax
Comprehensive Income 81,222 — 8,976 90,198 Comprehensive income
Notes on reconciliation of profit and loss and comprehensive income
(Reclassification of Presentation Items)
Reclassifications consist mainly of the following:
1) Reclassification of Net sales
Certain rebates, etc. presented as “Selling, general and administrative expenses” under Japanese GAAP have been deducted from “Net
sales” under IFRS.
010_0252087912303.indd 93010_0252087912303.indd 93 2023/04/12 20:09:412023/04/12 20:09:41
94
Shiseido | Integrated Report 2023
2) Other Reclassifications
For items presented as “Non-operating income,” “Non-operating expenses,” “Extraordinary income” and “Extraordinary losses” under Jap-
anese GAAP, finance-related profits or losses are recorded as “Finance income” and “Finance costs”, and other items are presented as
“Cost of sales,” “Selling, general and administrative expenses,” “Other operating income,” “Other operating expenses,” and “Share of profit
(loss) of investment accounted for using equity method.” under IFRS.
3) Income tax expense
“Income taxes - current,” “Refund of income taxes for prior years,” and “Income taxes - deferred,” which were separately presented under
Japanese GAAP, are presented in total as “Income tax expense” under IFRS.
(Recognition and measurement differences)
Recognition and measurement differences consist mainly of the following:
4) Reconciliation of selling, general and administrative expenses
Promotional assets, which were included in “Inventories” under Japanese GAAP, are recognized as “Selling, general and administrative ex-
penses” at the time of purchase because they do not meet the definition of assets under IFRS.
5) Adjustment to recorded amount of goodwill
Under Japanese GAAP, the amortization period for goodwill was estimated and amortized over that number of years. Under IFRS, however,
goodwill is not amortized after the transition date.
6) Adjustments for remeasurement of defined benefit plans
Under Japanese GAAP, actuarial gains and losses and past service costs in retirement benefits were recognized in other comprehensive in-
come when incurred and amortized through profit or loss over a certain number of years within the average remaining service period of
employees when incurred. Under IFRS, remeasurements of defined benefit plans are recognized in other comprehensive income when in-
curred, and past service costs are recognized in profit or loss when incurred.
Under Japanese GAAP, interest cost was recognized by multiplying the retirement benefit obligation by the discount rate and expected
return on plan assets was recognized by multiplying by the expected rate of return on plan assets, respectively. Under IFRS, net interest is
recognized by multiplying the net retirement benefit obligation and plan assets by the discount rate. The expected return on plan assets
and interest cost related to retirement benefits were included in “Cost of sales” and “Selling, general and administrative expenses” as re-
tirement benefit expenses under Japanese GAAP, but net interest related to retirement benefits is presented as “Finance costs” under
IFRS.
7) Adjustment to accrued paid absences
Unused paid absences, which were not accounted for under Japanese GAAP, are recoded as liabilities in “Cost of sales” and “Selling, gen-
eral and administrative expenses” under IFRS.
8) Adjustment to government subsidies
Under Japanese GAAP, subsidies related to assets were recognized as revenue collectively when they were finalized to be received, but un-
der IFRS, they are treated as deferred revenue and recognized as “Other operating income” on a regular basis over the period in which the
corresponding assets are recognized as expenses.
9) Partial sales of shares of subsidiaries that result in a loss of control
In the case that a subsidiary becomes an affiliate due to loss of control as a result of partial sales of shares of subsidiary, the residual invest-
ment was adjusted to investment appraisal value by the equity method under Japanese GAAP, but under IFRS, the residual investment is
measured in fair value and the difference from the carrying amount is recognized as “Other operating income.”
10) Application of impairment accounting
After assessing the recoverability of non-current assets based on IFRS, difference from impairment loss under Japanese GAAP is recorded
to certain goodwill and intangible assets in the previous fiscal year.
11) Income tax expense
The amounts of “Income tax expense” have been adjusted due to temporary differences arising from the reconciliation of Japanese GAAP
to IFRS and a reexamination of the recoverability of deferred tax assets.
Under Japanese GAAP, the recording of deferred tax assets for elimination of unrealized gains on internal transactions within the consol-
idated group was assessed for recoverability based on taxable income generated by the selling entities and calculated using the effective
tax rate of the selling entities. Under IFRS, the recoverability is assessed based on future taxable income generated by the acquiring entities
and calculated using the effective tax rate of the acquiring entities.
Reconciliations of cash flows for the fiscal year ended December 31, 2021 (from January 1, 2021 to December 31, 2021) (Fiscal year of most
recent consolidated financial statements based Japanese GAAP)
Under Japanese GAAP, operating leases were accounted for as leases, so their lease payments were classified as cash flows from operating activi-
ties. However, under IFRS, a portion of the lease payments is classified as cash flows from financing activities because they correspond to the repay-
ment of the lease liability recognized along with the right-of-use asset.
010_0252087912303.indd 94010_0252087912303.indd 94 2023/04/12 20:09:412023/04/12 20:09:41

95
CORPORATE DATA
Independent Auditor’s Report
Independent auditor’s report
To the Board of Directors of Shiseido Company, Limited:
Opinion
We have audited the accompanying consolidated nancial statements of Shiseido Company, Limited
(“the Company”) and its consolidated subsidiaries (collectively referred to as “the Group”), which
comprise the consolidated statement of nancial position as at December 31, 2022, and the consolidated
statements of prot and loss , consolidated statements of comprehensive income, consolidated
statements of changes in equity and consolidated statements of cash ows for the year then ended, and
notes, comprising signicant accounting policies and other explanatory information.
In our opinion, the accompanying consolidated nancial statements present fairly, in all material
respects, the consolidated nancial position of the Group as at December 31, 2022, and its consolidated
nancial performance and its consolidated cash ows for the year then ended in accordance with
International Financial Reporting Standards (IFRS).
Basis for Opinion
We conducted our audit in accordance with auditing standards generally accepted in Japan. Our
responsibilities under those standards are further described in the Auditor’s Responsibilities for the
Audit of the Consolidated Financial Statements section of our report. We are independent of the Group
in accordance with the ethical requirements that are relevant to our audit of the consolidated nancial
statements in Japan, and we have fullled our other ethical responsibilities in accordance with these
requirements. We believe that the audit evidence we have obtained is sucient and appropriate to
provide a basis for our opinion.
Key Audit Matters
Key audit matters are those matters that, in our professional judgment, were of most signicance in our
audit of the consolidated nancial statements of the current period. These matters were addressed in the
context of our audit of the consolidated nancial statements as a whole, and in forming our opinion
thereon, and we do not provide a separate opinion on these matters.
Appropriateness of the Company’s judgment on the valuation of goodwill allocated to the
Shiseido Americas Corporation cash-generating unit
The key audit matter How the matter was addressed in our audit
As described in Note 14. “Goodwill and Intangible
Assets” to the consolidated nancial statements,
goodwill of ¥57,879 million recognized in the
consolidated statement of nancial position
included goodwill of ¥27,399 million allocated to
the Shiseido Americas Corporation (hereinafter,
“SAC”) cash-generating unit , which accounted
for approximately 2.1% of total assets.
In order to assess the appropriateness of the
Company’s judgment on the valuation of goodwill
allocated to the SAC cash-generating unit, we
requested the component auditor of SAC to
perform an audit. Then we evaluated the results of
the following audit procedures, among others,
reported from them to conclude on whether
sucient and appropriate audit evidence was
obtained:
010_0252087912303.indd 95010_0252087912303.indd 95 2023/04/12 20:09:412023/04/12 20:09:41
96
Shiseido | Integrated Report 2023
Cash-generating units to which goodwill has been
allocated are tested for impairment at least
annually, and if the recoverable amount of a cash-
generating unit is less than its carrying amount,
the carrying amount is reduced to the recoverable
amount. The resulting decrease in the carrying
amount is recognized as an impairment loss. The
recoverable amount of a cash-generating unit is
the higher of its fair value less costs of disposal
and its value in use.
As a result of the annual impairment test, the
Company determined that the recognition of a
goodwill impairment loss was not necessary as the
recoverable amount of the SAC cash-generating
unit exceeded its carrying amount.
The recoverable amount of the SAC cash-
generating unit was based on the fair value less
costs of disposal. The fair value less costs of
disposal was calculated by discounting the future
cash ows, estimated based on the future business
plan (hereinafter, the “Business Plan”), which
incorporated the premises of U.S. long-term
market growth rates, the sales expansion plans and
the increase in the cost ratio during the current
scal year, among others , to the present value.
Management assumed a long-term market growth
rate of 4%, and a discount rate of 12.5% consisting
of the U.S. Risk Free Rate and a risk premium
specic to SAC.
The factors such as increases in sales and prot
margins based onthe sales expansion plan and the
increase in the cost ratio during the current scal
year, as well as the long-term market growth rate,
that formed the basis for measuring the fair value
less costs of disposal, involved a high degree of
uncertainty, and management’s judgment thereon
had a signicant eect on the estimate of the fair
value less costs of disposal. In addition, selecting
appropriate models and input data for estimating
the discount rate used to estimate the fair value
less costs of disposal required a high degree of
expertise in valuation.
(1) Internal control testing
Tested the design and implementation of certain of
SAC’s internal controls relevant to estimating the
fair value less costs of disposal for the goodwill
impairment test, with particular focus on the
review performed by the senior vice president of
nance on the reasonableness of the long-term
market growth and discount rates, including
supporting data, and of the future cash ows.
(2) Assessment of the reasonableness of the
estimated fair value less costs of disposal
Assessed the appropriateness of key assumptions
adopted in preparing the Business Plan, which was
used as the basis for estimating the fair value less
costs of disposal, by inquiring of management of
SAC about the rationale supporting each of those
assumptions. In addition:
•
retrospectively assessed the status of
achievement of the business plan used for the
impairment testing in the previous year by
comparing it with the actual results for the
current year; and
•
assessed the eect, if any, on the Company’s
judgment that the recognition of an impairment
loss was not necessary, when specic
uncertainties considering the past actual results
were incorporated into respective elements,
such as net sales, cost of sales, and selling,
general and administrative expenses, for the
subsequent scal years, underlying the sales
expansion plan.
In addition, the following procedures, among
others, were performed with the engagement of
enterprise valuation specialists within the network
rms of the component auditor of SAC:
•
assessment of the appropriateness of the model
adopted by management to estimate the
discount rate in light of the requirements of the
accounting standards;
• assessment of the appropriateness of the input
data used to calculate the discount rate by
comparing them with the estimates
independently developed by the enterprise
valuation specialists based on external data; and
010_0252087912303.indd 96010_0252087912303.indd 96 2023/04/12 20:09:412023/04/12 20:09:41

97
CORPORATE DATA
We, therefore, determined that our assessment of
the appropriateness of the Company’s judgment
on the valuation of goodwill allocated to the SAC
cash-generating unit was of most signicance in
our audit of the consolidated nancial statements
for the current scal year, and accordingly, a key
audit matter.
assessment of the appropriateness of the long-term
market growth rate by comparing it with U.S.
economic growth rates.
Other Information
The other information comprises the information included in the Integrated Report, but does not include
the consolidated nancial statements, the nancial statements, and our auditor’s reports thereon.
Management is responsible for the preparation and presentation of the other information. The Audit &
Supervisory Board members and the Audit & Supervisory Board are responsible for overseeing the
directors’ performance of their duties with regard to the design, implementation and maintenance of the
reporting process for the other information.
Our opinion on the consolidated nancial statements does not cover the other information and we do
not express any form of assurance conclusion thereon.
In connection with our audit of the consolidated nancial statements, our responsibility is to read the
other information and, in doing so, consider whether the other information is materially inconsistent
with the consolidated nancial statements or our knowledge obtained in the audit, or otherwise appears
to be materially misstated.
If, based on the work we have performed, we conclude that there is a material misstatement of this other
information, we are required to report that fact.
We have nothing to report in this regard.
Responsibilities of Management and the Audit & Supervisory Board Members and the Audit &
Supervisory Board for the Consolidated Financial Statements
Management is responsible for the preparation and fair presentation of the consolidated nancial
statements in accordance with IFRS, and for such internal control as management determines is
necessary to enable the preparation of consolidated nancial statements that are free from material
misstatement, whether due to fraud or error.
In preparing the consolidated nancial statements, management is responsible for assessing the Group’s
ability to continue as a going concern, disclosing, as applicable, matters related to going concern in
accordance with IFRS.
The Audit & Supervisory Board members and the Audit & Supervisory Board are responsible for
overseeing the directors’ performance of their duties with regard to the design, implementation and
maintenance of the Group’s nancial reporting process.
Auditor’s Responsibilities for the Audit of the Consolidated Financial Statements
Our objectives are to obtain reasonable assurance about whether the consolidated nancial statements
as a whole are free from material misstatement, whether due to fraud or error, and to issue an auditor’s
report that includes our opinion. Reasonable assurance is a high level of assurance, but is not a
guarantee that an audit conducted in accordance with auditing standards generally accepted in Japan
will always detect a material misstatement when it exists. Misstatements can arise from fraud or error
and are considered material if, individually or in the aggregate, they could reasonably be expected to
010_0252087912303.indd 97010_0252087912303.indd 97 2023/04/12 20:09:412023/04/12 20:09:41
98
Shiseido | Integrated Report 2023
inuence the economic decisions of users taken on the basis of these consolidated nancial statements.
As part of our audit in accordance with auditing standards generally accepted in Japan, we exercise
professional judgment and maintain professional skepticism throughout the audit. We also:
Identify and assess the risks of material misstatement of the consolidated nancial statements,
whether due to fraud or error, design and perform audit procedures responsive to those risks, and
obtain audit evidence that is sucient and appropriate to provide a basis for our opinion. The risk
of not detecting a material misstatement resulting from fraud is higher than for one resulting from
error, as fraud may involve collusion, forgery, intentional omissions, misrepresentations, or the
override of internal control.
Obtain an understanding of internal control relevant to the audit in order to design audit procedures
that are appropriate in the circumstances, while the objective of the audit is not to express an
opinion on the eectiveness of the Group’s internal control.
Evaluate the appropriateness of accounting policies used and the reasonableness of accounting
estimates and related disclosures made by management.
Conclude on the appropriateness of management’s use of the going concern basis of accounting
and based on the audit evidence obtained, whether a material uncertainty exists related to events or
conditions that may cast signicant doubt on the Group’s ability to continue as a going concern. If
we conclude that a material uncertainty exists, we are required to draw attention in our auditor’s
report to the related disclosures in the consolidated nancial statements or, if such disclosures are
inadequate, to modify our opinion. Our conclusions are based on the audit evidence obtained up to
the date of our auditor’s report. However, future events or conditions may cause the Group to cease
to continue as a going concern.
Evaluate whether the presentation and disclosures in the consolidated nancial statements are in
accordance with IFRS, the overall presentation, structure and content of the consolidated nancial
statements, including the disclosures, and whether the consolidated nancial statements represent
the underlying transactions and events in a manner that achieves fair presentation.
Obtain sucient appropriate audit evidence regarding the nancial information of the entities or
business activities within the Group to express an opinion on the consolidated nancial statements.
We are responsible for the direction, supervision and performance of the group audit. We remain
solely responsible for our audit opinion.
We communicate with the Audit & Supervisory Board members and the Audit & Supervisory Board
regarding, among other matters, the planned scope and timing of the audit, signicant audit ndings,
including any signicant deciencies in internal control that we identify during our audit.
We also provide the Audit & Supervisory Board members and the Audit & Supervisory Board with a
statement that we have complied with relevant ethical requirements regarding independence, and
communicate with them all relationships and other matters that may reasonably be thought to bear on
our independence, and where applicable, related safeguards.
From the matters communicated with the Audit & Supervisory Board members and the Audit &
Supervisory Board, we determine those matters that were of most signicance in the audit of the
consolidated nancial statements of the current period and are therefore the key audit matters. We
describe these matters in our auditor’s report unless law or regulation precludes public disclosure about
the matter or when, in extremely rare circumstances, we determine that a matter should not be
communicated in our report because the adverse consequences of doing so would reasonably be
expected to outweigh the public interest benets of such communication.
010_0252087912303.indd 98010_0252087912303.indd 98 2023/04/12 20:09:412023/04/12 20:09:41

99
CORPORATE DATA
Convenience Translation
The U.S. dollar amounts in the accompanying consolidated nancial statements with respect to the year
ended December 31, 2022 are presented solely for convenience. Our audit also included the translation
of yen amounts into U.S. dollar amounts and, in our opinion, such translation has been made on the
basis described in Note 2 to the consolidated nancial statements.
Interest required to be disclosed by the Certied Public Accountants Act of Japan
We do not have any interest in the Group which is required to be disclosed pursuant to the provisions of
the Certied Public Accountants Act of Japan.
Masakazu Hattori
Designated Engagement Partner
Certied Public Accountant
Kentaro Hayashi
Designated Engagement Partner
Certied Public Accountant
Unshil Kang
Designated Engagement Partner
Certied Public Accountant
KPMG AZSA LLC
Tokyo Oce, Japan
April 12, 2023
Notes to the Reader of Independent Auditor’s Report:
This is a copy of the Independent Auditor’s Report and the original copies are kept separately by the
Company and KPMG AZSA LLC.
010_0252087912303.indd 99010_0252087912303.indd 99 2023/04/12 20:09:412023/04/12 20:09:41
