
Luminex Corporation
12212 Technology Blvd.
Austin, TX 78727
U.S.A.
Technical Support
Telephone: 512-381- 4 3 97
North America Toll Free: 1-877-785-2323
International Toll Free: + 800-2939-4959
Email: support@luminexcorp.com
www.luminexcorp.com
Muse® Multi-Color DNA Damage Kit
User’s Guide
For Research Use Only. Not for use in diagnostic
procedures.
MCH200107MAN, Rev B
Catalog No. MCH200107
January 2020

Muse
®
Multi-Color DNA Damage Kit
For Research Use Only 1
Introduction
The Muse® Multi-Color DNA Damage kit is designed to enable researchers a quick and easy way to detect the
activation of ATM and H2A.X using the Guava® Muse Cell Analyzer. The kit was designed and optimized using a
DNA damaging reagent, Etoposide, on HeLa cells as a model system. But the kit can be used with other human cell
lines to investigate both the physical and chemical factors which can induce the DNA damage response through
the ATM dependent signaling pathway. Data generated using the Guava Muse Cell Analyzer along with the corre-
sponding Muse software module provides statistical values measuring:
• Percentage of negative cells (e.g. no DNA damage)
• Percentage of ATM activated cells
• Percentage of H2A.X activated cells
• Percentage of DNA double-strand breaks (dual activation of both ATM and H2A.X)
The signaling pathways by which cells respond to DNA damage is an important area of study for cancer research.
The mammalian cell response to DNA damage is made up of highly coordinated signaling pathways that can initi-
ate cell cycle arrest and repair or initiate apoptosis, depending on the extent and type of the damage. Cells that are
defective in DNA damage signaling pathways can cause cancer because they lack the ability to sense and repair
the damage, leading to genetic instability and ultimately uncontrolled cell growth.
The main kinase activated in response to double-stranded DNA breaks is ATM or Ataxiatelangiectasia mutated
kinase. ATM is a member of the phospho inositide 3-kinase (PI3K)-related Ser/Thr protein kinase family. Inactive
ATM exists as a dimer but quickly dissociates and becomes phosphorylated on Serine 1981 in response to ionizing
radiation [1].
Once activated, ATM phosphorylates a number of downstream factors, including P53, CHK2, SMC1,
NBS1, and Histone H2A.X [2,3]. Phosphorylation of the histone variant, H2A.X, at serine 139 by ATM is an import-
ant indicator of DNA damage [4]. As the level of DNA damage increases, the level of phospho Histone H2A.X
(also known as γH2AX) increases and accumulates at the sites of DNA damage and is often used to indicate the
level of DNA damage present within the cell [5]. γH2AX is also responsible for recruiting response proteins to the
site of DNA damage [6].
In all, a comprehensive understanding of both ATM and Histone H2A.X activities, and understanding the conse-
quence of its activation can provide the researcher with useful information which will be important in understand-
ing the nature of the DNA damage response. The Muse Multi-Color DNA Damage Kit is designed to allow the
researcher to monitor and accurately measure phospho-specific activation for both ATM and Histone H2A.X in a
population of cells.
The Muse Multi-Color DNA Damage Kit is optimized on the Guava Muse Cell Analyzer. Both antibodies provided
in the kit are carefully titrated and optimized together to ensure maximal performance when run in multiplex, alle-
viating the need for any additional optimization. This kit contains optimized fixation, permeabilization, and assay
buffers to provide researchers with a complete solution for DNA damage signaling analysis.
Product Overview
The Muse® Multi-Color DNA Damage Kit includes two directly conjugated antibodies, a phospho-specific ATM
(Ser1981)-PE and a phospho-specific Histone H2A.X-PECy5 conjugated antibody to measure the extent of DNA
damage in testing samples. This two color kit is designed to detect the phosphorylation state of ATM and Histone
H2A.X simultaneously by flow analysis. Together, two color analysis of ATM and Histone H2A.X activation in mul-

Muse
®
Multi-Color DNA Damage Kit
For Research Use Only 2
tiplex provides a more reliable detection method for assessing the DNA damage signaling pathway. This antibody
pair provides a sensitive and valuable tool to study the factors that induce DNA damage and/or affect DNA repair,
and allows one to explore the linkage between DNA damage, cell cycle checkpoints, and initiation of apoptosis.
Ionizing radiation (IR) and many chemotherapeutic agents like etoposide kill cancer cells by induction of DNA
DSBs. Several reports show that the levels of γ-H2A.X as detected by flow cytometry correlates with the number
of DNA strand breaks, to the level of cell death and radiosensitivity [7]. Both ATM and H2A.X phosphorylate in
response to DNA damaging reagents (e.g. Etoposide) or UV light, and this dual activation clearly indicates that
DSBs have occurred [4,9]. Understanding when DSBs take place can help researchers understand the mecha-
nisms involved in DNA repair and the DNA damage response.
Sufficient reagents are provided to perform 50 tests. Detailed assay instructions are included to assist in analysis
and to ensure the correct cell concentration is obtained during acquisition of sample data.
For Research Use Only. Not for use in diagnostic procedures.
The DNA Damage Signaling Pathway

Muse
®
Multi-Color DNA Damage Kit
For Research Use Only 3
Summary of Protocol
Materials Provided
• 20X Anti-phospho-ATM (Ser1981), PE: (Part No. CS208162). One vial containing 250 µL
• 20X Anti-phospho-Histone H2A.X (Ser139), PECy5: (Part No. CS208174). One vial containing 250 µL
• 5X Assay Buffer: (Part No. CS202124). One bottle containing 55 mL
• Fixation Buffer: (Part No. CS202122). One bottle containing 13 mL
• 1X Permeabilization Buffer: (Part No. CS203284). One bottle containing 14 mL
Materials Required But Not Supplied
Reagents/Consumables
• Test tubes for sample preparation and storage
• Tissue culture reagents, i.e. HBSS, PBS w/o Ca2+ or Mg2+, cell dislodging buffers, etc.
• Deionized Water (for buffer dilution)
• Cells of interest in suspension (e.g. HeLa, HEK293, etc.)
• Microcentrifuge tubes with screw caps, 1.5 mL (VWR, Catalog No. 16466-030, or equivalent)
• Muse® System Check Kit (Catalog No. MCH100101)
• Guava® ICF Instrument Cleaning Fluid (Catalog No. 4200-0140), optional
Equipment
• Pipettes with corresponding tips capable of accurately measuring 10 – 1000 µL
• Tabletop centrifuge capable of achieving 300 x g
• Mechanical vortex
• Guava® Muse® Cell Analyzer
Prepare cell cultures for experimentation
(treated or untreated)
p
Centrifuge cells at 300 x g for 5 min and wash
once with 1X PBS
p
Fix cells in Fixation Buer for 10 min on ice,
followed by a washing step
p
Permeabilize cells with Permeabilization Buer
for 10 min on ice, followed by a washing step
p
Add 200,000 cells to each tube
(treated or untreated)
Add 10 μL of the antibody
cocktail to 90 μL of 1X Assay
Buer per tube/test. Allow
to incubate for 30 min at
room temp (dark)
Resuspend in 200 μL 1X
Assay Buer and acquire
samples on Muse Cell
Analyzer
Centrifuge cells at
300 x g for 5 min
and wash with 1X
Assay Buer

Muse
®
Multi-Color DNA Damage Kit
For Research Use Only 4
Warnings and Precautions
• The instructions provided have been designed to optimize the kit’s performance. Deviation from the kit’s
instructions may result in suboptimal performance and may produce inaccurate data.
• Some assay components included in the kit may be harmful. Please refer to the SDS sheet for specific
information on hazardous materials (SDS forms can be found on the web page or by contacting Luminex
technical services).
• During storage and shipment, the directly conjugated antibodies may condense within the vial. For maxi-
mum recovery of the product, centrifuge original vial prior to removing cap.
• The conjugated antibody is light sensitive and must be stored in the dark at 2 - 8°C.
• Do not use reagents beyond the expiration date of the kit.
Storage and Stability
All reagents must be stored at 2 - 8°C.
All kit components are stable up to four (4) months from date of receipt if stored and handled correctly. Please
avoid repeated changes in temperature as this will affect the integrity of the product.
Before You Begin
It is highly recommended that you run the cell samples shortly after completing the sample preparation. While
some cell types have been shown to yield stable results for up to 24 hours after cell fixation/Permeabilization/
antibody staining if properly stored, the stability of individual cell types may vary.
Time considerations: When dealing with phospho-specific activation detection, fixation of cell samples after cell
treatment(s) is critical to capture the phosphorylation/activation event. Some activation state cell signaling
responses are transient and may be lost if cell cultures are not fixed immediately following treatment. Cell fixation,
permeabilization, and staining will take approximately 50 minutes. Acquiring data on your Guava® Muse® Cell
Analyzer takes less than 3 minutes per sample, depending on the cell concentration and desired number of events
to acquire.
Always perform a System Check prior to performing the assay. For details refer to the Guava Muse Cell Analyzer
User’s Guide.
Preparation of Reagents
1. Assay Buffer
Assay Buffer is supplied at 5X concentration and should be diluted to 1X with deionized water prior to use.
Prepared 1X Assay Buffer is stable up to one year. Store at 2 - 8°C
2. Antibody Working Cocktail Solution
The kit contains two (2) antibodies which can be used in multiplex. Prior to antibody staining of cells, prepare

Muse
®
Multi-Color DNA Damage Kit
For Research Use Only 5
an antibody working cocktail solution by addition of the following: Add 5 µL of anti-phospho-ATM (Ser1981),
PE and 5 µL of anti-phospho-Histone H2A.X (Ser139),PECy5 conjugated antibodies into a centrifuge tube for
a final volume of 10 µL total. This amount is good for one (1) test.
*Based on the number of tests/tubes being performed, it is up to the end user to adjust antibody volume
amounts at similar ratios (e.g. for 10 tests, the working cocktail solution will contain 50 µL of anti-phospho-
Histone H2A.X (Ser139) and 50 µL of anti-phospho-ATM (Ser1981) for a total of 100 µL). Aliquot 10 µL of the
working cocktail solution per test tube sample. This solution should be prepared as needed but if temporary
storage is needed please keep in the dark at 2 - 8°C.
Assay Instructions
NOTE: This assay protocol has been optimized using human HeLa cells. However, this kit is suitable for measur-
ing the extent of both ATM and H2A.X target-specific detection of activation via phosphorylation on a
variety of human cell types. Alternate species reactivity must be confirmed by the end user.
I. Cell Culture and Stimulation (Used for example purposes)
1. Prepare cells of interest into two tissue culture flasks (treated or untreated) overnight in a 37°C incubator
with 5% CO
2
. Cells should be at about 90% confluent the next day.
2. For the flask labeled, “Treated”, treat cells accordingly (e.g. chemically treated using topoisomerase inhibitors
or compound of choice, or physically treated by exposure to UV irradiation). The intent is to induce DNA
damage for the given cell type. The other flask labeled, “untreated”, will serve as a control.
3. Incubate the flasks in a 37°C incubator with 5% CO
2
. Exposure time and treatment concentrations are deter-
mined at the discretion of the end user.
4. Deactivate cells by exchanging out the growth media with fresh growth media or 1X PBS.
*All cell treatments and experimental samples are determined by the end user. This section is provided only as an
example for inducing a DNA damage response for measurement of phospho-ATM and phospho-Histone H2A.X
activation.
II. Fix and Permeabilize Cells
5. After cellular deactivation, spin down the “treated” and “untreated” testing samples at 300 x g for 5 minutes
and discard the media.
6. Resuspend cells by adding 50 μL of 1X Assay Buffer per 100,000 cells (for larger cell samples, i.e.— 1x10
6
cells, add 500 μL 1X Assay Buffer to cell sample).
7. Add equal parts Fixation Buffer to cell suspension (1:1). So for every 50 μL of 1X Assay Buffer per 100,000
cells, add an additional 50 μL Fixation Buffer for a total of 100 μL cell fixation solution, and mix sample by gen-
tly pipetting up and down. (Similarly, add 50 μL of Fixation Buffer for every extra 100,000 cells evaluated to
keep the 1:1 ratio consistent). Incubate for 10 minutes on ice.
8. Spin down cells at 300 x g for 5 minutes in a tabletop centrifuge and discard supernatant.
9. Permeabilize cells by adding 100 μL ice-cold 1X Permeabilization Buffer per 100,000 cells and incubate on ice
for 10 minutes (For larger cell samples, i.e.—one million cells, add one mL ice-cold Permeabilization Buffer).
10. Spin down cells at 300 x g for 5 minutes in a tabletop centrifuge and discard supernatant.
11. Resuspend cells in 90 μL 1X Assay Buffer per 100,000 cells in a microcentrifuge tube (Compatible for the
Guava® Muse® Cell Analyzer; Please see Materials Not Supplied section on page 3).
Muse
®
Multi-Color DNA Damage Kit
For Research Use Only 6
III. Cell Staining and Analysis
12. For multiplexing, add 10 μL of the antibody working cocktail solution as previously described into each micro-
centrifuge tube containing the cell suspension.
13. Incubate cell testing samples for 30 minutes in the dark at room temperature.
14. Following incubation step, add 100 μL of 1x Assay Buffer to each microcentrifuge testing sample and centri-
fuge at 300 x g for 5 minutes on a tabletop centrifuge. Discard supernatant.
15. Resuspend cells in each microcentrifuge tube with 200 μL of 1x Assay Buffer.
16. Acquire samples on the Guava Muse Cell Analyzer using the onscreen instructions.
Setup and Acquisition on the Guava® Muse® Cell
Analyzer
Run a System Check prior to performing the assay. For information on Muse® System Check, refer to the Guava®
Muse Cell Analyzer User’s Guide.
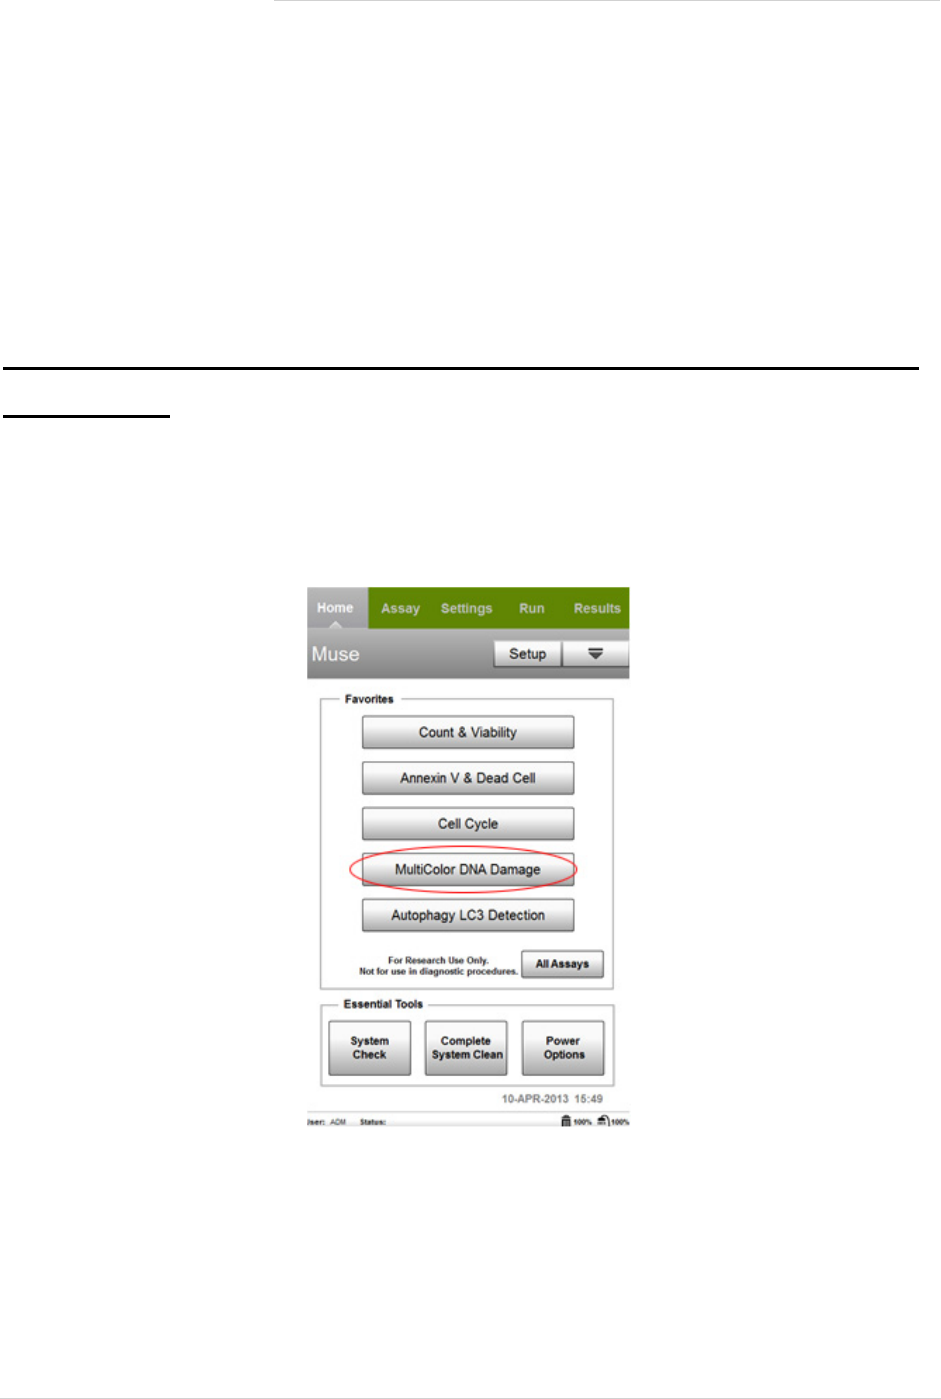
1. Select MultiColor DNA Damage from the main menu.
Muse
®
Multi-Color DNA Damage Kit
For Research Use Only 7
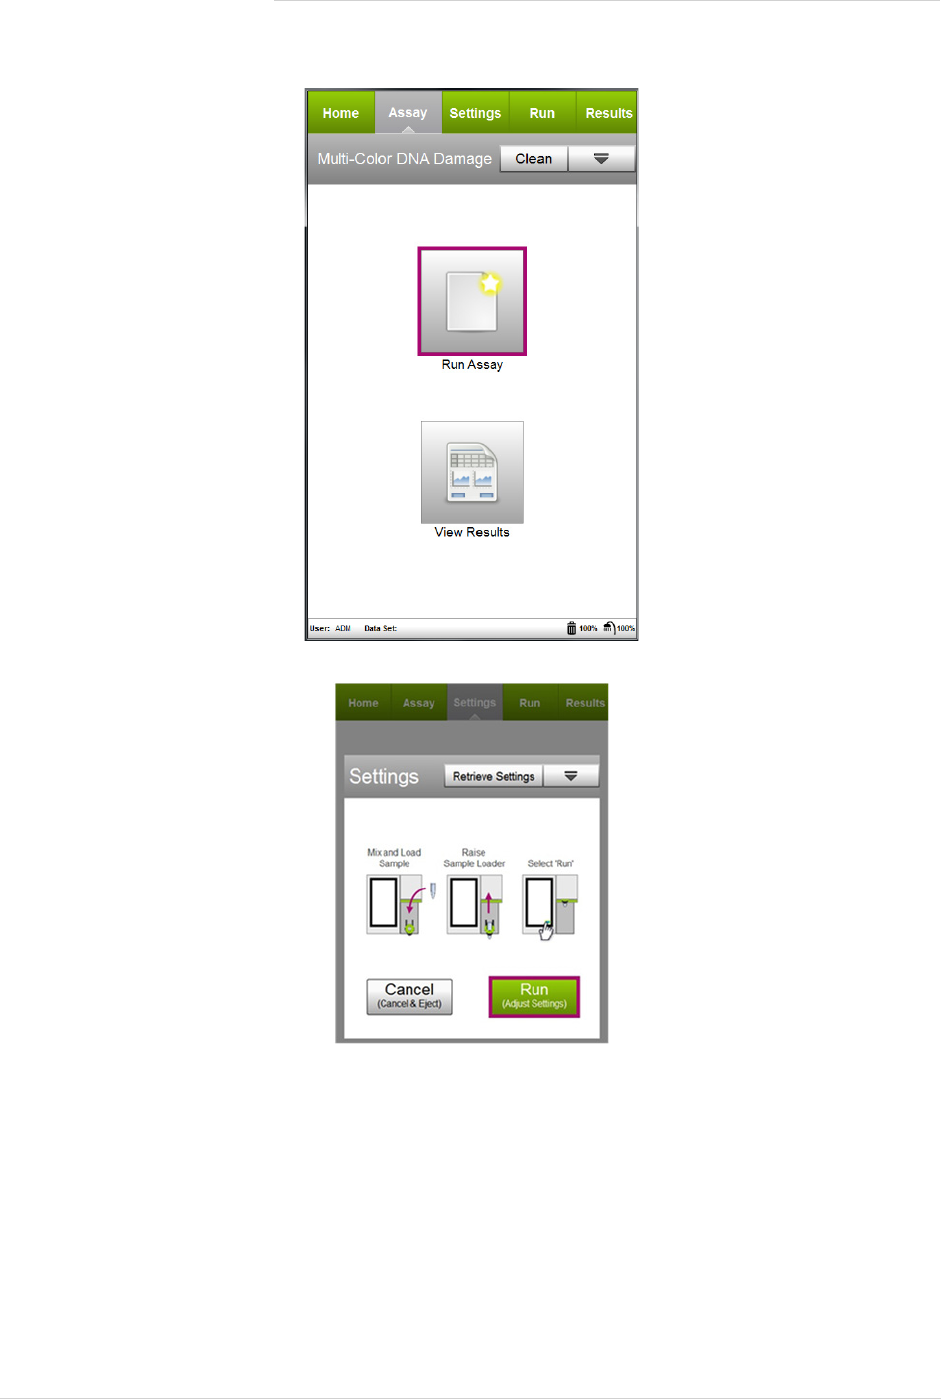
2. Select Run Assay.
3. Adjust the instrument settings:
• Load the sample for adjusting the settings and select Run.
NOTE: Perform the adjust settings step using a negative control (e.g. no treatment), then verify the set-
tings using a positive control (e.g. treated).
• Or, to retrieve previously saved instrument settings, select Retrieve Settings. For more information on
retrieving settings, see the Guava Muse Cell Analyzer User’s Guide.
4. Fine tune the settings for the DNA DAMAGE and CELL SIZE INDEX plot, if necessary.
• Adjust the CELL SIZE INDEX slider accordingly to capture the cell population of interest (see on screen
instruction for example).

Muse
®
Multi-Color DNA Damage Kit
For Research Use Only 8
• Drag the threshold left or right to exclude cell debris. Drag to make large changes. Touch the arrow buttons
located below the plot to make small changes. The arrow buttons appear after you touch the threshold
function.
NOTE: If the acquisition times out (after four minutes), you can select Abort to restart the adjust set-
tings step or Next to accept the settings and continue to the next step.
5. Select Next when you have completed the adjustments.
6. Fine tune the settings for the ATM (Ser1981) vs. H2A.X (Ser139) plot, if necessary.
• SETTING THE GATE: To set the quadrant marker properly, prepare a control cell sample (no DNA damage)
and place the cell population in the lower left (LL) quadrant of the quadrant stat. This will represent your
negative cells.
• Adjust the slider bars (on the X and Y-axis) to place all populations: Negative (LL), pATM, single positive
(UL), pH2A.X, single positive (LR), and DNA double-strand breaks (UR) on scale. If the cell sample is not
treated and healthy (e.g. No DNA damage) a great majority of the cell population will fall in the “Negative”
(lower left) quadrant. Adjust the quadrant markers to place the cell population(s) immediately in the
lower left quadrant (see diagram below).
• Adjust the quadrant markers. You can move the marker intersection in any direction, as well as adjust the
angle of each line. To move the markers as they are, touch the open circle at the intersection and drag the
markers to make large changes, or touch the arrow buttons below the plot to make small changes (A). To
Capture cell
population of
interest by
adjusting the
CELL SIZE
INDEX slider bar
on the X-axis.
Touch threshold
to activate and
adjust left/right to
exclude cell
debris.
Fine tune
threshold
adjustments by
using the
arrows below.

Muse
®
Multi-Color DNA Damage Kit
For Research Use Only 9
adjust the angle of either line, touch the solid circle and drag in an arc, or touch the arrow buttons below
the plot (B and C).
7. Se lect Next when the marker adjustments are complete.
8. Verify the settings. If the settings are correct, select Next. Otherwise, select Back and repeat steps 4 through
7, as necessary.
A. Moving the quadrant marker B. Adjusting the X-axis C. Adjusting the Y-axis

Muse
®
Multi-Color DNA Damage Kit
For Research Use Only 10
9. Enter the sample ID by touching the field, then using the keypad to input the ID. Touch Done when you’re fin-
ished entering the ID. If necessary, change the Events to Acquire by touching the field, then selecting the value
from the pop-up menu. Select Next.
10. Follow the onscreen instructions and mix the first sample. Load the sample on the instrument loading arm.
Select Run to acquire the sample.
During acquisition, live sta-
tistical values are gener-
ated and represented on a
dot plot graph. Quantitative
measurements include
Negative, single positive
ATM phosphorylation, sin-
gle positive H2A.X phos-
phorylation, and DNA
double-stranded breaks

Muse
®
Multi-Color DNA Damage Kit
For Research Use Only 11
11. When acquisition is complete, the results are displayed. If desired, select Plots to display a dot plot and a bar
graph for the sample.
You can view or change the sample ID, as well as add annotations for the current sample by selecting the
“Samp le Info.” Tab. To print the results for the current sample select the printer tab.
12. (Optional) If changes are needed to the gates assigned, touch the dot plot to enlarge it, then adjust the cell
size gate according, as described in steps 4 and 6, respectively. You cannot adjust the cell size threshold after
the sample has been acquired.
If you adjust the gate on subsequent samples and wish to apply the changes to other samples that you already
acquired, select the Apply Changes button in the title bar. Select the samples you want to apply the changes
to or choose Select All, then select Apply. The sample you originally made changes to must be selected.
Select to
display
plots
Select to
hide plots
Select to apply
changes to other
samples.

Muse
®
Multi-Color DNA Damage Kit
For Research Use Only 12
13. If no adjustments are needed, select Next Run and repeat steps 9 through 12 for the remaining samples.
NOTE: During the run, a message may appear prompting you to load a tube of DI water for a Quick Clean.
Load the water then select Clean to perform the Quick Clean. Select Next to continue with the run.
The frequency of Quick Cleans was set by your system administrator. Your administrator may also
have chosen to allow you to skip the Quick Clean when the prompt appears. You can choose to per-
form additional Quick Cleans at any time during a run by selecting Clean in the title bar, then Quick
Clean from the menu.
14. When you have acquired the last sample, select Finish.
15. (Optional) Select Options in the title bar to rename the data set, export the data set, save the current instru-
ment settings, or view the event log. Refer to the Guava Muse Cell Analyzer User’s Guide for more informa-
tion.
Results
The software performs calculations and displays the data in three ways:
• A dot plot displaying cells which are negative (e.g. no DNA damage), ATM phosphorylated only, H2A.X
phosphorylated only, and DNA double-strand breaks (ATM + H2A.X co-activated) on quadrant plot.
• Quantitative percentage (%) measurements of the total events in a table format: Percentages of negative,
ATM phosphorylated only, H2A.X phosphorylated only, and dual activation (DNA double strand breaks).
• Summarized DNA damage results: Total DNA damage and DNA double-strand breaks (number of cells
per microliter), and total percentage of DNA damage (DSBs).
Results from each run are stored in a data file, as well as its corresponding spreadsheet (CSV) file. The data file
and spreadsheet file contain the following statistics:
• Sample Number

Muse
®
Multi-Color DNA Damage Kit
For Research Use Only 13
• Sample ID
• Percent totals for the Negative / only ATM phosphorylated / only H2A.X phosphorylated / Dual activation
indicating DNA double-strand break cell types
Figures A and B. HeLa cells were exposed to 10 M Etoposide for 24 hours to induce DNA damage, and then
stained with both anti-phospho-Histone H2A.X (Ser139) and anti-phospho-ATM (Ser1981) antibodies in multi-
plex. Samples were acquired using the Guava® Muse® Cell Analyzer and statistical results are shown above. Fig-
ure A shows the results summary, while Figure B shows results displayed in dot plot format.
The statistics captured in this assay show the relative percentages for each population as it is calculated within the
total cell population. Cells which express ATM, H2A.X, or both can be seen by the data on upper left, lower right,
and upper right quadrants of the dot plot, respectively. In this cell population, 64.5% shows co-activation of ATM
and H2A.X upon treatment, indicating DNA damage and double-strand breaks is present.
Technical Tips
1. For cellular staining and analysis to be most effective, make sure that test cells have good viability prior to use.
2. For certain cell cultures cell pellets may become hazy or transparent following the fixation step, making it dif-
ficult to see. If sampling a small collection of cells for flow analysis, it is recommended that all steps be per-
formed in a smaller collection tube (e.g. centrifuge tube).
3. Do not mix or interchange reagents from various kit lots.
4. Mix each cell sample thoroughly on a mixer before acquiring samples for consistent and accurate results.
However, avoid vigorous mixing, which can cause cellular breakdown and splashing, resulting in volume loss
and erroneous results.
5. The default number of events to acquire is 1000 events. You may select a different number, however, your sta-
tistical error will increase as you decrease the number of acquisition events.
6. If results deviate from expected values, prepare a freshly stained sample and reacquire the data.

Muse
®
Multi-Color DNA Damage Kit
For Research Use Only 14
7. Periodically run Quick Clean using a tube of DI water (after every 20 sample acquisitions) to prevent a buildup
from cellular debris in the system. If your samples contain significant amounts of cellular debris, run the Quick
Clean cycle more often to prevent clogs or blockage.
8. If you are acquiring data from a sample but the progress bar is not moving, there is probably either insufficient
volume to continue to acquire the sample or a blockage of the flow system. First check to ensure that there is
at least 100 µL of sample in the tube. If not, add additional buffer to bring the volume up to 100 µL or proceed
to the next sample. If the sample volume is greater than 100µL, then the lack of events is probably due to a
clog. A clog or blockage can be caused by cell aggregates, cell debris, bleach crystals, or other particulates.
Perform a backflush to flush out the clog into a tube containing 20% bleach. Then run Quick Clean to remove
bleach residue. If this procedure does not alleviate the problem, refer to the Guava® Muse® Cell Analyzer
User’s Guide for additional troubleshooting tips, or contact Luminex Technical Support for help.
9. The Muse Multi-Color DNA Damage Kit works best with samples in single cell suspension. Cell aggregates
may clog or be excluded from the flow cell, affecting the accuracy of the results. If you wish to use the Muse
Multi-Color DNA Damage Kit with a “clumpy” cell line, it is recommended to order Muse Cell Dispersal
Reagent (Catalog No. MCH100107) to disaggregate the cells. Contact customer service or visit our website at
www.luminexcorp.com for detailed information on the Muse Cell Dispersal Reagent and assay method. For
more troubleshooting tips refer to the Guava Muse Cell Analyzer User’s Guide.
For more information, contact Luminex Technical Support.

Muse
®
Multi-Color DNA Damage Kit
For Research Use Only 15
Troubleshooting
Related Products
1. Muse® H2A.X Activation Dual Detection Kit (Catalog No. MCH200101)
2. Muse® EGFR-RTK Activation Dual Detection Kit (Catalog No. MCH200102)
3. Muse® PI3K Activation Dual Detection Kit (Catalog No. MCH200103)
4. Muse® MAPK Activation Dual Detection Kit (Catalog No. MCH200104)
Potential Problems Experimental Suggestions
Acquisition taking longer than expected or
progress bar stops
during acquisition
Ensure that the System Check procedure was run and passed. If the
progress bar stops during acquisition, the fluid system may be clogged.
Run a Quick Clean procedure to clean the capillary. It can be performed
during or after an assay.
Instrument clogging If the instrument is clogged, run a Quick Clean procedure to clean the
capillary. It can be performed at anytime during an assay between sam-
ples.
No detectable phosphorylation / activation in
testing samples
Since phospho-specific activation can be very quick, transient
responses, in order to capture this phosphorylation event samples must
be immediately fixed to “freeze” the given activation state in time.
Low Cell Concentration warning during acqui-
sition
Ensure that cells are counted properly prior to beginning the experi-
ment. The assay instructions are optimized to give you a range of cells
between 300–700 cells/μL in the final sample volume so accurate pop-
ulation count results are obtained. A substantial decrease in cell num-
bers can lead to difficulty in adjusting settings.
High Cell Concentration warning during acqui-
sition
If the concentration of the stained cell sample is high (>1200 cells/μL),
dilute the sample further with Assay Buffer to adjust the cell concentra-
tion between 300 and 700 cells/μL.
High %CVs (wide peaks) or false peak Although the assay procedure has been optimized to function for multi-
ple cells types, every cell line behaves differently. The wide peaks or
false peak may indicate that:
The sample is poorly fixed and stained as a result of cell aggregates.
Ensure your sample is a single-cell suspension before fixing and stain-
ing.
Cell concentration is too high. Decrease the number of cells by diluting
the sample to
300–700 cells/μL. The Guava® Muse® Cell Analyzer gives the most
accurate data when the flow rate is between 300 and 700 cells/μL.
Low level of staining Although the assay procedure has been optimized to function utilizing
multiple cell types, every cell line behaves differently. A low signal may
indicate that the cells need to be stained at a higher volume.
Verify that the System Check procedure was performed and the results
passed.

Muse
®
Multi-Color DNA Damage Kit
For Research Use Only 16
5. Muse® Bcl-2 Activation Dual Detection Kit (Catalog No. MCH200105)
6. Muse® PI3K/MAPK Dual Pathway Activation Kit (Catalog No. MCH200108)
7. Muse® System Check Kit (Catalog No. MCH100101)
8. Muse® Count & Viability Kit (100T) (Catalog No. MCH100102)
9. Muse® Annexin V & Dead Cell Kit (Catalog No. MCH100105)
10. Muse® Cell Dispersal Reagent (Catalog No. MCH100107)
References
1. Bakkenist, C.J., et al. (2003). DNA damage activates ATM through intermolecular autophosphorylation and
dimer dissociation. Nature; 421(6922):499-506.
2. Wu, X., et al. (2000). ATM phosphorylation of Nijmegen breakage syndrome protein is required in a DNA
damage response. Nature; 405(6785):477-82.
3. Powers, J.T., et al. (2004). E2F1 uses the ATM signaling pathway to induce p53 and Chk2 phosphorylation and
apoptosis. Mol. Cancer Res.; 2(4):203-14.
4. Burma, S., et al. (2001). ATM Phosphorylates Histone H2AX in Response to DNA Double-strand Breaks. J.
Biol. Chem.; 276(45):42462-7.
5. Bassing, C.H., et al. (2003). Histone H2AX: a dosage-dependent suppressor of oncogenic translocations and
tumors. Cell; 114(3):359-70.
6. Paull, T.T., et al. (2000). A critical role for histone H2AX in recruitment of repair factors to nuclear foci after
DNA damage. Curr Biol.; 10(15):886-95.
7. Muslimovic, A., et al. (2008). An optimized method for measurement of gamma-H2AX in blood mononuclear
and cultured cells. Nat Protoc.; 3(7):1187-93.
8. Tanaka, T., et al. (2007). Cytometry of ATM Activation and Histone H2AX Phosphorylation to Estimate Extent
of DNA Damage Induced by Exogenous Agents. Cytometry; 71A:648-661.
© 2009 - 2020: Luminex Corporation. All rights reserved. No part of these works may be reproduced in any form
without permission in writing.
Guava and Muse are trademarks of Luminex Corporation, registered in the U.S. and other countries.
