PARTY FACTIONS AMONG THE VOTERS
Stephen K. Medvic
a*
and Berwood A. Yost
b
Prepared for delivery at the 2021 State of the Parties: 2020 and Beyond Virtual
Conference, November 4 – 5, 2021. The Ray C. Bliss Institute of Applied Politics, The University
of Akron
a
Department of Government, Franklin & Marshall College
b
Center for Opinion Research, Floyd Institute for Public Policy, Franklin & Marshall College
* Corresponding author: stephen.medvic@fandm.edu

1
Party Factions Among the Voters
“A classic issue in studies of party organizations,” Pippa Norris (1995) noted some
twenty-five years ago, “is how we explain party division and ideological conflict” (29). This
long-standing interest among party scholars notwithstanding, the study of party factions has
experienced something of a resurgence in recent years (see, for example, Noel 2016; Hansen,
Hirano, and Snyder 2017; Thomsen 2017; Conger, et al. 2019; Clarke 2020; Blum 2020; and
Masket 2020). Much of that work, as much of the scholarship on factions generally, focuses on
factions among party elites, particularly members of Congress. This study contributes to our
understanding of party factions by exploring factional affiliation among voters. Most partisans
are willing to identify with one of the factions in their party and significant differences exist
between co-partisans who affiliate with different factions in the party.
The Study of Factions
Concern that part of a polity might organize to advance its own interests, rather than
the common good, has a long history. First as “factions” and later as “parties,” these “partial”
entities have long been viewed skeptically. As Bolingbroke famously wrote, “party is a political
evil, and faction is the worst of all parties” (Bolingbroke 1997 [1738], 257).
Attempting to understand the nature of parties perhaps more dispassionately, political
scientists turned their attention to factions in the middle of the twentieth century.
1
In his
analysis of factions in the one-party South, V.O. Key (1949) initially defined a faction as “any
combination, clique, or grouping of voters and political leaders who unite at a particular time in
1
Sartori (1976) resisted the use of the term “faction” to describe party sub-units and maintained that American
political scientists were largely responsible for the adoption of the term, which, to his mind, had been done
“unfelicitously” (72).

2
support of a candidate” (16). He would later use the term, more generally, to refer to an
“informal party-system-within-a-party” (Key 1958, 320).
2
For Austin Ranney and Willmoore
Kendall (1956), if a political party is “a large-scale organization whose purpose is to control the
personnel and policies of the government,” a faction is “an element inside a party whose
purpose is to control the personnel and policies of the party” (126, emphases in original).
Notwithstanding Key’s inclusion of voters in his original conceptualization, most studies
of factions consider them an elite phenomenon. Richard Rose’s (1964) classic treatment is
emblematic. A faction, argued Rose, is “a group of individuals based on representatives in
Parliament who seek to further a broad range of policies through consciously organized political
activity” (37; see also Rose 1974, 313). That is, factions have “membership based in Parliament,
rather than in the civil service or elsewhere” (1964, 37). As we’ll see, studies of American party
factions tend to focus on elected officials and party activists and only rarely on voters.
Conceptualizations of factions commonly point to, among other elements, their
organizational capacity (DiSalvo 2012, 5). Factions are said to have “an organizational
hierarchy” (Key 1958, 320); to be “organized to act collectively” (Zariski 1960, 33); to be “self-
consciously organized as a body” (Rose 1964, 37); to have met “the minimal characteristics of a
rudimentary organization” (Roback and James 1978, 340); and to be “strongly organized
groups” (Panebianco 1988, 38). Nevertheless, some scholars deemphasize factional
organization, or at least organizational forms, and highlight factional activity. Building on Beller
and Belloni’s (1978) conclusion that “what is significant about factions ultimately is their
activity and its consequences – not their structural properties” (448, emphasis in original),
2
Similarly, and more recently, Rachel Blum (2020) describes factions as “miniature parties within parties” (13).
3
Françoise Boucek (2009) argues for recognizing that factionalism is “a dynamic process of
subgroup partitioning” (468, emphasis in original). Factional dynamics, for Boucek, are
“interactions between factions, host parties and voters” (Ibid.).
Of course, it is the purpose of factions, the reason they form and are organized in the
first place, that matters most. Rose (1964) notes that they “seek to further a broad range of
policies” (37); Key (1958) maintains that they have “a recognizable policy orientation” (320);
Zariski (1960) points to “a sense of common identity and common purpose” (33) and to the fact
that they “compete for the acquisition of influence over the principal institutions of intra-party
government, over the formulation of party policy, and over the selection of party leaders and
party nominees for public office” (29); and Polsby (1983) writes that they act “in pursuit of a
common interest” (65). Very often, the common purpose pursued by factions is thought to be
an ideological one. Indeed, ideological contestation is central to DiSalvo’s (2012) definition of
factions as party subunits that have “(1) the ideological consistency, (2) the organizational
capacity, and (3) the temporal durability to (4) undertake significant actions to shift a party’s
agenda priorities and reputation along the Left-Right spectrum” (5).
Studies of factions in American politics typically focus on political elites. For instance, in
his historical analysis of factions, DiSalvo maintains that factions are “networks that are
comprised of officeholders, organizational officers, and outside groups” (26). Noting that there
are, essentially, two types of factions – those that aim to preserve the status quo and those
that want to change it – he identifies at least twelve party factions that have existed (through
2007) since the end of the Civil War (11). The latest of these is the New Democrat faction
(1986-2007). For DiSalvo, these factions have played five roles in American political history:
4
they generate new ideas; influence the presidential nomination process; alter the power
dynamics in Congress; affect a president’s ability to govern; and impact state building (9-10).
Each of these, of course, is fundamentally the result of elite activity.
Members of Congress are the most common subject of studies of American factions.
Measures based on roll call votes (e.g., DW-NOMINATE scores) are often used to identify
differences between factions or to determine factional membership. For instance, using
NOMINATE scores as well as vote scores from Americans for Democratic Action and National
Journal, Medvic (2007) found that in the 106
th
Congress, New Democrats were significantly
more conservative than “traditional” Democrats but significantly less conservative than “Blue
Dog” Democrats. Those with membership in the New Democrat Coalition were also less liberal
on economic policy, but more liberal on foreign policy, than those not in the centrist coalition.
Noel (2016) uses both dimensions of the NOMINATE measure to show that, in 2016,
endorsements of presidential candidates considered to be “ideologues” rather than “regulars”
were more likely to come from Republican members of Congress who are more ideologically
extreme (first NOMINATE dimension) and are “outsiders” (second dimension; 179). Factional
distinctions didn’t appear as clearly among Democratic members of Congress (183). Clarke
(2020) uses NOMINATE scores for members of nine organized factions (five Republican and four
Democratic) in the House between 1995 and 2018 to demonstrate that factions “are eager to
distinguish themselves from their peers” (460). While Democratic factions “occupy distinct
regions of the ideological spectrum,” Republican factions “appear to cluster more heavily on
the right tail of the party’s distribution” (459). And Blum (2020) finds that Republican members
5
of three Tea Party-related House caucuses had more conservative NOMINATE scores than
“establishment” Republicans (85-6).
Additional analysis by Blum reveals differences between Tea Party and establishment
Republicans in terms of co-sponsorship of legislation (90-1) and the policy focus of press
releases (91-7). Clarke (2020) also utilizes press releases from faction leaders to identify
patterns that “closely mirror the branding capacity of each organization” (465). Thomsen
(2017) studied new members of the House and their decisions to join seven House caucuses
(four Republican and three Democratic). She found that “almost all incoming members joined
an ideological faction when they entered office” and that the moderate factions in both parties
attracted fewer members (749).
Candidates have also been the subject of recent work on factions. As part of the 2018
Primary Project at the Brookings Institution, Kamarck and Podkul (2018) used candidate self-
descriptions on campaign websites and a “four-step assignment logic” to assign congressional
candidates from the 2014, 2016, and 2018 election cycles to several factions in each party. For
Republicans, the factions were Business/Establishment, Conservative, Tea Party, and
Libertarian; for Democrats, they were Progressive, Establishment, and Moderate. The purpose
of such assignments was not only to gauge the level of candidate affiliation with each faction
but to determine the primary success rates of the factions. Kamarck and Podkul found that,
among non-incumbent candidates in both parties, establishment candidates performed better
than their more ideological counterparts.
Some studies look for factional activity among party leaders, operatives, activists, and
donors. Noel (2016), for example, determines whether party activists (i.e., those who had done
6
at least two of four political activities or had been a paid staffer, a candidate, or a party official)
fall into the “party regular” - or compromiser, pragmatist, insider or establishment - camp or
the ideologue faction (171). He then examines support for presidential candidates among
activists in 2016 based on the activists’ factional categorization (180 and 184). Masket (2020)
charts patterns of staffing in Democratic presidential campaigns in 2016 and 2020 and finds
“clear signs of persistent factionalism” (183). He also analyzed campaign donation patterns for
Democrats in gubernatorial elections between 2016 and 2017-2018 and the presidential
nomination process in 2016 and 2020. In both instances, Masket finds evidence of factional
behavior among establishment and progressive Democrats (164-81). Similarly, Clarke’s (2020)
examination of the donor base of members of Congress produced results that support the
hypothesis that “Joining a conservative (liberal) faction will lead to a more conservative (liberal)
donor base, conditional on the institutional strength of the faction” (455).
Most of Blum’s (2020) study of the Tea Party is based on interviews with, and
observations of, activists and organizations associated with the movement. In addition, she
surveys delegates to the 2013 convention of the Republican Party of Virginia and finds
significant differences in the attitudes of Tea Party and establishment Republicans. Several
studies focus was on delegates to the parties’ national conventions. Reiter (2004) posits three
types of factions (kaleidoscopic, consensus, and persistent) and analyzes convention roll call
votes for much of the history of the two parties. His results suggest a decided shift in the
middle of the twentieth century toward persistent, or ideological, factionalism (267). More
recently, Conger, et al. (2019) use the 2012 Convention Delegate Study to conduct “a
nonhierarchical cluster analysis of delegates’ group memberships, policy attitudes, and affect
7
toward party constituencies” (1382). Their analysis identifies three factions in each party and
determines the level of party support and pragmatism in party decision-making for all six
factions. Establishment Republicans are most supportive of the GOP and are pragmatic in their
views of party decision-making; Contemporary Conservatives and Libertarians are less
supportive of the GOP and demand ideological purity in the party (1398). In the Democratic
Party, factionalism was not as pronounced, perhaps because the 2012 nomination was not
contested, and all three factions were relatively supportive of the party. However, “All-Purpose
Liberals and Cultural Liberals are motivated more by policy demands than Centrists, and All-
Purpose Liberals are more purist than Centrists” (1399).
Few studies examine voters’ factional affiliations and those that do tend to distinguish
factions based on voting behavior. Carmines, Ensley, and Wagner (2016) calculate the
contribution of liberals, conservatives, moderates, libertarians, and populists to each party’s
presidential coalitions in 2012. In the Republican Party, conservatives constituted a majority
(54 percent) of the party’s coalition, followed by libertarians (28 percent; 392). Liberals made
up a plurality (37 percent) of the Democratic coalition, followed by moderates (23 percent) and
populists (20 percent; 393). Hansen, Hirano, and Snyder (2017) examine county-level primary
results for seven statewide offices in four states – Louisiana, Minnesota, North Dakota, and
Wisconsin – throughout much of the twentieth century. Each of their cases was a one-party
state during the period under consideration, which likely amplified the incentives for factional
activity. Their results indicate a clear connection between factional groupings of voters and
factional organizations that were active in each state. “In all four states,” they write, “the most
8
important work the factions did for voters was identification, attaching labels to candidates and
thereby classifying individuals as members of teams” (183).
Several recent studies attempt to explain support for Donald Trump within the
Republican Party. Rapaport, Reilly, and Stone (2020) utilize a YouGov panel survey that
interviewed Republican voters two weeks before the 2016 New Hampshire primary and again in
March of 2018. The authors find three groups of Republicans – those who indicated a
preference for Trump from the beginning of the process (“Always Trump”); those who
preferred a different Republican nominee but indicated they could support Trump in the
general election (“Maybe Trump”); and those who favored a different nominee and could not
support Trump in the general (“Never Trump;” 698-9). The analysis seeks to determine
factional influence on evaluations of Trump, the Republican Party, and the Tea Party, as well as
support for Trump’s border wall. The results indicate
that the factional structure within the Republican Party had shifted by early in Trump’s
presidency from one where the Trump nomination candidacy was substantially
orthogonal to support for the Republican Party, to one where support for the
Republican party was tied more closely not only to evaluations of Trump, but also to his
signature policy and to a potential rival faction defined by support for the Tea Party.
(704-5)
Like Rapaport, Reilly, and Snyder, Barber and Pope (2019) divide Republicans into three
groups based on their support for Trump in the primaries and in the general election. They
then determine the levels of symbolic, operational, and conceptual ideology of the three
groups. Republicans supportive of Trump in both the primaries and the general election were
found to have a high level of symbolic conservatism, a medium level of operational
conservatism, and a low level of conceptual conservatism. Those who supported Trump only
during the general election had high levels of symbolic and operational conservatism and a
9
medium level of conceptual conservatism. “Never Trump” Republicans were low in symbolic
and operational conservatism and had a medium level of conceptual conservatism (732).
In seeking to explain support for Donald Trump during the general election in 2016,
Ekins (2017) finds five unique types of Trump voters – Staunch Conservatives, Free Marketeers,
American Preservationists, Anti-Elites, and the Disengaged. Levels of support for the
Republican Party varies among these groups and “they hold vastly different views on
immigration, American identity, race, economics, and moral traditionalism” as well as “different
perceptions of justice in the political and economic systems” (30).
Drutman (2017) draws on the Voter Study Group’s 2016 VOTER Survey to identify
divisions within both parties based on primary vote choice. He finds more internal division
within the Republican Party than the Democratic Party. Nevertheless, Clinton and Sanders
Democrats were divided on trade, enthusiasm about America and its history, and pessimism
about people like them being “in decline.” “[T]o the extent that the Democratic Party is
divided,” writes Drutman, “these divisions are more about faith in the political system and
general disaffection than they are about issue positions” (18). For Republicans, “Trump’s
biggest enthusiasts within the party are Republicans who hold the most anti-immigrant and
anti-Muslim views, demonstrate the most racial resentment, and are most likely to view Social
Security and Medicare as important” (21).
The analysis that follows also seeks to understand factions among the voters within
each party. However, we rely on voter characteristics, including their demographic
characteristics, political and ideological self-identification, economic assessments, and issue

10
preferences rather than their vote choices to predict self-identified factional affiliation. In
doing so, we believe we offer a unique approach to the study of factions within the electorate.
Methods
The data presented in this paper come from three surveys conducted among 1,521
randomly selected registered voters in the state of Pennsylvania. Survey interviews were
conducted March 1 - 7 (269 Democrats, 236 Republicans, and 82 independents), June 7 - 13
(205 Democrats, 177 Republicans, and 62 independents), and August 9 - 15, 2021 (207
Democrats, 173 Republicans, and 66 independents). The voter samples were obtained from
Marketing Systems Group. All sampled respondents were notified by mail about the survey.
Interviews were completed over the phone and online depending on each respondent's
preference. Survey results were weighted (age, gender, education, geography, and party
registration) using an iterative weighting algorithm to reflect the known distribution of those
characteristics. Estimates for age, geography, and party registration are based on active voters
within the PA Department of State's voter registration data. Gender and education is estimated
using data from the November 2018 CPS Voter Registration Supplement.
3
In each survey, respondents were asked the following series of questions to identify the
party faction to which they most closely identify.
PARTY. Regardless of how you are registered in politics, as of today, do you think of
yourself as a Republican, a Democrat, or an Independent?
4
3
Data downloaded from IPUMS-CPS, University of Minnesota, www.ipums.org, accessed 12/31/2019.
4
The survey also included a question about actual voter registration since all voters in Pennsylvania choose a party
affiliation when they register to vote. Registration and party identification do not correspond perfectly in the state
and party identification, as asked in this question, tends to be a superior indicator of current partisanship in the
state (Yost, 2003).

11
Those who responded "independent" to the PARTY question were asked if they lean toward a
party and, if so, were asked the appropriate faction question. True independents were not
asked a faction question. The faction questions were:
RFact. The Republican Party includes several different wings or factions. In the
Republican Party, for example, there seems to be a faction that embraces Donald
Trump's brand of politics and another that is aligned with a more traditional brand of
Republican politics. Do you think of yourself as a Trump Republican, a traditional
Republican, or something else?
DFact. The Democratic Party includes several different wings or factions. In the
Democratic Party, for example, there seems to be a faction that embraces a consistently
progressive brand of politics and another that is aligned with a more pragmatic, centrist
brand of politics. Do you think of yourself as a progressive Democrat, a centrist
Democrat, or something else?
One might reasonably ask whether voters know enough about the factions within each
party to meaningfully affiliate with one of them. Given the amount of media discussion of
factions in recent years, we believe they can.
5
Furthermore, we believe the brief descriptions
of the factions used in our questions give voters enough information to make valid choices, and,
empirically, the consistency of the responses across all three of our surveys suggests that this
approach is reliable.
Results
Among the partisan identifiers included in these surveys, the factional breakdown for
Republicans is Trump Republican 47 percent, Traditional Republican 34 percent, and other
Republican 19 percent. The factional breakdown for Democrats is Centrist Democrat 44
percent, Progressive Democrat 39 percent, and other Democrat 18 percent. The distribution of
5
For just a sample of recent journalistic accounts of factions in the parties, see Bacon (2019), Haberman (2021),
and Olsen (2021).

12
factional choices were relatively consistent for respondents in both parties from survey period
to survey period (see Table 1).
Table 1. Distribution of Respondents by Party Faction and Survey Period
Trump R Traditional R Other R Other D Centrist D Progressive D
(n=303) (n=221) (n=120) (n=99) (n=239) (n=206)
Survey Period
August 95.4 (31.5) 63.4 (28.6) 41.2 (34.5) 32.7 (32.9) 63.6 (26.6) 59.4 (28.9)
June 96.2 (31.7) 57.3 (25.9) 33.3 (27.9) 30.8 (31.0) 67.9 (28.4) 66.7 (32.4)
March 111.6 (36.8) 100.9 (45.5) 44.9 (37.6) 35.9 (36.1) 107.4 (44.9) 79.6 (38.7)
Tables 2 and 3 display the distribution of respondents within each party faction by self-
described ideology, party affiliation, born-again Christian, gender, age, education, race, income,
and rural-urban classification.

13
Table 2. Distribution of Respondents by Party Faction and Selected Demographics, Republicans
Trump R
Traditional R Other R
(n=303)
(n=221) (n=120)
Ideology (%)
Extremely liberal
0.0 (0.0)
0.0 (0.0) 0.8 (0.8)
Liberal
8.3 (3.7)
4.5 (2.8) 1.2 (1.2)
Moderate
29.0 (12.9)
61.8 (38.5) 38.3 (39.0)
conservative
81.8 (36.4)
45.2 (28.2) 31.3 (31.9)
Extremely conservative
94.4 (42.0)
43.8 (27.3) 17.1 (17.4)
DK
11.4 (5.0)
5.2 (3.3) 9.5 (9.7)
Party Affiliation (%)
Strong Republican
193.6 (63.8)
90.1 (40.7) 36.5 (30.5)
Republican
47.2 (15.6)
68.5 (30.9) 18.5 (15.4)
Lean Republican
62.5 (20.6)
62.8 (28.4) 64.5 (54.0)
Independent
0.0 (0.0)
0.0 (0.0) 0.0 (0.0)
Lean Democrat
0.0 (0.0)
0.0 (0.0) 0.0 (0.0)
Democrat
0.0 (0.0)
0.0 (0.0) 0.0 (0.0)
Strong Democrat
0.0 (0.0)
0.0 (0.0) 0.0 (0.0)
DK
0.0 (0.0)
0.0 (0.0) 0.0 (0.0)
Identifies as born-again Christian (%)
Yes
111.1 (37.4)
66.1 (29.9) 28.0 (23.9)
No
178.0 (59.9)
149.5 (67.6) 83.5 (71.2)
DK
8.2 (2.8)
5.4 (2.4) 5.7 (4.9)
Gender (%)
Male
187.9 (62.1)
119.1 (54.1) 80.4 (68.2)
Female
114.8 (37.9)
101.2 (45.9) 37.5 (31.8)
Non-binary
0.0 (0.0)
0.0 (0.0) 0.0 (0.0)
Age (%)
Under 35
22.1 (7.3)
22.1 (10.0) 19.7 (16.5)
35 - 54
103.3 (34.1)
71.2 (32.1) 56.2 (47.0)
Over 55
177.8 (58.6)
128.2 (57.9) 43.6 (36.5)
Educational attainment (%)
HS or less
98.8 (32.6)
51.8 (23.4) 20.6 (17.2)
Some college
127.4 (42.0)
91.5 (41.3) 46.2 (38.7)
College degree
77.0 (25.4)
78.3 (35.3) 52.7 (44.1)
Racial group (%)
Non-white
25.6 (8.5)
16.8 (7.6) 17.1 (14.3)
Income (%)
Less than $35,000
57.4 (22.8)
38.9 (20.8) 8.0 (7.5)
$35 -75,000
90.9 (36.0)
74.3 (39.7) 34.7 (32.3)
Over $75,000
103.9 (41.2)
73.9 (39.5) 64.6 (60.2)
Urban rural classification (%)
Large central metro
24.0 (7.9)
28.7 (12.9) 11.8 (9.9)
Large fringe metro
76.1 (25.1)
55.5 (25.0) 40.1 (33.6)
Medium metro
103.5 (34.1)
70.6 (31.9) 38.3 (32.1)
Small metro
40.4 (13.3)
25.9 (11.7) 11.9 (9.9)
Micropolitan
36.5 (12.0)
29.0 (13.1) 11.2 (9.4)
Noncore
22.7 (7.5)
11.9 (5.4) 6.1 (5.1)

14
Table 3. Distribution of Respondents by Party Faction and Selected Demographics, Democrats
Other D
Centrist D
Progressive D
(n=99)
(n=239)
(n=206)
Ideology (%)
Extremely liberal
10.9 (14.0)
7.1 (4.3)
44.5 (31.5)
Liberal 14.3
(18.4)
49.5 (29.8)
38.2 (27.0)
Moderate
32.6 (41.8)
97.1 (58.5)
44.4 (31.4)
conservative
10.2 (13.1)
7.4 (4.5)
7.8 (5.5)
Extremely conservative
1.0 (1.3)
0.0 (0.0)
4.2 (3.0)
DK
8.9 (11.4)
4.8 (2.9)
2.3 (1.6)
Party Affiliation (%)
Strong Republican
0.0 (0.0)
0.0 (0.0)
0.0 (0.0)
Republican
0.0 (0.0)
0.0 (0.0)
0.0 (0.0)
Lean Republican
0.0 (0.0)
0.0 (0.0)
0.0 (0.0)
Independent
0.0 (0.0)
0.2 (0.1)
0.0 (0.0)
Lean Democrat
44.5 (44.8)
53.2 (22.3)
57.3 (27.9)
Democrat
17.3 (17.4)
45.4 (19.0)
33.9 (16.5)
Strong Democrat
37.6 (37.9)
140.1 (58.7)
114.4 (55.6)
DK
0.0 (0.0)
0.0 (0.0)
0.0 (0.0)
Identifies as born-again Christian (%)
Yes
17.0 (18.1)
31.9 (13.4)
21.5 (10.6)
No
77.1 (81.9)
201.2 (84.7)
180.8 (88.8)
DK
0.0 (0.0)
4.4 (1.9)
1.4 (0.7)
Gender (%)
Male
36.0 (36.2)
79.6 (33.3)
83.8 (40.9)
Female
63.4 (63.8)
159.3 (66.7)
120.4 (58.7)
Non-binary
0.0 (0.0)
0.0 (0.0)
0.9 (0.4)
Age (%)
Under 35
11.7 (11.7)
17.1 (7.1)
37.3 (18.1)
35 - 54
26.3 (26.5)
64.3 (26.9)
71.5
(34.8)
Over 55
61.5 (61.8)
157.6 (66.0)
96.9 (47.1)
Educational attainment (%)
HS or less
26.2 (26.3)
33.7 (14.1)
31.4 (15.3)
Some college
31.9 (32.1)
60.4 (25.3)
55.7 (27.1)
College degree
41.3 (41.5)
144.8 (60.6)
118.5 (57.6)
Racial group (%)
Non-white
19.1 (19.2)
25.0 (10.5)
51.7 (25.2)
Income (%)
Less than $35,000
31.8 (36.8)
33.8 (16.1)
39.7 (21.0)
$35 -75,000
27.3 (31.6)
57.8 (27.5)
59.8 (31.7)
Over $75,000
27.3 (31.6)
118.9 (56.5)
89.3 (47.3)
Urban rural classification (%)
Large central metro
30.4 (30.8)
56.3 (23.6)
77.7 (37.9)
Large fringe metro
26.6 (26.9)
105.9 (44.3)
57.8 (28.2)
Medium metro
30.2 (30.6)
56.9 (23.8)
42.3 (20.7)
Small metro
5.6 (5.7)
8.4 (3.5)
13.5 (6.6)
Micropolitan
4.6 (4.7)
6.4 (2.7)
11.5 (5.6)
Noncore
1.4 (1.4)
5.0 (2.1)
2.1 (1.0)
We analyze our data with two logistic regression models, one fit to self-identified
Democratic respondents and the other fit to self-identified Republican respondents. These
analyses began with models that incorporated demographic, political, economic, and issue

15
variables to predict the odds of belonging to either the Trump faction of the Republican Party
or the Progressive faction of the Democratic Party.
The full models for members of both parties included veteran status, religious
denomination, being a born-again Christian, age, educational attainment, employment status,
urban-rural classification,
6
labor union membership, race, gender, direction of the United
States, ratings of President Biden, political ideology, need for government action on climate
change, economic optimism, support for gun control, support for abortion rights, and racial
attitudes.
Economic optimism is calculated by summing the responses to evaluations of personal
finances compared to last year and evaluations of expected personal finances next year, and
dividing by two. For each item, those who responded “better off” scored a 1, those who
responded “same” scored 0.5, and those who responded “worse off” were scored 0.
The racial attitudes scale included three items (α = .69) from the FIRE battery (DeSante
and Smith 2020). Respondents were asked to report how much they agreed with each
statement: I am angry that racism exists; white people in the US have certain advantages
because of the color of their skin; and racial problems in the US are rare, isolated situations. A
strongly agree response was scored as 2 points while an agree response counted as 1 point for
all items except for the third question, which was reverse scored. The items were summed and
divided by six to create a score ranging from 0 – 1.
Items that were not significant in these original models were removed to arrive at the
final reported models. The entire set of variables included in these three surveys and a
6
Classification based on Ingram and Franco (2014).

16
comparison of the results for the full models to the final models reported in the next section is
included in the supplemental appendix.
Republican Factions
Table 4 presents logistic regression coefficients for membership in the Trump faction.
The odds of identifying as a member of the Trump faction are lower for those who do not
identify as born-again Christian, who are college graduates, and who do not identify as
“extremely” conservative. The largest coefficients associated with membership in the Trump
faction are for racial attitudes and economic optimism—those in the Trump faction are less
concerned about racism and are less optimistic about their economic circumstances, all else
being equal.
7
Table 4. Logistic Regression for Trump Faction, Republicans
Variable
Estimate
(Std. Error)
Born again Christian (No) -0.588
***
(-0.969, -0.207)
Some college education -0.214
(-0.693, 0.265)
College graduate -0.607
***
(-1.062, -0.153)
Racial attitudes -1.632
***
(-2.342, -0.922)
Economic Optimism -1.082
***
(-1.783, -0.382)
Conservative ideology Less Conservative or moderate -0.806
***
(-1.242, -0.369)
Conservative ideology Undefined -0.254
(-0.722, 0.213)
Constant 2.050
***
(1.451, 2.649)
Observations 593
Log Likelihood -365.1
Akaike Inf. Crit. 746.2
Area under the ROC curve 0.71
7
Economic optimism is calculated by summing the responses to evaluations of personal finances compared to last
year and evaluations of expected personal finances next year, and dividing by two. For each item, those who
responded “better off” scored a 1, those who responded “same” scored 0.5, and those who responded “worse off”
were scored 0.

17
Democratic Factions
Table 5 presents logistic regression coefficients for membership in the Progressive
faction. The odds of identifying as a member of the Progressive faction are higher for union
members, those less than 35 years of age, non-whites, those who “definitely” want more state
action on climate change, those who believe abortion should “always” be legal, those with
more economic optimism, and those who identify as extremely liberal.
Table 5. Logistic Regression for Progressive Faction, Democrats
Variable
Estimate
(Std. Error)
Member of labor union (No) -0.435
*
(-0.883, 0.013)
Age 35-54 -0.431
(-1.297, 0.436)
Age over 55 -1.045
**
(-1.859, -0.231)
Non-white 0.976
***
(0.389, 1.563)
Catholic 0.333
(-0.258, 0.924)
Other or unaffiliated religion 0.312
(-0.180, 0.803)
More state action on climate Yes probably -0.914
***
(-1.535, -0.293)
More state action on climate No probably not 0.523
(-0.809, 1.855)
More state action on climate No not at all -0.459
(-2.887, 1.969)
Abortion support sometimes legal -0.405
*
(-0.817, 0.008)
Abortion support never legal -0.125
(-1.282, 1.031)
Economic Optimism 0.796
*
(-0.137, 1.729)
Liberal ideology Less liberal or moderate -1.674
***
(-2.300, -1.047)
Liberal ideology Undefined -1.184
***
(-1.807, -0.560)
Constant 1.287
**
(0.051, 2.522)
Observations 551
Log Likelihood -307.852
Akaike Inf. Crit. 645.704
Area under the ROC Curve 0.737

18
Additional Analyses: Support for Democracy, Democracy in Practice, Christian Nationalism,
Operational Ideology
In addition to the items included in our logit models, some of our surveys included
scales that provide additional though limited data on characteristics that some have suggested
might drive membership in these factions. This section examines the factional differences on
four different scales. Details about the construction of these items can be found in the
supplemental appendix.
Support for Democracy in Principle and in Practice
We sought to determine respondents’ level of support for the principles of democracy
and their assessment of how democracy is working in practice. With respect to the principles of
democracy, we asked if all citizens deserve an equal say in how our government runs; if a leader
may sometimes need to break the rules to get things done; if there should be NO barriers to
voting in our country; if citizens should be allowed to say whatever they think even if their
views are unpopular; and if it is important to have established rights that protect defendants in
civil and criminal trials, including the presumption of innocence. On a ten-point scale, where
ten represents strong agreement with all five democratic principles and five represents
agreeing “somewhat” with each principle, the average score was 7.1. At the same time, most
voters in the state do not believe that American democracy is working as it should in practice.
To gauge how respondents think American democracy is working in practice, we asked if
citizens think the decisions of federal judges are fair and impartial; if the actions of the US
House and Senate represent the collective will of the American people; if elections in the
United States are free and fair; if the federal government is corrupt; and if the federal
19
government’s operations are open and transparent. The average score on the democracy-in-
practice questions was 2.4, which means that respondents disagreed with statements
describing a well-functioning democracy. Both Republicans and Democrats support democratic
principles (with scores of 6.6 and 7.5, respectively) and both are likely to disagree that
American democracy is working well (1.8 and 3.1, respectively). But, Republican scores on both
scales are significantly lower than Democratic scores.
The essential difference between the party factions is in their assessments of American
democracy in practice. Trump Republicans (average score of 1.1) are much less likely than
Traditional Republicans (2.4) to agree with all five statements that the American system is
working (see Figure 1). The bottom line is that, while all respondents tend to think that the
system isn’t working as we’d expect it to, Trump Republicans are especially likely to hold that
perspective. The differences among Democrats are not as stark; the differences in these groups’
ratings of democratic ideals and democracy in practice do not differ.

20
Figure 1. Democratic Principles and Practice Scale Scores by Party Factions
Christian Nationalism
Respondents were asked to report how much they agreed with four statements related
to Christian nationalist beliefs: the Founding Fathers intended the United States to be a
Christian nation; the Founding Fathers were evangelical Christians; the United States’ founding
documents are based on biblical principles; and America's power in the world is dependent on
its obedience to God. A strongly agree response was scored as 2 points while an agree response
counted as 1 point for all items. The items were summed and divided by four to create a score
ranging from 0 – 2.

21
Republicans (mean = 0.91) are more likely than Democrats (mean = 0.39) to believe in
Christian Nationalist ideals, but members of the Trump faction are much more likely than other
Republicans to believe that the United States is a Christian nation (see Figure 2). Trump
Republicans are more likely than Traditional Republicans and all Democratic factions to believe
in Christian Nationalist ideals. Democrats do not differ from each other on these beliefs.
Figure 2. Christian Nationalism Scale Scores by Party Factions

22
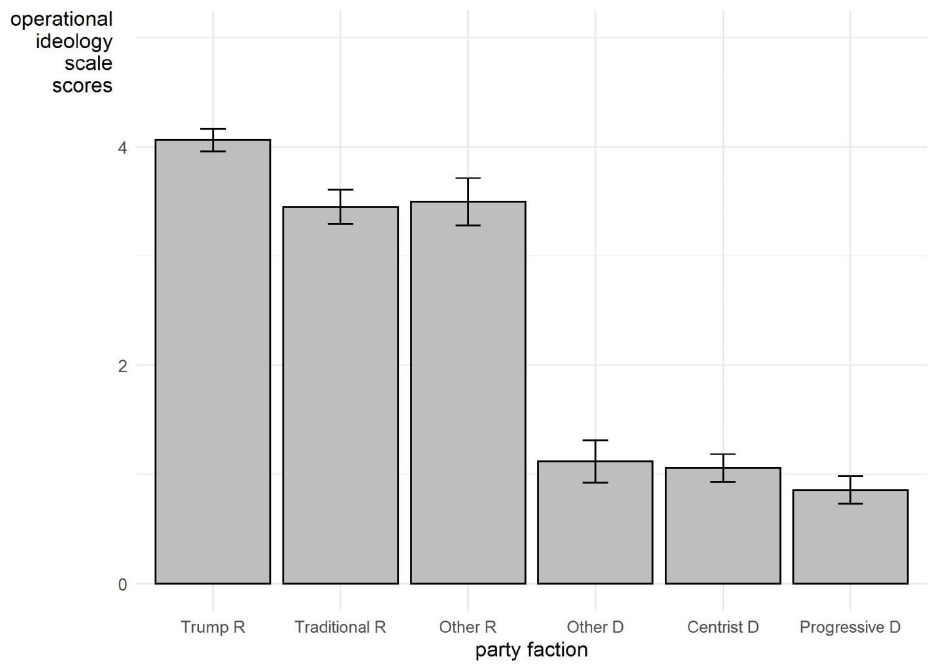
Operational Ideology
The operational ideology scale included five items that asked respondents to choose
which of two statements best reflected their personal views (see supplemental appendix for
question wording). Responses that reflected a conservative perspective were scored as 1 point
and the total scale score could range from 0 – 5. The operational ideology scale confirms the
findings from the logistic regression analysis that the Trump faction of the Republican Party is
the most conservative of all the partisan factions and that these individuals are more
conservative than other Republicans (see Figure 3). The ideological liberalism among
Democrats are not significantly different.
23
Figure 3. Operational Ideology Scale Scores by Party Factions
Discussion
This paper has explored voters’ sense of where they fit within their own parties using
designations that are commonly discussed in contemporary media coverage and political
discourse. Based on analyses of an assortment of data, we find that each party has at least
three discernable intra-party segments and that these segments are defined by a cluster of
ideological, demographic and policy attributes.
We should not be surprised that a system that fundamentally relies on just two major
parties has discernable factions within each. What we find noteworthy is that the factional
distinctions are strongly ideological within both parties, but that attributes beyond ideology
24
help to further differentiate the factions within each party. For Republicans, religion, economic
assessments, and attitudes about race produce the major points of division, while for
Democrats it is age, race, and policy preferences for government action on climate change and
abortion rights that amplify ideological differences.
Additional research is, of course, necessary to fully understand the factional affiliations
of the electorate. In addition to the items included in our logit models, we captured limited
data on characteristics that some have suggested might drive membership in these factions as
well. We found that some of these items, particularly support for Christian Nationalist ideals
among Republicans, would be worthy of additional work. Obviously, it would also be useful to
ask our faction affiliation questions to a national sample of voters. And, finally, we hope to
undertake further analyses of the characteristics of those voters in both parties who did not
affiliate with a faction and, instead, selected the “other” category.
One of the limitations of this work is that it is a product of the current political moment.
Undoubtedly, the labels given to these factions will change and the core groups will reconfigure
themselves in response to signals from political elites and the fusion of broader political and
cultural issues. This makes it particularly necessary to chart the feedback loops between elites
and voters that should continually reshape these self-defined factional affiliations.
25
Bibliography
Bacon, Perry, Jr. 2019. “The Six Wings of the Democratic Party.” FiveThirtyEight.com, March 11,
https://fivethirtyeight.com/features/the-six-wings-of-the-democratic-party/ (accessed October
20, 2021).
Barber, Michael and Jeremy C. Pope. 2019. “Conservatism in the Era of Trump.” Perspectives
on Politics 17: 719-36.
Beller, Dennis C. and Frank P. Belloni. 1978. “Party and Faction: Modes of Political
Competition.” In Frank P. Belloni and Dennis C. Beller, eds. Faction Politics: Political Parties and
Factionalism in Comparative Perspective. Santa Barbara, CA: ABC-Clio Press.
Blum, Rachel M. 2020. How the Tea party Captured the GOP: Insurgent Factions in American
Politics. Chicago: The University of Chicago Press.
Bolingbroke. 1997 [1738]. Bolingbroke: Political Writings. David Armitage, ed. New York:
Cambridge University Press.
Boucek, Françoise. 2009. “Rethinking Factionalism: Typologies, Intra-Party Dynamics and
Three Faces of Factionalism.” Party Politics 15: 455-85.
Carmines, Edward G., Michael J. Ensley, and Michael W. Wagner. 2016. “Ideological
Heterogeneity and the Rise of Donald Trump.” The Forum 14: 385-97.
Clarke, Andrew J. 2020. “Party Sub-Brands and American Party Factions.” American Journal of
Political Science 64: 452-70.
Conger, Kimberly H., Rosalyn Cooperman, Gregory Shufeldt, Geoffrey C. Layman, Kerem Ozan
Kalkan, John C. Green, and Richard Herrera. 2019. “Group Commitment Among U.S. Party
Factions: A Perspective from Democratic and Republican National Convention Delegates.”
American Politics Research 47: 1376-1408.
DeSante, Christopher D. and Candis Watts Smith. 2020. “Fear, Institutional Racism, and
Empathy: The Underlying Dimensions of Whites’ Racial Attitudes.” PS: Political Science &
Politics 53: 639-45.
DiSalvo, Daniel. 2012. Engines of Change: Party Factions in American Politics, 1868-2010. New
York: Oxford University Press.
Drutman, Lee. 2017. “Political Divisions in 2016 and Beyond: Tensions Between and Within the
Two Parties.” The Democracy Fund Voter Study Group,
https://www.voterstudygroup.org/publication/political-divisions-in-2016-and-beyond (last
accessed July 25, 2021).
26
Ekins, Emily. 2017. “The Five Types of Trump Voters: Who They Are and What They Believe.”
The Democracy Fund Voter Study Group, https://www.voterstudygroup.org/publication/the-
five-types-trump-voters (last accessed August 11, 2021).
Haberman, Maggie. 2021. “A survey of Republicans shows 5 factions have emerged after
Trump’s presidency.” The New York Times, March 12.
https://www.nytimes.com/2021/03/12/us/politics/republican-factions-.html (accessed October
20, 2021).
Hansen, John Mark, Shigeo Hirano, and James M. Snyder Jr. 2017. “Parties within Parties:
Parties, Factions, and Coordinated Politics, 1900-1980.” In Alan S. Gerber and Eric Schickler,
eds., Governing in a Polarized Age: Elections, Parties, and Political Representation in America.
New York: Cambridge University Press.
Ingram, DD and SJ Franco. 2014. “NCHS Urban-Rural Classification Scheme for Counties.” 166.
Vital Health Stat. Vol. 2. National Center for Health Statistics.
Kamarck, Elaine and Alexander R. Podkul. 2018. “The 2018 Primaries Project: What are the
internal divisions within each party?” The Brookings Institution,
https://www.brookings.edu/research/the-2018-primaries-project-what-are-the-internal-
divisions-within-each-party/ (last accessed September 20, 2021).
Key, V.O, Jr. 1949. Southern Politics in State and Nation. New York: Alfred A. Knopf.
Key, V.O., Jr. 1958. Politics, Parties, and Pressure Groups, 4
th
ed. New York: Thomas Y. Crowell
Company.
Masket, Seth. 2020. Learning from Loss: The Democrats, 2016-2020. New York: Cambridge
University Press.
Medvic, Stephen K. 2007. “Old Democrats in New Clothing? An Ideological Analysis of a
Democratic Party Faction.” Party Politics 13: 587-609.
Noel, Hans. 2016. “Ideological Factions in the Republican and Democratic Parties.” ANNALS of
the American Academy of Political and Social Science 667: 166-188.
Norris, Pippa. 1995. “May’s Law of Curvilinear Disparity Revisited: Leaders, Officers, Members
and Voters in British Political Parties.” Party Politics 1: 29-47.
Olsen, Henry. 2021. “The GOP has five factions now. They all see a different future for their
party.” The Washington Post, July 26.
https://www.washingtonpost.com/opinions/2021/07/26/gop-has-five-factions-now-they-all-
see-different-future-their-party/ (accessed October 20, 2021).
27
Panebianco, Angelo. 1988. Political Parties: Organization & Power. New York: Cambridge
University Press.
Polsby, Nelson W. 1983. Consequences of Party Reform. New York: Oxford University Press.
Ranney, Austin and Willmoore Kendall. 1956. Democracy and the American Party System. New
York: Harcourt, Brace and Company.
Rapoport, Ronald B., Jack Reilly, and Walter J. Stone. 2020. “It’s Trump’s Party and I’ll Cry if I
Want To.” The Forum 17: 693-709.
Reiter, Howard L. 2004. “Factional Persistence Within Parties in the United States.” Party
Politics 10: 251-71.
Roback, Thomas H. and Judson L. James. 1978. “Party Factions in the United States.” In Frank P.
Belloni and Dennis C. Beller, eds. Faction Politics: Political Parties and Factionalism in
Comparative Perspective. Santa Barbara, CA: ABC-Clio Press.
Rose, Richard. 1964. “Parties, Factions and Tendencies in Britain.” Political Studies 12: 33-46.
Rose, Richard. 1974. The Problem of Party Government. New York: Penguin Books.
Sartori, Giovanni. 1976. Parties and Party Systems: A Framework for Analysis, Volume 1. New
York: Cambridge University Press.
Thomsen, Danielle M. 2017. “Joining Patterns Across Party Factions in the US Congress.” The
Forum 15: 741-51.
Yost, B.A. 2003. “Disappearing Democrats: Rethinking Partisanship Within Pennsylvania’s
Electorate.” Commonwealth 12: 77 – 86.
Zariski, Raphael. 1960. “Party Factions and Comparative Politics: Some Preliminary
Observations.” Midwest Journal of Political Science 4: 27-51.
