
Air Force Institute of Technology Air Force Institute of Technology
AFIT Scholar AFIT Scholar
Theses and Dissertations Student Graduate Works
3-2023
Analysis and Optimization of Contract Data Schema Analysis and Optimization of Contract Data Schema
Franklin Sun
Follow this and additional works at: https://scholar.a6t.edu/etd
Part of the Databases and Information Systems Commons, and the Operational Research Commons
Recommended Citation Recommended Citation
Sun, Franklin, "Analysis and Optimization of Contract Data Schema" (2023).
Theses and Dissertations
.
7014.
https://scholar.a6t.edu/etd/7014
This Thesis is brought to you for free and open access by the Student Graduate Works at AFIT Scholar. It has been
accepted for inclusion in Theses and Dissertations by an authorized administrator of AFIT Scholar. For more
information, please contact AFIT[email protected].

ANALYSIS AND OPTIMIZATION OF CONTRACT DATA SCHEMA
THESIS
Franklin Sun, Second Lieutenant, USAF
AFIT-ENS-MS-23-M-155
DEPARTMENT OF THE AIR FORCE
AIR UNIVERSITY
AIR FORCE INSTITUTE OF TECHNOLOGY
Wright-Patterson Air Force Base, Ohio
DISTRIBUTION STATEMENT A
APPROVED FOR PUBLIC RELEASE; DISTRIBUTION UNLIMITED
The views expressed in this thesis are those of the author and do not reflect the official policy or
position of the United States Air Force, DoD, or the United States Government. This material is
declared a work of the U.S. Government and is not subject to copyright protection in the United
States.
AFIT-ENS-MS-23-M-155
ANALYSIS AND OPTIMIZATION OF CONTRACT DATA SCHEMA
THESIS
Presented to the Faculty
Department of Operational Sciences
Graduate School of Engineering and Management
Air Force Institute of Technology
Air University Air Education and Training Command
In Partial Fulfillment of the Requirements for the
Degree of Master of Science in Data Science
Franklin Sun, BS
Second Lieutenant, USAF
March 2023
DISTRIBUTION STATEMENT A.
APPROVED FOR PUBLIC RELEASE; DISTRIBUTION UNLIMITED.
AFIT-ENS-MS-23-M-155
ANALYSIS AND OPTIMIZATION OF CONTRACT DATA SCHEMA
Franklin Sun, BS
Second Lieutenant, USAF
Committee Membership:
Major Michael J. Garee, PhD
Chair
Dr. Nathan B. Gaw
Member
iv
AFIT-ENS-MS-23-M-155
Abstract
The management, development, and growth of U.S Air Force assets demand extensive
organizational communication and structuring. These interactions yield substantial amounts of
contracting and administrative information. Air Force Life Cycle Management Center’ Data
Analytics Research Team (DART) has aggregated and labeled the text content of over 4 million
such contracts as a means towards obtaining valuable insights on Department of Defense
resource usage. This set of contracting data is largely not optimized for backend service in an
analytics environment. To this end, the following research evaluates the efficiency and
performance of various data structuring methods. Evaluated designs include a baseline
unstructured schema, a Data Mart schema, and a snowflake schema. Overall design success
metrics include ease of use by end users, database maintainability, and overall computational
performance. Ease of use and maintainability are determined by examining the structural
complexity of each schema. The resource demands raised by a set of benchmark queries are used
to compare computational performance across schema. Results aggregated from this process
suggest that the Data Mart schema is the strongest and most balanced design for this application.
v
Acknowledgements
I’d like to sincerely thank to my advisor (Major Michael J. Garee, PhD) and reader (Dr.
Nathan B. Gaw) for advising me during the thesis writing process. I would also like to take this
opportunity to thank the American taxpayers for everything they do.
vi
Table of Contents
Abstract ................................................................................................................................... iv
Acknowledgements ................................................................................................................. v
List of Figures ....................................................................................................................... viii
List of Tables .......................................................................................................................... ix
I. Introduction ................................................................................................................................ 1
Background .............................................................................................................................. 1
Problem Statement ................................................................................................................... 1
Research Objective .................................................................................................................. 2
Scope ....................................................................................................................................... 2
Paper Overview ....................................................................................................................... 3
II. Literature Review ....................................................................................................................... 4
Chapter Overview .................................................................................................................... 4
Natural Language Processing .................................................................................................. 4
Named Entity Recognition ...................................................................................................... 5
Contracting Information Extraction ......................................................................................... 7
Database Design Background .................................................................................................. 7
Database Schema Considerations ............................................................................................ 8
Normalization ........................................................................................................................ 10
Schema Performance Comparison ......................................................................................... 12
Evaluating Database Complexity .......................................................................................... 13
Effects of Schema Complexity on Query Construction ........................................................ 14
Data Warehouses ................................................................................................................... 15
Inmon and Kimball Methodologies ....................................................................................... 16
Postgres Background and Discussion .................................................................................... 18
R Shiny .................................................................................................................................. 19
III. Methodology ........................................................................................................................... 20
Chapter Overview .................................................................................................................. 20
Research Background ............................................................................................................ 20
Data Warehouse Design Framework ..................................................................................... 26
Effects of Structural Complexity on Human Performance and Longevity ........................... 33
Evaluation of Structural Complexity ..................................................................................... 34
vii
Evaluation of Computational Performance ........................................................................... 35
Novel Data Structure ............................................................................................................. 38
Holistic Schema Evaluation................................................................................................... 39
Chapter Summary .................................................................................................................. 40
IV. Results and Analysis ............................................................................................................... 41
Chapter Overview .................................................................................................................. 41
Evaluated Database Schemas ................................................................................................ 41
Structural Complexity Evaluation and Analysis ................................................................... 43
Benchmark Query Evaluation and Analysis .......................................................................... 47
Holistic Scoring of Evaluated Schemas ................................................................................. 55
Chapter Summary .................................................................................................................. 56
V. Conclusions and Recommendations ........................................................................................ 57
Chapter Overview .................................................................................................................. 57
Research Findings.................................................................................................................. 57
Recommendations ................................................................................................................. 59
Limitations ............................................................................................................................. 59
Future Work ........................................................................................................................... 60
Summary ................................................................................................................................ 61
Appendix A: Data Exploration SQL Queries ............................................................................... 62
Appendix B: Sample Data From dm_acft_acty ............................................................................ 64
Appendix C: Schema Complexity Metric SQL Queries ............................................................... 66
Appendix D: Benchmark SQL Queries ........................................................................................ 67
Appendix E: Tabulated Benchmark Query Runtimes .................................................................. 70
Bibliography ................................................................................................................................. 71
viii
List of Figures
Figure 1: NER Visualization created using NLTK and SpaCy (Li, 2018) ..................................... 6
Figure 2: Graphic Summarizing First Three Normal Forms (Hoffer, 2010) ................................ 11
Figure 3: Comparison of Schema Performance in Prevailing Literature ...................................... 13
Figure 4: Example of Star Schema (Smallcombe, 2019) .............................................................. 27
Figure 5: Example of Snowflake Schema (Smallcombe, 2019) ................................................... 28
Figure 6: Entity Relationship Diagram of the Staging stg_acft_acty from AFDart2 ................... 31
Figure 7: Entity Relationship Diagram of the Data Mart ready dm_acft_acty from AFDart2 ..... 32
Figure 8: Proposed Entity Relationship Diagram of the sf_acft_acty Snowflake Schema ........... 42
Figure 9: Example of pgAdmin EXPLAIN/ANALYZE’s Query Plan Output (Query 3) ........... 50
Figure 10: Example of pgAdmin EXPLAIN/ANALYZE’s Per Node Statistics (Query 3) ......... 51
Figure 11: Graphical Comparison of stg_acft_acty and dm_acft_acty Resource Usage .............. 52
ix
List of Tables
Table 1. Comparison of Databases and Data Warehouses (Naeem 2022) ................................... 16
Table 2. Comparison of Kimball Star and Snowflake Schema (Smallcombe 2022) .................... 18
Table 3. Current Development Environment Specifications ........................................................ 21
Table 4. AFDart1 Data Schema Size Overview (Initial State CAO 27 OCT 22) ......................... 23
Table 5. AFDart2 Data Schema Size Overview (Current Development CAO 2 JAN 23) ........... 25
Table 6. AFDart1 and AFDart2 Data Schema Dimensionality Comparison (CAO 2 JAN 23) ... 25
Table 7. Selected Benchmark Query Descriptions ....................................................................... 37
Table 8. Category Weights for Holistic Schema Evaluation ........................................................ 40
Table 9. Raw Structural Complexity Score Component (AFDart2, CAO 30 DEC 22) ............... 43
Table 10. Truncated Complexity Score Components (AFDart2 CAO 30 DEC 22) ..................... 44
Table 11. Schema Suitability Findings for Human Performance ................................................. 46
Table 12. Schema Suitability Findings for Direct Database Maintenance ................................... 47
Table 13. Benchmark Query Runtime Comparison ...................................................................... 48
Table 14. Tabulated Comparison of stg_acft_acty and dm_acft_acty Resource Usage ............... 51
Table 15. Schema Suitability Findings for Direct Database Maintenance ................................... 55
Table 16. Point Values Awarded by Category .............................................................................. 56
Table 17. Overall Schema Performance Evaluation Under Original Weighing ........................... 56
1
ANALYSIS AND OPTIMIZATION OF CONTRACT DATA SCHEMA
I. Introduction
Background
Each year, the Department of Defense (DoD) allocates billions of taxpayer dollars
towards various acquisitions and development projects across the country. The resource
expenditure and manpower involved in these endeavors demand a high degree of documentation
and communication, resulting in a vast quantity of contracts.
At present, Air Force Life Cycle Management Center’s (AFLCMC) Data Analytics
Resource Team (DART) have aggregated over 4 million Air Force contracts across a diverse
range of DoD operations, enterprises and ventures. Collectively, these contracts represent nearly
50 million pages of organizational communications. DART is currently applying natural
language processing techniques to convert raw PDF and image files into an interactive database
(Butcher, 2021). Additional preprocessing of this data is being undertaken using Named Entity
Recognition models, allowing for improved isolation of various contract pricing, serial numbers,
and inventory item identifiers (Haberstich, 2021). The resulting contract data from DART’s
extraction efforts are compiled in a Postgres database. Ultimately, this database will serve as the
backend for an analytical dashboard facilitating analysis of Air Force finances and operations.
Problem Statement
In support of future analysis efforts, DART is attempting to restructure the aggregated
information using standard industry practices for supporting data analytics. DART is seeking to
evaluate the performance of their target database design relative to an unstructured baseline.
Accordingly, the performance of their restructured schema will be compared against the original
raw extracted data schema. Various alternative candidate schemas for data warehousing will also
be evaluated to further explore the schema design solution space. Schema evaluation will utilize
2
structural complexity and query speed as key comparative metrics. A stronger understanding of
data schema effects on backend performance offers the potential for reduced computational and
manpower resources during data analytics, improving the Air Force’s organizational efficiency.
Research Objective
The primary research objective is to compare the suitability of various data schema for
usage as a backend for an analytical pipeline. A comparative evaluation of the unorganized
schema, DART restructured data warehouse schema, and novel alternate schema will be
undertaken. This analysis will contain the following areas of focus:
1. Structural complexity of each tested database schema.
a. Impact on end user ease of use and human performance
b. Impact on database longevity and upkeep
2. Performance speed under a range of standardized evaluation queries and transactions.
Results from these areas of evaluation will grant DART insights and guidance on their current
and future data structuring activities.
Scope
The following research examines the suitability and performance of DART’s efforts to
structure contracting text data. As of the writing of this thesis, only one schema has been
prepared for usage in a Data Mart environment. Accordingly, the following analysis is primarily
focused on one schema and its corresponding unstructured baseline. Limitations in development
environment resources and permissions prevented us from creating our own comparative data
schemas. The outlined methodology is intended to be generalizable and may be carried out
shortly after any future contracting schema restructuring efforts by DART. However, it should be
3
cautioned that the use cases and parameters for deployment environments are not in
consideration during this research due to the developmental nature of the dataset.
Paper Overview
Background information and literature on database structuring and evaluation is
presented in Chapter II. Detailed information concerning the methodology and execution of this
research is contained in Chapter III. Research results are tabulated and discussed in detail in
chapter IV. Research findings, limitations, and future work are summarized in Chapter V.
4
II. Literature Review
Chapter Overview
The review conducted below serves to explore current literature in the field of natural
language processing, named entity recognition, and database design principles. These subjects
and their corresponding publications were selected based on their relevance within the context of
a large government contract dataset. Additional remarks concerning AFLCMC’s development
environment and infrastructure are also included in this chapter.
Natural Language Processing
Natural language processing (NLP) is defined as the field of machine learning dedicated
towards automatically extracting and interpreting natural language data. NLP applications
include (but are not limited to) document summarization, machine translation, and speech
recognition (Stubbs & Pustejovsky, 2013). These applications are dependent on organized and
labelled natural language datasets known as corpora. A given corpus can often be further broken
down into categories, with each category offering pattern insights into specific text formats
(informative reporting, general fiction, legal documentation, etc.) – an appropriate corpus is
ultimately used to train NLP models. Accordingly, the content of these categories as well as the
quality of their labels are essential for maximizing the accuracy of a given NLP objective (Leech,
1991).
Raw contracting data must undergo extensive preprocessing before conducting any NLP
driven analysis. The first of these steps is the tokenization of a given natural language dataset.
Tokenization is the process in which a document is broken down into tokens, where a token is a
5
smaller information unit that allows meaning to be more easily accessed during natural language
processing. The size and complexity of these tokens vary depending on the target application.
For example, a book could be tokenized into individual sentences. In contrast, a smaller body of
information such as a chapter or paragraph may instead be tokenized into individual words
(Banerjee, 2020).
At this point, removal of punctuation and stop words is quite straightforward. Stop words
are defined as high frequency words or phrases deemed to have little impact on the meaning of a
given document (‘a’, ‘the’, ‘am’, etc.). More often than not, these terms simply introduce
unnecessary noise and complexity in a given dataset (Banerjee, 2020). The remaining tokens are
then lemmatized, a process that reduces a word to its base form (e.g., lemmatizing ‘playing’ will
yield the reduced form ‘play’). This step further reduces dataset complexity and noise. Third-
party software libraries such as Wordnet are often used towards this end. At this point, the
remaining tokens undergo part of speech tagging in an effort to introduce additional lexical
context (Bird, 2009).
Named Entity Recognition
Named entity recognition (NER) is a crucial component of NLP and is a supervised
machine learning technique used to isolate user-defined terms of interest. These terms are then
further sorted into user-defined categories, enabling the extraction of a given document’s most
pertinent details (Roldos, 2020).
Open-source APIs and libraries such as the Stanford Named Entity Recognizer (SNER),
Scikit-Learn, SpaCy, and Natural Language Toolkit (NLTK) are most frequently used to achieve
this objective. These open-source libraries often come preloaded with standard NER models,

6
allowing commonly recognized categories to be isolated (a visualization of this labeling process’
end state is presented in Figure 1). However, objectives demanding the extraction of uncommon
or specific entity types require training customized NER models (Shrivarsheni, 2020).
Figure 1: NER Visualization created using NLTK and SpaCy (Li, 2018)
At this time, it should be noted that the development of a custom NER model is quite
time and labor intensive, as it requires the creation of a custom corpus (Pustejovsky & Stubbs,
2013). Within the DoD, there exist a number of unique entities and formats, each of which
require manual labeling. Entities specific to the field of government contracting include CAGE
(Commercial and Government Entity) codes, Contract Line Item Numbers (CLINs), and
National Stock Numbers (NSNs). Fortunately, natural language annotation toolkits (such as
PyLighter) have been used in conjunction with SpaCy to create DART contract-specific NER
models (Haberstich, 2021). These libraries and techniques are typically combined with regular
expressions to preprocess and prepare DART’s contracting data.
7
Contracting Information Extraction
Research applying NLP methods towards DART contract data has been recently
underway. Butcher (2021) applied RegEx (regular expression) and standard NER models to
extract information from government contracts. Butcher found that text mining and RegEx were
highly accurate and computationally efficient, but only in situations where desired entity data
was in a standard format and location. In contrast, standard NER models yielded notably higher
degrees of flexibility, but at a substantially increased computational cost. Moreover, application
of existing NER models simply returned all organizations and identification numbers – no
refinement or discrimination was possible. Ultimately, Butcher recommended the development
of a custom NER model tailored to DART’s contracting data to obtain flexible and accurate
results.
Butcher’s work was directly continued by Haberstich (2021). Here, Haberstich developed
a custom NER model using the open-source Python library SpaCy. This custom model was
found to yield significant improvements in identifying CAGE codes, CLINs, and Part Numbers.
No significant improvements were found in the identification of NSNs.
Database Design Background
The entity isolation and identification outlined in the previous sections ultimately serves
the end objective of facilitating efficient queries and analytics on DART contracting data.
Meeting this goal requires the extracted information to be organized into a database. The method
of organizing data can be defined a databases’ schema. At the highest level, database schema can
be classified as either a relational database or NoSQL database.
8
Relational databases are the most used class of database schema and are characterized by
a series of interconnected data tables. Tables add dimensionality and information to each of their
datapoints through a series of attributes. Engines and languages implementing relational schema
include SQL Server, MySQL, and PostgreSQL (Kolonko 2018). In contrast, NoSQL database
schema (also known as distributed or non-relational databases) do not aggregate data into tables.
Instead, these schemas most frequently structure data using graph theory, key-value pairs,
column sections, or document storage (Gupta, 2017).
Database Schema Considerations
Oftentimes, normalization techniques are applied to optimize and strengthen a relational
database’s structure. The extent and restrictiveness of these normalization processes vary widely.
However, the general goal of normalization remains the removal and resolution of multivalued
attributes, partial functional dependencies, and transitive dependencies (Hoffer, 2011). Effective
application of this process reduces redundancy and anomalies during data transactions, offering
the potential to decrease overall query runtime.
When creating a relational schema, data engineers should ensure that data transactions
adhere to ACID (Atomicity, Consistency, Isolation, Durability) principles. Atomic transactions
can only fully fail or succeed so that failed transactions do not alter any data. Consistency
indicates that transactions do not pose a danger to the underlying structure of the database – all
data is immediately consistent. Isolation dictates that there exists no interaction between
transactions and that only one transaction is carried out at a time. Durability ensures that
completed transactions are immediately committed and remain in place even in the event of a
subsequent network or power failure (Hoffer, 2011).
9
In contrast, NoSQL data schema follows a less restrictive set of guidelines known as the
BASE (Basically Available, Soft State, Eventually Consistent) principles. Basic availability
indicates that aggregated data is spread across multiple data storage systems. Effectively, this
principle emulates ACID’s durability principle through large scale redundancy. Soft state
indicates that data consistency is not inherently guaranteed by the database, shifting this task to
the database’s developers and maintainers. Finally, eventual consistency ensures that data
eventually converges to a consistent state across all storage nodes. There is no requirement for
when to reach this consistent state. In practice, a number of well-designed NoSQL databases
mostly satisfy the more restrictive ACID criteria (Chapple, 2020).
Relational database schemas are best suited for structured datasets, while the less
restrictive NoSQL database schemas are best suited for semi-structured and non-structured
datasets. Structured data can be defined as data adhering to a cleanly organized and readable
format, often presented in a row and column format. In contrast, unstructured data represents raw
and complex data with no consistent formatting. Semi-structured data represents data that
generally follows a set of data rules and characteristics. However, variability and inconsistencies
may still be found (Naeem, 2020).
We may consider DART’s contract database in its raw and original format to be a case
study in unstructured data. A wide range of information is embedded across millions of PDF
files. Ideally, text mining and NER techniques can be applied to perfectly extract and standardize
key data from each of the contracts. This hypothetical outcome would lend itself towards a
structured database schema. However, the prior work carried out by Butcher (2021) and
Haberstich (2021) have demonstrated that there remains a degree of imperfection and variability
10
in the extract of key contract information. Thus, we may realistically classify the format of a
postprocessed DART contracting database as semi-structured.
Normalization
Normalization can be best understood as a series of increasingly restrictive guidelines for
database attribute relationships. This process can be understood as a means to reduce data
anomalies and redundancies, offering the potential for improved transaction execution time and
consistency. The first three normal forms focus on analyzing and streamlining functional
dependencies, or the scenarios where the value of one attribute is dependent on the value another
(Hoffer, 2010).
A database may be considered to be in first normal form if there are no table objects
contained within other tables or duplication. Table cells contain a single value and stored records
are unique. Furthermore, values in a given table are all dependent on one or more primary keys
(Hoffer, 2010).
Second normal form guidelines require the further removal of partial functional
dependencies. A partial functional dependency may be defined as a situation where non-key
attributes are only dependent on a subcomponent of a defined table primary key (Hoffer 2010).
Second normal form is often achieved by partitioning data across multiple data tables.
A database in third normal form further removes any transitive functional dependencies.
These transitive functional dependencies may be defined as situations where one non-key
attribute is dependent on the values of another non-key attribute (Hoffer, 2010). Third normal
form can also be obtained by the partitioning of data tables.

11
Errors that may potentially arise from data tables not in being normal form include (but
are not limited to) insertion, deletion and update anomalies. Insertion anomalies encapsulate
situations where row insertions are duplicated, incomplete, or not possible due to multiple partial
dependencies within the same table. Deletion anomalies describe situations where the removal
of a given row in one table eliminates access to unrelated information elsewhere. Update
anomalies refer to situations where update transactions fail to fully propagate or are made
notably less efficient (Hoffer, 2010). A graphical representation of the steps required to convert a
multivalued table to third normal form is presented in Figure 2.
Figure 2: Graphic Summarizing First Three Normal Forms (Hoffer, 2010)
12
Schema Performance Comparison
As previously outlined, the more intuitive nature of relational database schemas lead to a
more user-friendly environment. Furthermore, the more rigorous ACID standards for relational
schemas demand near-perfect or perfect transaction accuracy. In contrast, the more distributed
nature of NoSQL schema yields an increased potential for data inconsistencies. It should be
noted that the time and memory complexity of data transactions for both relational and NoSQL
databases are both linear (O𝑘𝑛). However, computational demands increase faster with scale
in relational schemas than NoSQL schemas (that is to say, K
Relational
> K
NoSQL
). This
performance gap in large, unstructured datasets can further be widened by selecting the right
NoSQL schema for the job. For instance, document-based NoSQL platform MongoDB
outperforms native XML NoSQL platform eXist (Sánchez-de-Madariaga, 2017).
A meta-analysis examined a wide range of literature in database schema performance.
Here, performance parameters were defined by query latency, writing latency, volume, accuracy,
and scalability. Query and writing latency refer the mean time required to retrieve or write data
to a given database. Volume refers to the potential for parallel processing of data transactions
within a given database. Accuracy indicates the robustness of the database against data
inconsistency and duplication. Scalability describes the rate of change in the other four
performance metrics with respect to database size and complexity. The proportion of times each
given schema outperformed the other across a range standardized research datasets is aggregated
in Figure 3. This data visualization was generated from data from Grove, 2021.

13
Figure 3: Comparison of Schema Performance in Prevailing Literature
Evaluating Database Complexity
An information system’s ease of access, development, and maintenance are tied to its
scale and complexity. Accordingly, an objective measure should be applied towards DART’s
database schema as a means of quantifying its respective complexities. These complexity metrics
serve to expand on the usage of classical normalization forms for the quality assessment of
relational schema. Examples of individual relational database metrics in current literature include
the number of attributes across schema tables, number of foreign keys within a schema, the depth
referential tree of the schema, and the cohesion of the schema (Calero, 2001). A schema’s depth
referential tree refers to the ‘length of longest referential path in a given schema, or the longest
series of connections between a schema’s tables. Cyclical references are counted within this
total, but only once. Schema cohesion refers to the squared summation of the number of tables
contained within each unique subgraph of a schema.
14
Calero’s publication suggests that the number of foreign keys represents the most direct
measure of a relational database’s complexity. Depth referential trees are described as a measure
of database length (depth), while the number of attributes and cohesion are described as a
measure of size (breadth). Calero cautions that these metrics should not be considered in a
vacuum, and that the overall purpose and context of each database should also be factored into
complexity analysis (Calero, 2001).
A later publication acknowledges the need to balance the consideration of multiple
database schema properties during the development of a complexity metric (Pavlic, 2008). Pavlic
et al. proposes assigning a weight for each individual relation in a schema (termed W). This
value is set by the formula 𝑊 𝐴 𝐾 𝐼 𝐹. Here, 𝐴 represents the number of attributes,
𝐾 represents the number of primary and secondary keys, 𝐼 represents the number of additional
non-unique indices (note: unique indices acting as keys are counted in 𝐾), and 𝐹 is the number of
foreign keys. The summation of each relation’s weight 𝑊 is termed 𝐶 and reflects the total
database complexity. This metric considers the total number of relations and several potential
complexity factors holistically. Furthermore, these metrics may be garnered through a series of
relatively straightforward SQL queries in any modern database management system (Pavlic,
2008).
Effects of Schema Complexity on Query Construction
Research within an educational context has indicated that increasing a database’s logical
complexity results in a decreased rate of successful SQL query formulation. The rate of
complications in SQL queries was also found to increase, where complications are defined as
syntactical inefficiencies that negatively impact query readability and performance without
15
influencing final data output (Taipalus 2020). Subjects in this study were database programing
students, who were instructed to complete a series of query construction tasks on schema of
increasing complexity. A weekly time limit was imposed for each tested schema, however there
was no limit on the number of attempts to solve each task. The metric used to compare the
logical complexity of tested relational schema is the summed weight method outlined in Pavlic’s
2008 publication (outlined in the preceding subsection). An increase in schema complexity was
found to yield a commensurate increase in overall query error rate. However, Taipalus’ research
discovered that there was no evidence to suggest that the distribution of error type (syntactic,
semantic, logical, or complications) was dependent on schema complexity (Taipalus 2020).
The environment exhibited in this study may be considered as reflective of a typical
government work environment. Queries are to be constructed within a set time frame with no
practical limitation on repeat attempts. Organization interests stand to benefit from decreased
database complexity, as Taipalus indicates that this would result in decreased query error rates
and improved operational efficiency.
Data Warehouses
Data warehouses are a concept frequently seen in data engineering in enterprise
applications. Data warehouses are subject oriented, integrated, time variant, and nonvolatile
(Naeem, 2022). In this context, a subject-oriented design means that the dataset is created to
handle a certain business task or category of data. In other words, there is a common theme in the
information contained within the warehouse. Information integration describes the pooling of
multiple datasets or databases into one location in a consistent manner. Stored data is processed
to follow a common, unified set of conventions. Time-variant information represents the idea

16
that data should contain time-series labels, allowing for chronological analysis. Finally, the
concept of nonvolatile data represents the idea that stored information is permanent. Data is not
replaced or deleted, and may generally be regarded as functionally read only (Naeem, 2022). A
table comparing the features of databases and data warehouses is presented in Table 1. It should
be noted Online Transactional Processing (OLTP) represents simpler read-write queries at a high
rate, while Online Analytical Processing (OLAP) represents relatively infrequent complex
queries that are optimized for analysis and reporting purposes (Reis, 2022).
Table 1. Comparison of Databases and Data Warehouses (Naeem, 2022)
Database Data Warehouse
Amalgamation of related data
Information system containing historical and
commutative data from one or several sources
Used for recording data Used for analyzing data
Application-oriented collection of data Subject-oriented collection of data
Online Transactional Processing (OLTP) Online Analytical Processing (OLAP)
Data and structure normalized Data and structure may be denormalized
Inmon and Kimball Methodologies
In the world of data modeling, Inmon and Kimball’s methods are considered the
prevalent standards for data warehouses. Despite the contemporaneous development of these
approaches, their philosophies remain fundamentally opposed (Reis, 2022). Inmon emphasizes a
highly structured and organized approach towards data warehouse construction, believing that
the end goal of a data warehouse is to maintain single source of truth for an enterprise. However,
17
this approach is more resource intensive to set up than Kimball’s method, and ongoing
normalization may increase operations complexity (Naeem, 2022). Fundamentally, the Inmon
philosophy is a “data first” approach, where business operations draw upon a single structured
source (Reis, 2022).
In contrast, Kimball’s philosophy can be said to follow a “mission first” approach, where
data storage methods are designed with the intent of serving specific business divisions or goals.
A key concept in the Kimball method is the star schema. Here, a central ‘fact table’ outlines a
series of event related data. Additional context concerning certain aspects of fact table entries are
tabulated in separate dimension tables. Many modern database structures extend this concept
with snowflake schemas (Smallcombe, 2019). These schemas attach additional dimension tables
to dimensions tables in a pattern that resembles a snowflake or fractal. This shape is a function of
normalizing star schema dimension tables. A succinct comparison of the differences between star
and snowflake schemas is contained in Table 2.
The denormalization often seen in these Kimball schemas may lead to potential
redundancies and inconsistencies (Naeem, 2022). Furthermore, they involve executing more
potential JOIN statements than their Inmon alternatives. Overall, the emphasis is shifted from
normalization and structure towards flexibility and development speed (Reis, 2022).

18
Table 2. Comparison of Kimball Star and Snowflake Schema (Smallcombe 2022)
Star Schema Snowflake Schema
Fact tables surrounded by only a single layer
of dimension tables
Dimension tables may have additional
dimension tables attached
Denormalized data structure Normalized data structure
High level of data redundancy, slightly lower
storage efficiency
Low level of data redundancy, slightly higher
storage efficiency
Lower structural and query complexity Higher structural and query complexity
Better suited for data marts and smaller
datasets (less than 100 GB)
Better suited for data warehouses and larger
datasets (greater than 100 GB)
Less suited for diverse and complex analytical
queries
Better suited for diverse analytical demands
(focus on analytics and modeling)
Postgres Background and Discussion
At present, DART structures its contracting database using PostgreSQL (also known as
Postgres). This relational database management system’s open-source philosophy allows free use
by any organization, both public and private. Furthermore, open-source development offers end
users a wide range of community-sourced extensions. These factors contribute towards
PostgreSQL’s popularity and versatility, providing ample documentation and flexibility during
AFLCMC contract data structuring (Postgres Documentation 2022).
Postgres provides the mainstays of a modern relational database management system,
providing rigid adherence to ACID design principles. Data consistency is guaranteed through the
application of Multiversion Concurrency Control (MVCC). MVCC works by storing multiple
versions of objects undergoing revision. Thus, the results of one user’s incomplete write
transaction is prevented from being retrieved by another user’s read transaction. This robustness
towards error provides advantages during periods of heavy changes and development on a
19
database with many end users. Standout security features such as extensive user permissions
configuration and data encryption strengthen the case for usage in multi-person government
development environment. Furthermore, PostgreSQL is simply an iteration of Structured Query
Language (SQL). This property allows syntactic knowledge to be readily gained by those who
are already familiar with other members of the SQL family such as MySQL (Postgres
Documentation 2022).
A substantial amount of labor and infrastructure has already been invested by AFLCMC
and DART towards onboarding contracting information to Postgres. Accordingly, this database
management system will likely host future schema of DART contracting data.
R Shiny
The intended frontend interface for contract analysis is R Shiny, an R package that
enables the development of interactive web applications. In contrast to other common business
intelligence packages such as Tableau, R Shiny is free and open source (Wickham 2021). The
software’s integration into the R programming language allows the usage of other R packages.
Various dependencies are automatically monitored for currency and validity, improving the end
user’s experience and the organization’s security. Additionally, developers using R Shiny do not
require the knowledge of HTML, CSS, or JavaScript that traditional web application developers
require.
DART’s usage of this tool facilitates stronger communication of analysis and modeling to
non-technical end users. However, it should be noted that the elements that are incorporated into
the R Shiny interface may indirectly influence the type and frequency of queries sent to the
contracting database backend.
20
III. Methodology
Chapter Overview
The content below serves to outline the methods used to compare simple non-
interconnected database schemas, DART-designed Kimball Star schemas, and novel snowflake
schemas. The structural complexity of each candidate schema will be evaluated. These
complexity metrics will serve to create a stronger understanding of potential query construction
challenges for end users. These results may additionally yield insights leading to improvements
in database upkeep and maintenance. The overall computational performance of each candidate
schema will also be evaluated using a series of bespoke benchmark queries. Each benchmark
query’s computational resource demands will be compared in an attempt to develop an empirical
understanding of potential performance advantages and disadvantages for evaluated schemas. A
holistic analysis factoring in end user ease of use, data maintenance, and computational
performance will be carried out for each schema. This analysis will ultimately serve as a set of
potential guidelines for future areas of research and development.
Research Background
Over the past two years, DART has applied a range of text mining techniques to extract
actionable text data from more than four million Air Force contracts (Haberstich, 2021). The end
goal of DART is to provide a simple, user-friendly search tool for contract analytics using R
Shiny as a frontend interface. Accordingly, a well-developed backend design is paramount. The
chief concern of the following analysis is the quality of the schema governing the relationships
between data tables, and not of the constituent data points.

21
Development Environment
All extracted contracting data has been loaded into a PostgreSQL database, which is
presently hosted on the US Air Force’s REEF high performance computing cluster. Relevant
hardware and software specifications are shown in Table 3 for future reference and
reproducibility. All the below specifications represent the resources made available to this
project and do not capture the entire performance potential of the REEF cluster. It should be
noted that DART personnel are planning on migrating operations to private cloud computing
platforms (Microsoft Azure, Amazon Web Services, etc.) in the latter portion of Q2 FY2023.
However, the specifications detailed in Table 3 accurately reflect the resources available for this
research.
Table 3. Current Development Environment Specifications
Node CPU Dual Intel Xeon Gold 6248 Cascade Lake
Node Core Count 40 cores
Node Processor Speed 2.5 GHz
Node Memory 768 GB DDR4
Available Storage for DB 109 TB
Operating System Red Hat Enterprise Linux 7
Relational DBMS PostgreSQL 11.16
DB Admin Tool pgAdmin 4.27
The contracting data contained on REEF is split into a testing and development database.
These databases are labelled afdart1 and afdart2 respectively. At the time of this research, afdart2
contains ongoing work to restructure and prepare cleaned and formatted iterations of the ingested
contracting data. Finalized schema will be pushed to afdart1 in preparation for an R Shiny
interface.
22
Initial Exploration of DART Schemas
DART personnel have organized the extracted data of interest into 14 distinct schemas
within the afdart1 development environment. Three schemas on this server (eda_jobs, eda_fpds,
and public) were initialized but unpopulated and thus removed from further consideration. Thus,
11 total schemas from afdart1 are selected for initial analysis. The afdart2 development
environment contains 38 distinct schemas. However, it should be noted that many of these
schemas are under active redevelopment, act as personal user sandboxes, or are inaccessible due
to organizational permission policies. Initial analysis concerning the size of each schema and its
constituent tables were conducted within pgAdmin to determine which schema was best suited
for initial benchmarking, exploratory analysis, and further development.
The large file size of the DART databases raises significant transaction runtime concerns
during research. Accordingly, a smaller subset of data tables and schema were selected for initial
benchmarking and development. For reference, a complete initial row count for all schema on
afdart1 required nearly two hours of runtime on the REEF computing cluster. For this row count,
PostgreSQL executed a sequential scan for each COUNT(*) operation, which can be expected to
scale linearly with complexity 𝑂𝑛 where 𝑛 is the number of rows (Postgres Documentation,
2022). More computationally complex operations such as MERGE JOIN can be expected to
take even longer.
Row count, disk space, and table count totals were gathered for each schema common to
both afdart1 and afdart2. The results of this exploration for schemas from afdart1 are presented
in Table 4 and are sorted in descending order by row count. The corresponding dimensionality
exploration for afdart2 schemas is captured in Table 5. The queries used to construct Tables 4
and 5 are contained in Appendix A. A further comparison of size differences across the eleven
examined schema common to both afdart1 and afdart2 is contained in Table 6. It should be noted

23
that the values captured in Table 4 represent the original, unstructured state for all contracting
schemas. This initial dimensionality exploration was conducted on 27 October 2022, prior to any
notable restructuring efforts by DART. These earlier figures are maintained for comparative
purposes, as more completed restructuring efforts reduce the difference between afdart1 and
afdart2. For instance, the dm_acft_acty schema has been pushed from afdart2 to afdart1 in
December 2022 in preparation for final testing and evaluation. The dimensionality data gathered
for afdart2 in Table 5 accurately reflects the ongoing restructuring efforts by DART and is
current as of 2 January 2023.
Table 4. AFDart1 Data Schema Size Overview (Initial State CAO 27 OCT 22)
Schema Total Rows File Size (GB) Number of Tables
express 5,792,302,938 1,489.0 43
ils_s 3,542,955,817 1,101.0 89
remis 3,180,065,324 346.0 136
dm_acft_acty 2,607,981,846 1,176.0 38
d043 1,533,408,558 249.0 18
aftoc 173,448,771 151.0 4
manpower 28,937,637 7.8 1
supply 3,275,078 0.6 1
master_ref 1,885,237 0.3 13
etl_jobs 3,584 0.0 5
dart_meta 1,652 0.0 12
Total
16,864,266,442 4,521 360
Note that the table counts for each schema excludes empty tables and includes table
partitioning. The ils_s, remis, dm_acft_acty, d043, aftoc, manpower, and etl_jobs schemas all
saw notable increases in their row counts and schema sizes between late October and early
December of 2022. This result is expected and is a result of quarterly contract data ingestion by
DART. Elimination of redundant attributes in the express schema (the largest schema in both
24
afdart1 and afdart2) has facilitated a net decrease in the amount of data present in afdart2. No
tables were removed or added during this process in the express schema.
Restructuring efforts are most pronounced in the remis and dm_acft_acty schemas and is
evidenced by a significant increase in schema table count. Note that the very large increase in
tables for the remis and dm_acft_acty schemas reflect the introduction of table partitioning, a
method used in database engineering to improve memory and query management of very large
data tables. The table counts for remis and dm_acft_acty are otherwise unchanged after removing
these logical partitions from consideration. Size data for stg_acft_acty is also shown in Table 5
due to its functionality as a staging platform for raw contract data as well as its role in later
comparative schema analysis. The size decrease between the earliest iteration of dm_acft_acty
seen in Table 4 and the dm_acft_acty in Table 5 can be partially explained by the division of data
between Data Mart ready and staging schemas.

25
Table 5. AFDart2 Data Schema Size Overview (Current Development CAO 2 JAN 23)
Schema Total Rows File Size (GB) Number of Tables
express 5,792,302,938 1,387.0 43
ils_s 5,123,287,783 1,129.0 90
remis 3,202,658,522 354.0 738
dm_acft_acty 1,981,853,870 682.0 810
stg_acft_acty 607,416,969 150.0 248
d043 1,588,086,570 254.0 18
aftoc 175,042,028 152.0 4
manpower 31,694,126 9.0 1
supply 3,275,078 0.6 1
master_ref 1,885,237 0.3 13
etl_jobs 9,533 0.0 5
dart_meta 1,652 0.0 12
Total
18,528,776,328 4,487.8 1,743
Table 6. AFDart1 and AFDart2 Data Schema Dimensionality Comparison (CAO 2 JAN 23)
Schema
Change in Row
Count
Absolute Size
Change (GB)
Relative Size
Change
Table Count
Change
express
--- -102.0
-6.85 %
---
ils_s
+1,580,331,966 +28.0
+2.54 %
+1
remis
+22,593,180 +7.0
+2.02 %
+602
dm_acft_acty
-626,127,976 +27.0
-42.00 %
+772
d043
+54,678,012 +5.0
+2.01 %
---
aftoc
+1,593,257 +1.0
+0.66 %
---
manpower
+2,756,489 +1.1
+14.10 %
---
supply
--- 0.0
0.00 %
---
master_ref
--- 0.0
0.00 %
---
etl_jobs
+5,949 0.0
+335.23%
---
dart_meta
--- 0.0
0.00 %
---
Net Change
+1,664,509,886 -32.9
-0.73 % 1,383
26
Data Warehouse Design Framework
As discussed previously, DART is seeking to prepare the extracted data for future
analytics and decision making. Data collections and updates will primarily occur at the start of
each fiscal quarter as new contracts are read into the database. Overall data structure and content
will remain relatively static within each quarter. This information represents the aggregated
results of extensive text mining on DoD acquisitions contracts. Prior work during this text
mining process has ensured a degree of data standardization. Additionally, the publication date
of the original copy of each contract is logged when available. Given these conditions, we may
consider the contracting information to be non-volatile, subject-oriented, integrated, and time
variant. Accordingly, the dataset’s design and optimization will be considered within a data
warehouse context.
Updates to contracts contained within the DART data warehouse do occur on a semi-
regular basis. However, associated properties such as originating organization or involved
personnel remain unchanged and may be repeated across several data sets. Furthermore, the core
goal of the project remains the facilitation of DART data analysis. Thus, the Kimball Star
schema can assist data analysts in this task by organizing data into a series of fact tables, which
are in turn augmented with a number of dimension tables. An example of a simple database
applying this concept is illustrated in Figure 4.
In larger datasets, the potential storage savings brought on by star schema may be further
developed by breaking dimension tables into additional fact-dimension table groupings. This
multi-tiered star schema system is known as a snowflake schema and may present substantial
storage savings by eliminating potential data redundancies (Nguyen, 2020). The star schema
example in Figure 4 is rebuilt in snowflake form in Figure 5.

27
Figure 4: Example of Star Schema (Smallcombe, 2019)

28
Figure 5: Example of Snowflake Schema (Smallcombe, 2019)
29
Current DART schema restructuring efforts have involved organizing unconnected data
tables into a Kimball Star schema. Each schema acts as a unique topic data warehouse. These
subject-oriented data warehouses are also known as Data Marts and will serve as the backbone
for an R Shiny frontend. As of 2 January 2023, only the remis and dm_acft_acty schemas have
seen any restructuring efforts into a Data Mart-ready format. Note that both of these schemas
have a corresponding staging schema for the associated raw contract data. These staging schemas
are stg_remis, and stg_acft_acty respectively and offer the potential to act as baseline
comparisons for remis and dm_acft_acty schema analysis. However, discussion with DART
personnel on 8 December 2022 has indicated that the remis schema has only undergone a very
initial degree of structuring and remains under active development for the near future. Note that
the stg and dm abbreviations in the schema names act as staging and Data Mart designators.
In contrast, a portion of the dm_acft_acty schema design is Data Mart ready and has been
pushed to the testing environment on afdart1. Some raw contract data remains on the
corresponding stg_acft_acty schema, leaving the schema itself online as a research baseline.
Accordingly, the stg_acft_acty and dm_acft_acty schemas will remain the primary focus for the
following research and analysis.
Target Schema Overview
The stg_acft_acty and dm_acft_acty schemas represent information drawn from a range
of personnel and aircraft maintenance documents. Entity relationship diagrams of the non-Data
Mart ready staging schema is shown in Figure 6. An entity relationship diagram of the completed
Data Mart ready dm_acft_acty schema is shown in Figure 7 for comparison. Both entity
relationship diagrams are truncated, as there exists only one star schema redesign within the
entirety of dm_acft_acty. Unconnected tables were accordingly excluded from Figure 7 to better
30
highlight restructuring efforts. Tables only existing in both stg_acft_acty and dm_acft_acty
remain in Figure 6 for the same reason.
The restructured data tables represent a range of monthly personnel and aircraft
summaries across all U.S Air Force base locations. The Data Mart structure is a simple Kimball
Star Schema, with the fact_mnpwr_mo_agg table acting as the central ‘fact’ table. Note that the
dm_acft_acty has introduced a degree of redundant data in the dim_dt dimension table. This
table divides the raw datetime data already contained in the dt_mo_cd column of
fact_mnpwr_mo_agg into various components to allow for expedited analysis.
It should be noted that the dm_acft_acty and stg_acft_acty schemas are primarily
comprised of maintenance, personnel, and resource allocation data. However, the methodology
for this research primarily focuses on structural development concerns and is agnostic to attribute
datatypes and content. However, the datatypes for each attribute do remain available for perusal
in Figures 6 and 7. Sample outputs from the fact_mnpwr_mo_agg, and dim_unit tables are
available in Appendix B. These tables were chosen to represent examples of data from both fact
and dimension tables.

31
Figure 6: Entity Relationship Diagram of the Staging stg_acft_acty from AFDart2

32
Figure 7: Entity Relationship Diagram of the Data Mart-ready dm_acft_acty from AFDart2
33
Effects of Structural Complexity on Human Performance and Longevity
For a given analytical task, more structurally complex database schema were found to
increase query construction time and error rate (Taipalus, 2020). In this context, schema
complexity is dependent on schema attribute, key, and index counts. Taipalus further concludes
that less complex schema designs offer improved ease of use and access for analysts directly
querying a relational database.
It should be further reiterated that the AFLCMC DART dataset aims to simply serve as
the backend to an R Shiny-driven frontend. End user analysts will query data in an abstracted
manner and the actual database schema will be relatively constant, limiting potential update
inconsistencies common to denormalized schema. This impact on query construction and human
performance may accordingly be granted a lower weight during the holistic evaluation.
Relational queries interfacing between the abstracted frontend and the proper backend
still need to be constructed during the development of this pipeline. Thus, structural complexity
across the schema evaluated in the following analysis remains valuable as a proxy for potential
development manpower costs.
Higher schema complexity scores may also illustrate potential future maintenance and
upkeep issues. Kimball Star schemas may directly sacrifice normalization in simple one-to-one
relations as an exchange for potential gains in development and query speed. Additionally,
many-to-many relationships or many-to-one relationships often are not able to be normalized
within the constraints of a fact-dimension table architecture. This increased level of redundancy
and complexity may lead to increased manpower costs during future data ingestion and
debugging (Naeem, 2022).
34
Evaluation of Structural Complexity
The comparative analysis for structural complexity across DART data schema is
conducted using the methodology outlined in Pavlic (2008). In summary, each schema’s
complexity is represented as the sum of its unique attributes, primary keys, foreign keys, and
additional indices. This measure of complexity is more straightforward to implement across a
large range of tables within PostgreSQL than the relational algebra or graph-based metrics
discussed in Calero (2001). Pavlic’s metrics may be gathered using a set of simple queries.
Commonly used alternative measures of complexity such as those proposed in Calero
(2001) are less intuitive and much more challenging to implement at scale. The alternatives
discussed by Calero call upon graph theory and relational algebra and include but are not limited
to metrics such as depth referential tree and schema cohesion. Overall, the relative simplicity and
interpretability of Pavlic’s methodology ultimately led to its selection as the primary complexity
metric during the analysis of DART schemas. The queries used to construct these complexity
metrics are shown in Appendix C.
Acquiring the requisite information to calculate each schema’s complexity is facilitated
through pgAdmin metadata schemas. Relevant metadata is automatically generated and updated
within the information_schema and pg_catalog schemas. information_schema contains
information concerning all defined objects in a given database. This information is defined in a
SQL standard, promoting portability across development environments. In contrast, pg_catalog
is a system schema and provides information concerning PostgreSQL-specific features in
addition to object metadata (Postgres Documentation, 2022).
It is cautioned that the approach outlined by Pavlic holds each of the aforementioned
properties in equal weight, which may not be truly representative of practical complexity. For
example, a relatively minor decrease in table attribute counts may outweigh a potentially large
35
introduction of relatively major increase in table key constraints. Indeed, this specific example
proves to be the case when comparing stg_acft_acty to dm_acft_acty. Accordingly, a range of
potential weights will be considered and evaluated for each evaluated schema to allow for a
degree of sensitivity analysis.
Evaluation of Computational Performance
At present, DART personnel have indicated plans to link the resulting contracting
database schema to an R Shiny frontend. Accordingly, data retrieval and a report construction by
data analysts will likely be executed without direct query construction. More involved analytics
are slated to be carried out within Elasticsearch, an open-source data analytics search engine.
R Shiny, Elasticsearch, or any other analytics frontend still act as abstractions on top of a
Data Mart backend. Thus, a series of benchmark queries will be constructed to evaluate the
runtime performance of the original and novel schema structure.
Benchmark Queries
Present planning for the contracting Data Mart indicates that database analytics will be
conducted on an ad hoc basis. In other words, there is a limited degree of access to representative
end user database interactions. A set of standardized queries are often run on a standard testing
and development Kimball Star Schema as a means to evaluate the performance of various
Relational Database Management Systems. This process is known as the Star Schema
Benchmark (SSB), and represents a range of aggregation functions, conditional parameters, table
joins, and other operations that are likely to be encountered in an enterprise or analytics data
warehouse environment (O’Neil, 2009).
36
A total of eight benchmark queries were developed and applied to the dm_acft_acty and
stg_acft_acty schemas. These custom benchmark queries were created with the intent to capture
a range of analytical functions similar to those seen in the Star Schema Benchmark. The
analytical functions addressed by each benchmark query is contained in Table 7, and each
query’s syntax is available in Appendix D. Queries with identical output targets were executed in
the unstructured stg_acft_acty staging schema, holding the number of operations (number of
JOINS, aggregation functions, etc.) constant where possible. Note that there is no direct
timestamp dimension table equivalent in stg_acft_acty for query 3, 6, and 8. Accordingly, the
equivalent information was extracted from timestamp attribute information contained in the
stg_acft_acty precursor for dm_acft_acty’s central star fact table (fact_mnpwr_mo_agg). The
additional computational overhead introduced from this extraction serves to highlight yet another
potential difference in performance between the Data Mart ready star schema and a simple
unstructured staging schema.
The benchmark queries were run in one batch during a period of low demand (overnight
during the December 2022 holiday season) to control for the resource fluctuations brought on by
a shared computing environment userbase’s variable demands. The average of three query
executions were logged for each benchmark query and database schema combination. Additional
benchmarking data details such as computational resource usage were gathered using pgAdmin’s
‘Explain/Analyze’ functionality. This functionality breaks down the component functionalities of
each query and provides step-by-step overviews of computational demands. Resource usage is
measured using an arbitrary unit selected by pgAdmin developers, with each unit reflecting the
resources required by the host system to sequentially scan through 8 kB of text. However, this
analysis function remains under development and currently yields negative runtime values when

37
certain operations are run in parallel (commonly seen in high performance computing clusters
such as REEF). Accordingly, accurate runtime breakdowns for specific resource-intensive
processes that utilize parallel operation (such as MERGE operations) are not available (Postgres
Documentation, 2022). Running the benchmark queries within the pgAdmin interface does
introduces additional computational demands. However, all benchmark queries are run in the
same environment and therefore incur identical resource overheads.
Table 7. Selected Benchmark Query Descriptions
Query General Tested Functionalities and Description
Q1 Multiple Aggregate, Multiple JOIN, GROUP, ORDER
Q2 Multiple JOIN, ORDER, LIMIT
Q3 Multiple JOIN, LIMIT
Q4 Multiple JOIN, Multiple Conditional Constraint, LIMIT
Q5 Single Aggregate, Multiple JOIN, Single Conditional Constraint, GROUP
Q6 Multiple Aggregate, Multiple JOIN, GROUP, ORDER
Q7 Single JOIN, LIMIT
Q8 Single Aggregate, Multiple JOIN, Multiple Conditional Constraint, GROUP,
ORDER
Note that SQL aggregate functions involve arithmetic operations such as COUNT, AVG,
MIN, or MAX. All evaluated aggregate functions included a ROUND operation to emulate a
demand for readable output. All JOIN statements were INNER JOINS, including only non-null
rows for both the fact and target dimension tables. Queries involving multiple JOIN operations
only included a total of two dimension tables for consideration. Additionally, the size of the fact
table itself led to output being limited to 100,000 rows in the interest of time. These LIMIT
operations were not necessary in the case of certain queries due to operations being carried out
on smaller dimension tables. Specific syntax for each query is made available in Appendix D.
38
Novel Data Structure
At its core, the focus of the research remains on promoting a resource-efficient data
structure that is conducive to end user productivity. The insights garnered from the preceding
data exploration and analysis will be used to explore alterations to the existing DART
contracting database. To this end, additional schema considerations and designs are compared
with the original data present in afdart1 and the novel data warehouse architecture put forward
by DART in afdart2.
Development and Evaluation of Novel Data Structure
Prior literature reveals a range of potential advantages and disadvantages associated with
star and snowflake schema. The optimal choice between these design options varies with respect
to project goals and parameters. Accordingly, dm_acft_acty will be additionally restructured in
snowflake form and undergo the previously outlined structural complexity and maintainability
evaluations. Details concerning the execution and evaluation of this novel schema will be
discussed in Chapter 4.
Benchmark query collections for the novel snowflake schema are omitted. Storage
availability on REEF is already a large concern for DART personnel, and the DART contracting
database already exceeds previously established storage allowances. Accordingly, the evaluation
of the novel snowflake schema on a modified copy of dm_acft_acty on REEF is not possible due
to resource limitations. Further resource and security limitations do not allow the transfer of
stg_acft_acty or dm_acft_acty data onto computing devices accessible to the researcher. Running
benchmark queries on synthetic data similar to those seen in stg_acft_acty and dm_acft_acty on a
non-high performance computing cluster would demand impractical runtimes. Accordingly,
39
benchmark query performance conclusions for the novel data structure are extrapolated using
current literature and trends in computational usage between the other evaluated schemas.
Holistic Schema Evaluation
The impacts of structural complexity on query construction and data longevity will be
considered in tandem with computational performance to holistically rank candidate schemas. A
ranking ranging from one to three will be assigned for each category, where a rank of one and
three respectively reflect the strongest and weakest performance. These rank values will then be
multiplied by a range of categorical weights (Table 8) to arrive at a weight-adjusted composite
rank. The schema with the best (lowest) overall weight adjusted rank is then labeled as the
highest performing-tested design.
As discussed in earlier sections, the relevance of database human factors will be
diminished following the implementation of frontend analytic interfaces. Furthermore, near-term
migrations to civilian cloud services may potentially limit or ameliorate long term upkeep
concerns. Throughout this evaluation process, overall query speed and performance remains the
most user-relevant and quantifiable metric. At present, potential queries are ad hoc and may
reflect a wide range of possible computational demands. Additionally, the resources of the
computing cluster hosting the afdart1 and afdart2 databases are limited. Accordingly, the
following weights for each category are outlined for consideration in Table 8 and applied in
Chapter 4.

40
Table 8. Category Weights for Holistic Schema Evaluation
Category Weight
Human Factors 0.2
Data Longevity 0.3
Query Performance 0.5
Chapter Summary
Accurately evaluating the relative performance of different database schemas is
challenging and dependent on the specific use case. Human, organizational, and computational
factors were taken into careful consideration in an attempt to compare the overall potential of
various DART candidate schemas.
41
IV. Results and Analysis
Chapter Overview
The following chapter captures and explains the results yielded by the preceding
methodology. The human performance and database longevity impacts of each schema’s
structural complexity are evaluated and discussed. Computational benchmarks are collected and
examined for the baseline and Data Mart data schemas. A holistic quality evaluation of all
evaluated schemas is additionally included.
Evaluated Database Schemas
As of early January 2023, only the dm_acft_acty schema was adequately redesigned in
preparation for usage as a Data Mart. The stg_acft_acty hosted on afdart2 acts as an unstructured
staging area for recently ingested contracting data. Accordingly, the stg_acft_acty and
dm_acft_acty schemas were selected as baseline and Data Mart benchmark schemas respectively.
Novel Schema Development
It should be reiterated that DART restructuring efforts for the dm_acft_acty schema have
been centered on the implementation of a Kimball Star schema, which can be considered a
single-layered snowflake schema. Thus, a novel schema applying a higher dimension snowflake
architecture was developed and evaluated as a potential Data Mart solution. A graphical
representation of dm_acft_acty modified into a snowflake form (titled sf_acft_acty) is illustrated
in Figure 8. The below entity relationship diagram may be compared to the entity relationship
diagrams corresponding to stg_acft_acty and dm_acft_acty (see Figures 6 and 7 in Chapter 3).

42
Figure 8: Proposed Entity Relationship Diagram of the sf_acft_acty Snowflake Schema

43
The sf_acft_acty schema seen in Figure 8 was designed by carrying over normalization
principles to the dm_acft_acty schema. All attributes in a given table are solely dependent on their
primary key. Any attributes that have additional dependencies become the primary keys of their
own table. For instance, the afsc_crr_fld_desc attribute is a description of a given Air Force career
field and is directly dependent on the afsc_crr_fld_cd attribute. Both these attributes were
previously found in the dim_afsc table. However, they are given their own table to limit irrelevant
information during data analysis.
Structural Complexity Evaluation and Analysis
The following structural complexity analysis is conducted using the complexity evaluation
methodology discussed in Chapter 3. To this end, queries on counts from afdart2’s
information_schema and pg_catalog schemas yielded the total attribute, primary key, foreign key,
and non-key index counts for stg_acft_acty and dm_acft_acty. These counts are tabulated in Table
9. We can see that stg_acft_acty does not contain any formally defined primary keys, foreign keys,
or other indices. Regardless, attribute count remains the dominant contributor towards schema
complexity in both the staging and Data Mart benchmark schemas. Overall, the unstructured
staging schema appears to be substantially less complex in every evaluated category. No weights
are applied when calculating the total complexity from the component categories.
Table 9. Raw Structural Complexity Score Component (AFDart2, CAO 30 DEC 22)
Schema
Attribute
Ct.
Primary
Key Ct.
Foreign
Key Ct.
Non-Key
Index Ct.
Raw Total
stg_acft_acty 31191
0 0 0
31191
dm_acft_acty 90269
27 7 7737
98040

44
Further examination of the stg_acft_acty and dm_acft_acty illustrates that a large portion
of the attributes, keys, and indices gathered in Table 9 are a direct result of table partitioning in
stg_acft_acty and dm_acft_acty. This partitioning process splits tables into a user-defined number
of segments, allowing for simpler storage management and transport logistics (Postgres
Documentation, 2022). For these reasons, more tables within the dm_acft_acty have been labelled
as partitioned tables during the development process. Each segment may be treated as a logical
table, leading to a multiplicative effect on schema attribute counts. Additionally, the number of
segments a table is split into is directly dependent on table row count. In conjunction, these factors
will substantially inflate the complexity score of the large dm_acft_acty.
Accordingly, the focus for complexity evaluation narrows towards the tables that have seen
direct modifications in pursuit of a Kimball Star schema modification. A graphical representation
of the tables considered for each schema’s evaluated complexity score may be observed in Figures
6, 7, and 8. The results of this truncated and focused complexity analysis are outlined in Table 10.
Once again, no weights are applied when calculating the total complexity from the component
categories.
Table 10. Truncated Complexity Score Components (AFDart2 CAO 30 DEC 22)
Schema
Attribute
Ct.
Primary
Key Ct.
Foreign
Key Ct.
Non-Key
Index Ct.
Truncated
Total
stg_acft_acty 40
0 0 0
40
dm_acft_acty 49
8 7 0
64
sf_acft_acty 49
12 11 0
72
Overall, the snowflake schema was more structurally complex than the star schema,
which in turn was more complex than the unstructured staging schema. This outcome was
observed when holding the underlying information constant and is in line with underlying theory
45
(Naeem, 2022). The changes in structural complexities between stg_acft_acty, dm_acft_acty, and
sf_acft_acty may primarily be attributed to the introduction of various foreign keys that
connected dimension tables to their corresponding fact tables. It is important to reiterate that the
unstructured stg_acft_acty did not have any primary keys, foreign keys, or indices. The attributes
used as primary keys in the dm_acft_acty and their associated properties are present in
stg_acft_acty, however these properties were not formally declared.
Note that the increases to each non-zero complexity score component were relatively
proportional between schemas. Accordingly, weighing complexity score components differently
will not substantially influence the rank ordering of the evaluated schemas. This property may
not hold true for test sets including a larger range of schemas and offers an avenue for future
work once DART restructures more staging schemas to be Data Mart ready.
Impacts on Human Performance and Database Maintenance
The structure of the proposed sf_acft_acty schema requires more JOIN operations than
the stg_acft_acty or dm_acft_acty schemas when accessing a given set of data. Additional JOIN
operations are a reflection of increased structural complexity and errors in query formulation
(Taipalus, 2020). These statements may also require nested queries to effectively execute,
introducing another significant vector for user error and frustration during query construction.
When compared to stg_acft_acty and dm_acft_acty, raw data would require more preprocessing
and granular UPDATE statements to be properly ingested into the snowflake schema. On
balance, it can be said that sf_acft_acty incurs the greatest human performance and data
maintenance penalties.
The stg_acft_acty schema has been partially structured in preparation for the Kimball
Star Data Mart schema and is comprised of a series of discrete dimension tables. Accordingly, it

46
demands the same amount of JOIN operations to access information as the more complex and
interconnected dm_acft_acty schema. This property is apparent when examining the scope and
syntax of the benchmark queries outlined in Table 7 and Appendix D. Here, the stg_acft_acty
schema differs from a truly unmodified schema where all raw data exists in a large master
reference table requiring few if any JOIN operations during analysis. Additionally, a dimension
table contains preprocessed datetime information (dim_dt) in the dm_acft_acty schema. This
dimension table acts as example of storing transformations on preexisting data to save time when
accomplishing analytical tasks.
The dim_dt table in dm_acft_acty illustrates how proper Kimball Star schemas can be
more conducive for information retrieval and query construction. However, it should be noted
that creating dimension tables containing preprocessed information incurs further upfront
development costs. Additionally, these dimension tables require additional transformations on
raw data and present opportunities for information loss in the data ingestion pipeline. The overall
human performance and database maintenance rankings (where 1 is most ideal and 3 is least
ideal) for stg_acft_acty, dm_acft_acty, and sf_acft_acty are summarized in Tables 11 and 12.
Table 11. Schema Suitability Findings for Human Performance
Schema Ranking Key Points
stg_acft_acty 2 No indexing or keys, but same number of JOINs as Data Mart
dm_acft_acty 1 Easy access to preprocessed data with single JOIN operation
sf_acft_acty 3 Potential for nested queries

47
Table 12. Schema Suitability Findings for Direct Database Maintenance
Schema Ranking Key Points
stg_acft_acty 1 Relatively direct ingestion of raw data
dm_acft_acty 2 Moderate degree of data preprocessing prior to ingestion
sf_acft_acty 3 Potential for substantial data preprocessing during ingestion
Benchmark Query Evaluation and Analysis
A range of benchmark queries were carried out on the stg_acft_acty schema and
dm_acft_acty schema to evaluate computational performance. Additionally, the analytical
objectives were constant across all benchmark queries. In other words, benchmark queries were
rewritten to return identical results when underlying structural differences demanded revisions in
query syntax. The functionalities covered by each query is outlined in Table 7.
Each benchmark query was executed three times on the evaluated schemas. This process
was undertaken to verify the absence of potential environmental abnormalities or caching effects.
Benchmark queries were all executed in a single batch to limit potential variations in runtime due
to changes in available resources. A breakdown of individual runtimes for each query is
available in Appendix E. Side-by-side comparisons of the average runtimes for each query on
stg_acft_acty and dm_acft_acty are tabulated in Table 13. This table additionally captures
changes in query runtime between stg_acft_acty and dm_acft_acty. All runtimes are shown in
milliseconds.

48
Table 13. Benchmark Query Runtime Comparison
Query
Average Runtime
stg_acft_acty (ms)
Average Runtime
dm_acft_acty (ms)
Higher Speed
Schema
Change from
stg to dm
Q1
5122.6 5158.6
Staging
+0.70 %
Q2
8966.3 8680.9
Data Mart
-3.18 %
Q3
102.3 121.6
Staging
+18.87 %
Q4
1348.3 1402.0
Staging
+3.98 %
Q5
52.9 2292.4
Staging
+4233.46 %
Q6
5370.7 5027.8
Data Mart
-6.38 %
Q7
101.3 106.5
Data Mart
+5.13 %
Q8
1765.5 1714.5
Data Mart
-2.89 %
The results shown in Table 13 indicates a roughly even runtime performance between the
Data Mart and Staging schemas during most benchmarks. The notable exception is query 5,
which returned a result over forty times faster when executed on the stg_acft_acty schema than
the dm_acft_acty schema. Further examination of query 5’s execution plan found that
PostgreSQL parallel computing management system ensured that the same order of inputs and
outputs were maintained across all parallel processing threads in the Data Mart systems. In
contrast, this requirement was disregarded in the staging schema. This allowed for significantly
more efficient resolution of parallel task outputs. A more detailed exploration of this
phenomenon is available in the following sections.
Evaluating Computational Resource Requirements
Similar queries with an approximately even magnitude of computational demand will
often produce similar runtimes due to parallel computing optimizations done by Postgres. This is
largely apparent in environments where large amounts of additional workers (CPUs) are
available to be tasked on a given query. Thus, a more concrete metric for measuring
computational demand is called for.
49
To this end, each of the above benchmark queries were executed using the pgAdmin
EXPLAIN/ANALYZE tool. This tool breaks a query down into its computational components
for analysis, offering step-by-step runtime data. A detailed query execution summary is outlined
in Figure 9. This query plan represents a breakdown of the nodes (basic computational
operations) that make up a query. The Postgres backend optimizes each query plan, attempting to
minimize overall resource usage and runtime (Postgres Documentation, 2022). The relative
runtime and resource requirements for each node are available through the
EXPLAIN/ANALYZE tool and are shown in Figure 10. These sample outputs are derived from
a run of benchmark query 3 on dm_acft_acty. This query was selected as an example due to its
relatively simple and representative nature.

50
Figure 9: Example of pgAdmin EXPLAIN/ANALYZE’s Query Plan Output (Query 3)

51
Figure 10: pgAdmin EXPLAIN/ANALYZE’s Per Node Statistics Example (Query 3)
A comparison of the computational resource costs for each benchmark query ran on
stg_acft_acty and dm_acft_acty are tabulated in Table 14. This information is contained in the
execution summary and is the first number listed next to each node’s “cost” attribute in Figure 9.
Note that the measurements gathered in Table 14 use an arbitrary unit developed by pgAdmin
developers. Each unit reflects the resources required by the host system to sequentially read an 8
kB data table. Unlike runtime, these metrics remain constant between all query runs.
Accordingly, only one data collection per query is required for this part of the research task.
Table 14. Tabulated Comparison of stg_acft_acty and dm_acft_acty Resource Usage
Query
stg_acft_acty
Usage
dm_acft_acty
Usage
Percent
Difference
Highest
Efficiency
Parallel
Computing
Q1
798098.67 678783.72 -14.95% Data Mart Yes
Q2
1178779.6 1054715.01 -10.52% Data Mart Yes
Q3
5.53 355.3 6324.95% Staging No
Q4
1072.77 1073.43 0.06% Staging Yes
Q5
2038360.59 654377.79 -67.90% Data Mart Yes
Q6
744276.37 656635.32 -11.78% Data Mart Yes
Q7
95.93 97.12 1.24% Staging No
Q8
710710.99 606559.31 -14.65% Data Mart Yes
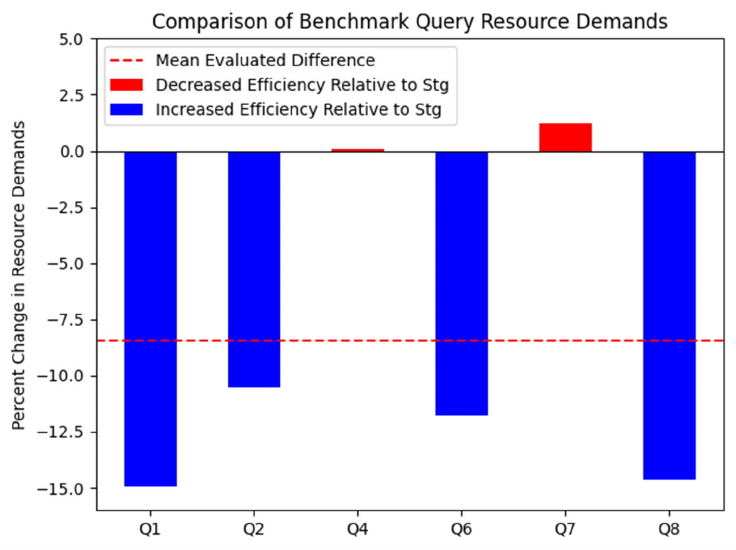
52
Generally, the dm_acft_acty Data Mart schema offered improved computational
efficiency when compared to the stg_acft_acty staging schema. Five out of the eight benchmark
queries (1, 2, 5, 6, and 8) see outright improvements in efficiency after restructuring, and staging
schema outperformances are very marginal in two out of the three such cases (4 and 7).
Improvements in Data Mart computational efficiency are consistently around 10 to 15% for the
same analytical task. However, there two notable outliers in benchmark resource demands.
Query 3 shows the staging schema outperforming the Data Mart schema nearly sixty-fold in
computational efficiency. Additionally, the resources required by query 5 on the Data Mart are
just one-third the amount used by the staging schema. These queries are emphasized in bold in
Table 14. A graphical comparison of benchmark query resource demands on stg_acft_acty and
dm_acft_acty is shown in Figure 11. Note that this chart excludes results from query 3 and 5 for
scaling purposes.
Figure 11: Graphical Comparison of stg_acft_acty and dm_acft_acty Resource Usage
53
Parallel processing was found to be a significant factor in schema superiority. Further
examination of per node and per table EXPLAIN/ANALYZE outputs for each benchmark
queries found that the GATHER and GATHER MERGE nodes were present anytime the Data
Mart schema outperformed the staging schema. These nodes are indicative of parallel processing,
which occurs when Postgres determines that recruiting additional CPUs would yield an
improvement in overall runtime (Postgres Documentation, 2022). This relationship is highlighted
in the final column of Table 14.
In comparison to their Data Mart counterparts, queries 3, 6, and 8 all required one less
JOIN statement. This modification was undertaken since the dim_dt dimension table does not
exist in the original staging schema. Instead, the stg_acft_acty schema’s fact_mnpwr_mo_agg
table’s dt_mo_cd attribute was used as the basis to for all date-time analysis. This date-time
attribute was transformed within the query, yielding an identical output across both stg_acft_acty
and dm_acft_acty. Examination of the per node EXPLAI/ANALYZE output for queries 3, 6 and
8 finds that this transformation process requires fewer computational resources than an addition
JOIN on a dim_dt table. Approximately several hundred computing units are saved due to this
property. However, query 6 and 8’s substantially larger scale and leveraging of parallel
computing drowns out this phenomenon. In summary, query 3’s abnormality is largely due to its
simple scale and fewer JOIN statements.
With the exception of query 5, all queries using parallel processing use a GATHER or
GATHER MERGE operation when ran on both schemas. However, the query plan for query 5
includes a GATHER MERGE node on the staging schema, and a GATHER node on the Data
Mart schema. The GATHER MERGE parallel processing node ensures that each CPU worker
preserves the data’s order during the query. In contrast, the GATHER node does not require the
54
order of input and output data to be the same. As such, parallel processing tasks in Postgres
utilizing the GATHER node requires substantially fewer resources than those utilizing GATHER
MERGE (Postgres Documentation, 2022). The choice of operation is determined automatically
by the Postgres query optimizer and explains the abnormal performance discrepancy in query 5.
This optimization may lead queries using the GATHER operation to return data in no defined
order.
Novel Schema Performance Extrapolation
Storage availability on REEF was heavily constrained, and access to alternate high-
performance computing clusters was limited. Accordingly, no empirical evaluation of a novel
snowflake schema was possible. However, the previously discussed differences in query
performance offer insights that may be used to create a theoretical projection of snowflake
schema performance.
For the same analytical task, more JOIN operations are required in a snowflake schema
than a Data Mart/star schema. However, the results in Table 14 for queries 6 and 8 have shown
efficiency gains despite additional JOIN operators being introduced in the Data Mart execution.
Furthermore, the impact of parallel computing optimizations has been shown to outweigh
additional JOIN operators. These outcomes are likely due to the introduction of proper indexing
and foreign keys in the Data Mart schema. Similar improvements may not necessarily be
observed when going from a Data Mart to a snowflake design since both schemas would be
properly indexed. For these reasons, a snowflake schema with the design seen in Figure 8 is
likely to perform on par with a Data Mart design.
Discovering the appropriate normalization relationships seen in a snowflake schema
demands a degree of subject matter expertise during schema development. Furthermore, the

55
additional layers of dimension tables may introduce additional storage demands. However, these
tradeoffs in storage and manpower are factored directly into the database longevity category and
is independent of the computational performance evaluation.
Overall Schema Computation Performance
A summary of each schema’s computational performance is available in Table 15. These
rankings assume that analytical operations are carried out on a platform that has the resources to
support large-scale parallel computing (such as REEF or any other high-performance computing
cluster).
Table 15. Schema Suitability Findings for Direct Database Maintenance
Schema Ranking Key Points
stg_acft_acty 2 Lack of indexing and interconnections reduce performance
dm_acft_acty 1 Better suited to leverage parallel computing environment
sf_acft_acty 1 Similar to Data Mart, specific outcomes dependent on data
Holistic Scoring of Evaluated Schemas
The above research is used to rank the evaluated schema in the human factors,
longevity, and computational performance categories. The strongest performing schema in each
category is denoted in bold. These raw score values are multiplied by the categorical weights set
in Table 8 of Chapter 3. The resulting weighted rank values are tabulated in Table 17. Category
weights are shown in the header row of Table 17 for reader convenience. The sum of each
schema’s weighted rank is used to determine the overall strongest schema to structure DART’s
contracting data.
Sensitivity analysis on the weights used for each of the following results was conducted.
The novel snowflake schema ranked last in both human factors and database longevity and tied

56
for first in computational performance with the Data Mart schema. Accordingly, no combination
of weights will allow the sf_acft_acty to become the strongest overall schema. The stg_acft_acty
ranked strongest overall in the database longevity row, and second in both human factors and
computational performance. Here, sensitivity analysis found that the stg_acft_acty schema is the
overall best for all cases where database longevity is weighted more than 0.5. This holds true
regardless of the weights for human factors or computational performance.
Table 16. Rank Summary by Category
Schema Human Factors
Database
Longevity
Computational
Performance
stg_acft_acty
2
1
2
dm_acft_acty
1
2
1
sf_acft_acty
3
3
1
Table 17. Overall Schema Performance Evaluation Under Original Weighing
Schema
Human
Factors (0.2)
Database
Longevity (0.3)
Computational
Performance (0.5)
Weighted
Rank
stg_acft_acty
0.4
0.3
1
1.7
dm_acft_acty
0.2
0.6
0.5
1.3
sf_acft_acty
0.6
0.9
0.5
2
Chapter Summary
In this chapter, the performance of an unstructured baseline schema was compared
against a Data Mart and snowflake schema. Human factors, database longevity, and
computational performance were used as factors for this evaluation. The Data Mart schema was
less structurally complex than the snowflake schema while being more organized and indexed
than the staging schema. Additionally, the Data Mart schema demonstrated empirically better
resource efficiency than the baseline staging schema. Overall, the Data Mart design may be
considered as the strongest and most balanced design.
57
V. Conclusions and Recommendations
Chapter Overview
This chapter summarizes the findings of the schema evaluation process and relates them
to the research objectives outlined in Chapter 1. Actionable insights yielded from this research
are prepared for DART personnel. Limitations of this research process and potential future areas
of development are additionally discussed.
Research Findings
DART’s core objective for the preceding research remains the determination of an
optimal schema design for analytic operations. The quality of a schema was determined to be a
derivative of human performance factors, database longevity, and computational performance.
Each of these performance metric components operated as a subobjective of the overall research.
The dm_acft_acty was found to be the strongest candidate for human performance, as it
allowed for queries to be constructed with a relatively few JOIN statements. In contrast, the
sf_acft_acty and stg_acft_acty schemas demanded more thought when establishing key
equivalencies and multiple levels of JOIN statements respectively. Evaluation of structural
complexity found that stg_acft_acty raised the lowest labor demands for overall data ingestion
and maintenance, as it was effectively the raw contracting data. The dm_acft_acty and
sf_acft_acty schemas were ranked second and third due to their additional preprocessing
requirements and interconnectivity.
The relative computational performance was determined using a set of bespoke
benchmark queries derived off of standardized star schema benchmarking processes.
Computational demands raised by each schema was evaluated using pgAdmin’s query diagnostic
58
tool EXPLAIN/ANALYZE. Overall, the dm_acft_acty schema were found to consistently
outperform the stg_acft_acty schema. Occasional exceptions to this trend may be explained by
improved access to certain requested attributes due to non-normalization in stg_acft_acty. The
sf_acft_acty schema was not evaluated for computational performance due to REEF resource
limitations. However, this schema was determined to perform on par to dm_acft_acty as multiple
JOIN commands have a limited impact on computational performance due to backend
optimizations by Postgres.
Holistic scoring of the evaluated schemas was conducted by conducting a weighted
ranking of each combination of schema and category. This process found that the Data Mart
schema (dm_acft_acty) had the strongest performance overall. Sensitivity analysis on category
weights found that the unstructured staging schema (stg_acft_acty) outperformed in cases where
data longevity accounts for half or more of a decision maker’s total considerations.
It should be noted that stg_acft_acty and dm_acft_acty were the only schemas to undergo
empirical evaluation during the course of this research. These schemas were the only available
fully restructured and Data Mart ready schemas in the DART REEF Postgres database. The data
contained in these schemas are not directly linked to contracting, and are primarily comprised of
maintenance, personnel, and resource allocation logs. However, the methodology of the above
research remains data-agnostic. This generalizability is a result of a focus on each schema’s
structural complexity and overall conduciveness for computational resource optimizations, both
of which are strictly database properties and act independently of attribute datatypes.
59
Recommendations
The Data Mart design that DART is currently targeting for their restructuring efforts is
found to be the best practice. The Data Mart schema introduced slight additional challenges for
data ingestion, preprocessing, and human analytical work. However, this method introduces
quantifiable computational performance improvements over the original unindexed staging
schema. Improvements in computation performance lead to overall reductions in resource and
time requirements in analysis. This outcome is found to be a result of parallel computing, which
is a keystone feature of modern computing clusters. Snowflake schemas remain a potential
alternate consideration owing to potential storage and runtime savings from normalization.
However, these schemas do present additional burdens for human performance and
maintainability. This tradeoff may be reevaluated at future time due to potential query
abstracting frontend tools such as R Shiny and Elastic-Search. Overall, DART is recommended
to continue to apply its current Data Mart-centric restructuring methodology.
Limitations
The above research and analysis examines the performance of various DART contracting
schemas that are under active development. The best efforts are carried out to ensure that
gathered data is up to date. However, the information contained in the above research may be
subject to change. Information that is subject to change is denoted accordingly. DART schema
redesigns available for analysis at the time that this research was carried out were also relatively
limited in scope. This limitation is due to the current DART development timeline in relation to
the AFIT thesis timeline and presents a domain for future work. Near-term migration of Air
Force high-performance computing clusters to civilian cloud services further reduces long-term
requirements and development environment-specific maintenance concerns.
60
Future Work
Throughout 2023, DART will continue to restructure the various staging schemas on
afdart2. In the short term, the resulting Data Mart schemas will be loaded onto afdart1 with the
intention of acting as a backend for an analytic frontend driven by R Shiny and Elastic-Search.
These frontends improve user ease of use at the cost of introducing additional computational
overhead. Thus, short-term follow-on research may entail analysis of potential avenues to
quantify and improve interface costs between analytic frontends and data backends. Comparative
evaluations of end-state Data Mart schemas and initial staging schemas may also be carried out.
Additionally, DART personnel have indicated that creating and maintaining efficient methods
for ingesting contracting data to REEF remains an area of focus. Research into extract,
transform, and load (ETL) pipelines may therefore be beneficial. REEF storage constraints also
impacted empirical testing and development of additional candidate schemas. Storage
considerations were tangentially discussed as an effect of schema design in Chapters 3 and 4.
However, a more detailed analysis and discussion of storage optimization and schema
development could be an avenue for near term development. This area of research could be
especially important in areas with a limited communal pool of computational resources such as
REEF.
In the long term, DART intends to migrate the contracting database backend away from
REEF and onto AVANA (a DoD cloud platform), Microsoft Azure, or Amazon Web Services (a
private cloud platform). These alternate platforms offer the potential to reduce resource
limitations by introducing the ability to purchase additional computing power whenever needed.
However, funding is a finite resource and DART would still benefit from optimizing overall
system performance in these new environments. Accordingly, future researchers may focus on
additional ways to minimize overall cloud computing resource costs to the DoD. This process
61
will likely have a focus on reducing storage requirements and modeling the frequency at which
certain types of queries are carried out on the contracting database.
Summary
The current Data Mart schemas targeted by DART is found to be a sound design for a
contracting database backend. This design offers balanced strengths in human performance,
database maintainability, and computational performance. The research carried out in this paper
was conducted on a limited subset of schemas due to the early and ongoing development of the
research environment. Future implementation of frontend services and migrations towards
alternate cloud services offer a potential range of opportunities to research additional
performance optimizations.
62
Appendix A: Data Exploration SQL Queries
SQL Query Used to Generate File Size Data
SELECT schema_name,
pg_size_pretty(sum(table_size))
FROM (
SELECT pg_catalog.pg_namespace.nspname as schema_name,
pg_relation_size(pg_catalog.pg_class.oid) as
table_size,
sum(pg_relation_size(pg_catalog.pg_class.oid)) over ()
as database_size
FROM pg_catalog.pg_class
JOIN pg_catalog.pg_namespace ON relnamespace =
pg_catalog.pg_namespace.oid
)
GROUP BY schema_name, database_size
SQL Query Used to Acquire Table Count Data
SELECT table_schema, count(*) AS tblCt
FROM information_schema.tables
GROUP BY table_schema
ORDER BY tblCt DESC;
63
SQL Query Used to Acquire Row Count Data (Ranganthan 2022)
create function count_rows_of_table(
schema text,
tablename text
)
returns integer
security invoker
language plpgsql
as
$body$
declare
query_template constant text not null :=
'
select count(*) from "?schema"."?tablename"
';
query constant text not null :=
replace(
replace(
query_template, '?schema', schema),
'?tablename', tablename);
result int not null := -1;
begin
execute query into result;
return result;
end;
$body$;
SELECT table_schema, SUM(row_count) AS total_rows FROM (
SELECT table_schema,
count_rows_of_table(table_schema, table_name) AS
row_count
FROM information_schema.tables
WHERE table_schema NOT IN ('pg_catalog',
'information_schema')
AND table_type='BASE TABLE'
) AS per_table_count_subquery
GROUP BY table_schema
ORDER BY 2 DESC;

64
Appendix B: Sample Data From dm_acft_acty
Sample Data from fact_mnpwr_mo_agg (Fact Table Example, First 5 Rows)
Row mnpwr_mo_agg_key dt_mo_cd osc_cd afsc_cd majcom_2_ltr_cd
1 1238210948 20170601 FMA 6F031 0D
2 1238210949 20170601 FMA 6F031 0R
3 1238210950 20170601 FMA 6F031 0R
4 1238210951 20170601 FMA 6F031 0D
5 1238210952 20170601 FMA 6F031 1C
Row unit_id pec_id instln_loc_id cmpnt_id emplmt_cat_id
1
02bcd531-
f913-22c6-
ace2-
f2d5546cc669
5f1ccb0f-
2782-afd2-
4b5d-
5d7aa2d0c37b
85fe7868-
519a-891a-
a4e4-
2d94f8f6bbc9
d265d149-
bad3-8028-
ee4d-
31d3f4233d08
d4cd0dab-cf4c-
aa22-ad92-
fab40844c786
2
2544d9cd-
0e48-6fea-
076c-
df5f9069b492
5f1ccb0f-
2782-afd2-
4b5d-
5d7aa2d0c37b
5aeac0a0-
3edd-7c0b-
f272-
d22547cdd158
d265d149-
bad3-8028-
ee4d-
31d3f4233d08
d4cd0dab-cf4c-
aa22-ad92-
fab40844c786
3
bd1e2267-
b5be-7738-
651d-
1d6d11b29740
5f1ccb0f-
2782-afd2-
4b5d-
5d7aa2d0c37b
413d2ee8-
46d1-69f8-
1c44-
6df1cc1a22d0
d265d149-
bad3-8028-
ee4d-
31d3f4233d08
d4cd0dab-cf4c-
aa22-ad92-
fab40844c786
4
55a74dd7-
4e96-c85d-
021f-
6b7b391a738b
5f1ccb0f-
2782-afd2-
4b5d-
5d7aa2d0c37b
3d21e1b2-
fbb9-c1a8-
171f-
70f290f821d7
d265d149-
bad3-8028-
ee4d-
31d3f4233d08
d4cd0dab-cf4c-
aa22-ad92-
fab40844c786
5
9f88ec29-
799e-664b-
c62e-
e48609fb0ac4
5f1ccb0f-
2782-afd2-
4b5d-
5d7aa2d0c37b
36cb6c4e-
5421-2256-
2f92-
1af50ccafbdf
d265d149-
bad3-8028-
ee4d-
31d3f4233d08
d4cd0dab-cf4c-
aa22-ad92-
fab40844c786
Row eofy_auth_qy asgd_qy reg_auth_qy
1 1 3 1
2 1 2 1
3 1 1 1
4 1 0 1
5 3 1 3

65
Sample Data from dim_unit (Dimension Table Example, First 5 Rows)
Row unit_id unit_pas_cd unit_pas_nbr_cd unit_uic_cd unit_desc
1
00010ff8-b64e-
a533-81b9-
c8d417b85e15
BB0JFG4N FG4N FFG4N0
DET 305
AFROTC SW
RG
2
0002cec2-57a9-
f654-c8fb-
791aa615d2a4
LE1MFNVL FNVL FFNVL1
OL PA AF
LIFE CYCLE
MGT CE
3
000d6eba-2f3e-
0905-116f-
7a783e544e55
WE0UFB6K FB6K NULL
NAT
AIR/SPCE
INTEL CE
4
000e915f-3a3e-
d7cc-56a1-
2fb6676c85f5
EE0VFJGY FJGY FFJGY0
AF SPEC
OPNS CM
5
000f36f3-3c56-
c73f-feaa-
4195d0f272cb
EE1MFJC7 FJC7 FFJC70
DET 3 AF
INST & MSN
SPT CE
66
Appendix C: Schema Complexity Metric SQL Queries
SQL Query Used to Acquire Attribute Count by Schema
SELECT table_schema, count(*) AS column_count
FROM information_schema.columns
GROUP BY table_schema ORDER BY column_count DESC;
SQL Query Used to Acquire Sum of Primary Keys, Indices, and Foreign Keys
SELECT table_schema, count(*) AS column_count
FROM information_schema.columns
GROUP by table_schema ORDER BY column_count DESC;
67
Appendix D: Benchmark SQL Queries
Benchmark Query 1
SELECT cmd_remis_desc,
ROUND((COUNT(CASE WHEN afsc_typ_nm LIKE 'OFFICER' THEN 1 ELSE
NULL END)+0.0)/COUNT(CASE WHEN afsc_typ_nm LIKE 'ENLISTED' THEN
1 ELSE NULL END), 4)
FROM ((dm_acft_acty.fact_mnpwr_mo_agg
INNER JOIN dm_acft_acty.dim_afsc ON
dm_acft_acty.fact_mnpwr_mo_agg.afsc_cd =
dm_acft_acty.dim_afsc.afsc_cd)
INNER JOIN dm_acft_acty.dim_cmd ON
dm_acft_acty.fact_mnpwr_mo_agg.majcom_2_ltr_cd =
dm_acft_acty.dim_cmd.cmd_majcom_2_ltr_cd)
GROUP BY cmd_remis_desc
ORDER BY round DESC;
Benchmark Query 2
SELECT unit_desc, afsc_afs_cd
FROM ((dm_acft_acty.fact_mnpwr_mo_agg
INNER JOIN dm_acft_acty.dim_afsc ON
dm_acft_acty.fact_mnpwr_mo_agg.afsc_cd =
dm_acft_acty.dim_afsc.afsc_cd)
INNER JOIN dm_acft_acty.dim_unit ON
dm_acft_acty.fact_mnpwr_mo_agg.unit_id =
dm_acft_acty.dim_unit.unit_id)
ORDER BY unit_desc ASC
LIMIT 100000;
Benchmark Query 3 (dm_acft_acty)
SELECT osc_cd, dt_cal_yr
FROM ((dm_acft_acty.fact_mnpwr_mo_agg
INNER JOIN dm_acft_acty.dim_cmd ON
dm_acft_acty.fact_mnpwr_mo_agg.majcom_2_ltr_cd =
dm_acft_acty.dim_cmd.cmd_majcom_2_ltr_cd)
INNER JOIN dm_acft_acty.dim_dt ON
dm_acft_acty.fact_mnpwr_mo_agg.dt_mo_cd =
dm_acft_acty.dim_dt.dt_cd)
LIMIT 100000;
Benchmark Query 3 (stg_acft_acty)
SELECT osc_cd, SUBSTRING(dt_mo_cd, 1, 4)
FROM ((stg_acft_acty.fact_mnpwr_mo_agg
68
INNER JOIN stg_acft_acty.dim_cmd ON
stg_acft_acty.fact_mnpwr_mo_agg.majcom_2_ltr_cd =
stg_acft_acty.dim_cmd.cmd_majcom_2_ltr_cd))
LIMIT 100000;
Benchmark Query 4
SELECT osc_cd, cmd_remis_desc, instln_loc_desc
FROM ((dm_acft_acty.fact_mnpwr_mo_agg
INNER JOIN dm_acft_acty.dim_cmd ON
dm_acft_acty.fact_mnpwr_mo_agg.majcom_2_ltr_cd =
dm_acft_acty.dim_cmd.cmd_majcom_2_ltr_cd)
INNER JOIN dm_acft_acty.dim_instln_loc ON
dm_acft_acty.fact_mnpwr_mo_agg.instln_loc_id =
dm_acft_acty.dim_instln_loc.instln_loc_id)
WHERE osc_cd = 'FMA'
AND (instln_loc_desc LIKE 'WRIGHT PATTERSON%' OR instln_loc_desc
LIKE 'PETERSON%')
LIMIT 100000;
Benchmark Query 5
SELECT instln_loc_desc, emplmt_cat_nm, COUNT(*)
FROM ((dm_acft_acty.fact_mnpwr_mo_agg
INNER JOIN dm_acft_acty.dim_emplmt_cat ON
dm_acft_acty.fact_mnpwr_mo_agg.emplmt_cat_id =
dm_acft_acty.dim_emplmt_cat.emplmt_cat_id)
INNER JOIN dm_acft_acty.dim_instln_loc ON
dm_acft_acty.fact_mnpwr_mo_agg.instln_loc_id =
dm_acft_acty.dim_instln_loc.instln_loc_id)
WHERE emplmt_cat_nm NOT LIKE 'NA'
GROUP BY instln_loc_desc, emplmt_cat_nm;
Benchmark Query 6 (dm_acft_acty)
SELECT instln_loc_desc, ROUND(AVG(dt_mo_of_yr), 4) AS avgMonth,
COUNT(*) AS actyCount
FROM (dm_acft_acty.fact_mnpwr_mo_agg
INNER JOIN dm_acft_acty.dim_dt ON
dm_acft_acty.fact_mnpwr_mo_agg.dt_mo_cd =
dm_acft_acty.dim_dt.dt_cd
INNER JOIN dm_acft_acty.dim_instln_loc ON
dm_acft_acty.fact_mnpwr_mo_agg.instln_loc_id =
dm_acft_acty.dim_instln_loc.instln_loc_id)
GROUP BY instln_loc_desc
ORDER BY avgMonth ASC, actyCount DESC;
69
Benchmark Query 6 (stg_acft_acty)
SELECT instln_loc_desc, ROUND(AVG(CAST(SUBSTRING(dt_mo_cd, 5, 2)
AS NUMERIC)), 4) AS avgMonth, COUNT(*) AS actyCount
FROM (stg_acft_acty.fact_mnpwr_mo_agg
INNER JOIN stg_acft_acty.dim_instln_loc ON
stg_acft_acty.fact_mnpwr_mo_agg.instln_loc_id =
stg_acft_acty.dim_instln_loc.instln_loc_id)
GROUP BY instln_loc_desc
ORDER BY avgMonth ASC, actyCount DESC;
Benchmark Query 7
SELECT *
FROM (dm_acft_acty.fact_mnpwr_mo_agg
INNER JOIN dm_acft_acty.dim_instln_loc ON
dm_acft_acty.fact_mnpwr_mo_agg.instln_loc_id =
dm_acft_acty.dim_instln_loc.instln_loc_id)
LIMIT 100000;
Benchmark Query 8 (dm_acft_acty)
SELECT instln_loc_desc, ROUND(AVG(dt_mo_of_yr), 4) AS avgMonth,
COUNT(*) AS actyCount
FROM (dm_acft_acty.fact_mnpwr_mo_agg
INNER JOIN dm_acft_acty.dim_dt ON
dm_acft_acty.fact_mnpwr_mo_agg.dt_mo_cd =
dm_acft_acty.dim_dt.dt_cd
INNER JOIN dm_acft_acty.dim_instln_loc ON
dm_acft_acty.fact_mnpwr_mo_agg.instln_loc_id =
dm_acft_acty.dim_instln_loc.instln_loc_id)
WHERE dim_dt.dt_cal_yr BETWEEN 2019 AND 2021
AND fact_mnpwr_mo_agg.asgd_qy > 10
GROUP BY instln_loc_desc
ORDER BY avgMonth ASC, actyCount DESC;
Benchmark Query 8 (stg_acft_acty)
SELECT instln_loc_desc, ROUND(AVG(CAST(SUBSTRING(dt_mo_cd, 5, 2)
AS NUMERIC)), 4) AS avgMonth, COUNT(*) AS actyCount
FROM (stg_acft_acty.fact_mnpwr_mo_agg
INNER JOIN stg_acft_acty.dim_instln_loc ON
stg_acft_acty.fact_mnpwr_mo_agg.instln_loc_id =
stg_acft_acty.dim_instln_loc.instln_loc_id)
WHERE CAST(SUBSTRING(fact_mnpwr_mo_agg.dt_mo_cd, 1, 4) AS
NUMERIC) BETWEEN 2019 AND 2021
AND fact_mnpwr_mo_agg.asgd_qy > 10
GROUP BY instln_loc_desc
ORDER BY avgMonth ASC, actyCount DESC;

70
Appendix E: Tabulated Benchmark Query Runtimes
Individual and Average Benchmark Query Runtimes on stg_acft_acty
Query Run 1 Run 2 Run 3
Average
Runtime (ms)
Q1
5165.9 5086.9 5114.9 5122.6
Q2
8918.9 9066.3 8913.8 8966.3
Q3
102.3 101.9 102.6 102.3
Q4
1353.6 1347.2 1344.2 1348.3
Q5
54.5 48.1 56.0 52.9
Q6
5404.9 5383.8 5323.3 5370.7
Q7
99.2 108.1 96.5 101.3
Q8
1817.3 1746.7 1732.6 1765.5
Individual and Average Benchmark Query Runtimes on dm_acft_acty
Query Run 1 Run 2 Run 3
Average
Runtime (ms)
Q1
5117.4 5135.6 5222.6 5158.6
Q2
8739.5 8607.5 8695.8 8680.9
Q3
123.9 120.3 120.6 121.6
Q4
1426.0 1396.0 1384.0 1402.0
Q5
2288.5 2297.4 2291.4 2292.4
Q6
5049.5 5005.9 5028.0 5027.8
Q7
110.7 108.6 100.1 106.5
Q8
1699.4 1716.7 1727.5 1714.5

71
Bibliography
A. Gupta, S. T. (2017). NoSQL databases: Critical analysis and comparison. 2017 International
Conference on Computing and Communication Technologies for Smart Nation
(IC3TSN), 293-299.
Bird, S., Klein, E., & Loper, E. (2011). Natural Language Processing with Python. O'Reilly.
Bulbul, H. I., & Unsal, Ö. (2011). Comparison of Classification Techniques used in Machine
Learning as Applied on Vocational Guidance Data. 2011 10th International Conference
on Machine Learning and Applications and Workshops, 2, pp. 298-301.
Butcher, Zachary E., "Contract Information Extraction Using Machine Learning" (2021). Theses
and Dissertations. 5026. https://scholar.afit.edu/etd/5026
Calero, C., Piattini, M., & Genero, M. (2001). Metrics for controlling database complexity.
Developing Quality Complex Database Systems, 48–68. https://doi.org/10.4018/978-1-
878289-88-9.ch003
Chapple, M. (2020, July 25). BASE Model of Database Development. Lifewire. Retrieved May
25, 2022, from https://www.lifewire.com/abandoning-acid-in-favor-of-base-1019674
Dibyendu, B. (2020, April 14). Natural language processing (NLP) simplified : A step-by-step
guide. Datascience Foundation. Retrieved May 25, 2022, from
https://datascience.foundation/sciencewhitepaper/natural-language-processing-nlp
-simplified-a-step-by-step-guide
Engle, Ryan D., "A Methodology for Evaluating Relational and NoSQL Databases for Small
-Scale Storage and Retrieval" (2018). Theses and Dissertations. 1947.
https://scholar.afit.edu/etd/1947
Grove, Carter, "Meta-analysis Of Performance Characteristics of Modern Database Schemas"
(2021). Theses and Dissertations. 5109. https://scholar.afit.edu/etd/5109
Haberstich, Kayla P., "Using Custom NER Models to Extract DOD Specific Entities from
Contracts" (2021). Theses and Dissertations. 5107. https://scholar.afit.edu/etd/5107
Hoffer, J. A., Ramesh, V., & Topi, H. (2013). Modern Database Management. Pearson.
Kolonko, K. (2018). Performance comparison of the most popular relational and nonrelational
database management systems. Karlskrona, Sweden: Blekinge Institute of Technology.
Leech, Geoffrey. (1991). “The state of the art in corpus linguistics.” In English Corpus
Linguistics: Linguistic Studies in Honour of Jan Svartvik. London: Longman, pp. 8–29.
72
Leitner, E., Rehm, G., & Moreno-Schneider, J. (2019). Fine-Grained Named Entity Recognition
in Legal Documents. In M. Acosta, P. Cudré-Mauroux, M. Maleshkova, T. Pellegrini, H.
Sack, & Y. Sure-Vetter (Ed.), Semantic Systems. The Power of AI and Knowledge
Graphs (pp. 272–287). Cham: Springer International Publishing.
Li, S. (2018, December 6). Named entity recognition and classification with Scikit-Learn.
Medium. Retrieved May 25, 2022, from https://towardsdatascience.com/named-entity
-recognition-and-classification-with-scikit-learn-f05372f07ba2
Naeem, T. (2020, November 1). Understanding structured, semi-structured, and unstructured
data. Astera. Retrieved May 25, 2022, from https://www.astera.com/type/blog/structured
semi-structured-and-unstructured-data/
Nguyen, H., Pham, H., & Chin, C. (2020). Data Modeling for Analytics. In The Analytics Setup
Guidebook (pp. 102–122). essay, Holistics.
O'Neil, P., O'Neil, B., & Chen, X. (2009, June 5). Star Schema Benchmark. University of
Massachusetts Boston. Retrieved January 3, 2023, from
https://www.cs.umb.edu/~poneil/StarSchemaB.PDF
Pavlic, M., Kaluza, M., & Vrcek, N. (2008). Database Complexity Measuring Method. Central
European Conference on Information and Intelligent Systems.
PostgreSQL Global Development Group. (2022, June 16). PostgreSQL 14.4 Documentation.
PostgreSQL. Retrieved July 19, 2022, from
https://www.postgresql.org/files/documentation/pdf/14/postgresql-14-A4.pdf
Ranganathan, K. (2022, July 5). Row counts of tables in a SQL schema & database - postgresql
and yugabytedb. Yugabyte. Retrieved January 3, 2023, from
https://www.yugabyte.com/blog/row-counts-of-tables-in-a-sql-schema-database-
postgresql-yugabytedb/
Roldos, I. (2020, March 30). Named Entity Recognition: Concept, Tools, and Tutorial. Retrieved
from https://monkeylearn.com/blog/named-entity-recognition/
Reis, J., & Housley, M. (2022). Fundamentals of Data Engineering: Plan and build Robust Data
Systems. O'Reilly.
Sánchez-de-Madariaga, R., Muñoz, A., Lozano-Rubí, R., Serrano-Balazote, P., Castro, A. L.,
Moreno, O., & Pascual, M. (2017). Examining database persistence of ISO/EN 13606
standardized electronic health record extracts: Relational vs. Nosql approaches. BMC
Medical Informatics and Decision Making, 17(1). https://doi.org/10.1186/s12911-017-
0515-4
73
Shrivarsheni. (2022, April 4). Training custom NER models in SpaCy to auto-detect named
entities. Machine Learning Plus. Retrieved May 25, 2022, from
https://www.machinelearningplus.com/nlp/training-custom-ner-model-in-spacy/
Smallcombe, M. (2019, August 29). Star Schema vs Snowflake Schema. Integrate.io. Retrieved
November 9, 2022, from https://www.integrate.io/blog/snowflake-schemas-vs-star-
schemas-what-are-they-and-how-are-they-different/
Stubbs, A., & Pustejovsky, J. (2013). Natural Language Annotation for Machine Learning: a
Guide to Corpus-Building for Applications. O'Reilly.
Taipalus, T. (2020). The effects of database complexity on SQL query formulation. Journal of
Systems and Software, 165. https://doi.org/10.1016/j.jss.2020.110576
Wickham, H. (2021). Mastering Shiny: Build interactive apps, reports, and dashboards powered
by R. O'Reilly, 2021.

5(3257'2&80(17$7,213$*(
23-03-2023
Master's Thesis
September 2021 - March 2023
Analysis and Optimization of Contract Data Schema
Sun, Franklin, Second Lieutenant, USAF
Air Force Institute of Technology
Graduate School of Engineering and Management (AFIT/EN)
2950 Hobson Way
Wright-Patterson AFB OH 45433-7765
AFIT-ENS-MS-23-M-155
Air Force Life Cycle Management Center
1865 4th St
Wright-Patterson Air Force Base, OH 45433
POC: Mr. Philip Ball ([email protected])
AFMC AFLCMC/DART
DISTRUBTION STATEMENT A. APPROVED FOR PUBLIC RELEASE; DISTRIBUTION UNLIMITED
This material is declared a work of the U.S. Government and is not subject to copyright protection in the United States.
The management, development, and growth of U.S Air Force assets demand extensive organizational communication and
structuring. These interactions yield substantial amounts of contracting and administrative information. Over 4 million such contracts
as a means towards obtaining valuable insights on Department of Defense resource usage. This set of contracting data is largely not
optimized for backend service in an analytics environment. To this end, the following research evaluates the efficiency and
performance of various data structuring methods. Evaluated designs include a baseline unstructured schema, a Data Mart schema, and
a snowflake schema. Overall design success metrics include ease of use by end users, database maintainability, and overall
computational performance. Ease of use and maintainability are determined by examining the structural complexity of each schema.
The resource demands raised by a set of benchmark queries are used to compare computational performance across schema. Results
aggregated from this process suggest that the Data Mart schema is the strongest and most balanced design for this application.
Database Design, Air Force Contracting Data, PostgreSQL, Data Mart, Data Warehouse, Schema Complexity, Database Performance
Evaluation
U
U
U
UU
84
Dr. Jeffrey Weir, AFIT/ENS
(937) 255-3636 Ext 4523 (DSN 785)
