
Reno Tahoe 2019 Visitor Profile Survey
Executive Summary Report
January – December 2019
Reno-Sparks Convention and Visitors Authority

RSCVA VPS 2019 Exec. Summary | 2
Methodology
Monthly surveys of prior-month Washoe County visitors age 21 and older
Survey respondents selected at random from a national web panel of adult residents
3,600 respondents screened nationally to participate each month:
• 1,600 screened monthly across all of US and Western Canada
• Additional 2,000 screened monthly in Western region: Alaska, Arizona, California, Colorado Hawaii,
Idaho, Montana, Nevada, New Mexico, Oregon, Utah, Washington, Wyoming, and Alberta and British
Columbia, Canada
Respondents to screeners weighted to reflect actual population distribution for
geography, age, and gender
Total of 43,354 respondents screened for 2019 survey; 2,139 visited Washoe County and
responded to full survey
When applicable, 2019 results are compared to the 2011, 2013, and 2015 RSCVA Visitor
Profile Surveys of identical methodology

RSCVA VPS 2019 Exec. Summary | 3
Summary of Findings
Three quarters of Reno area visitors have visited before. For visitors, Reno is fun, a good value,
and convenient, as well as a place where they can indulge in nature, arts, and entertainment.
Reno’s visitors are increasingly younger and bringing their families, and most are gaming while
they visit, at least casually.
California continues to figure prominently in Reno visitation, with Los Angeles area residents
making up an increasing share of visitors.
Most visitors to the area stay overnight, with increasing numbers staying in commercial non-
gaming properties. Bookings are increasingly made through online aggregators, and less often
directly with a property.
Three quarters of visitors said they attended an event or sporting event while visiting, with
the wine walk, pub crawl, and Aces and 1868 FC games among the most mentioned.
Most visitors report satisfaction with their visit, and more than half said they would definitely
return for another visit.

Awareness and Media:
How and what do visitors
hear about Reno?

RSCVA VPS 2019 Exec. Summary | 5
Past Visitation
Q2. Before this visit, approximately how many times had you been to the Reno area in 2019, prior to (INSERT MONTH
OF VISIT)?*
31%
26%
25%
First-Time Visitors, 27%
69%
74%
75%
Repeat Visitors, 73%
0%
10%
20%
30%
40%
50%
60%
70%
80%
90%
100%
2011 2013 2015 2019
Three quarters of visitors are repeat visitors to the Reno area.

RSCVA VPS 2019 Exec. Summary | 6
47%
41%
38%
38%
37%
36%
33%
33%
29%
28%
30%
35%
34%
34%
34%
28%
29%
33%
32%
28%
76%
76%
72%
71%
71%
63%
63%
66%
61%
56%
Take a trip to a fun destination
Visit a place that is a good value
Experience/Experiment with new places and things
Take in the majestic beauty of the Sierra Nevada Mountains
Go somewhere I can get to conveniently
Enjoy gambling and casinos
Go to a place where I can fully express myself
Appreciate a high concentration of things to do
that I don’t normally experience side by side
Attend or participate in special events
Experience a vibrant arts community
5 - Extremely important 4
Key Motivators for Visiting
Q27-43. Using the scale below, please indicate how important each of the following was in deciding to visit the
Reno area.
Visiting a “fun destination” and a “place that is a good value” are top drivers for visiting Reno.
Total
Important

RSCVA VPS 2019 Exec. Summary | 7
Reno Media Awareness Sources
Q55. Where did you hear/see something about Reno Tahoe?
*Radio, TV, and Billboard combined for tracking.
While fewer say they are hearing about Reno from family and friends or through traditional print media, a consistent two in
five visitors recall other paid campaign channels.
37%
66%
45%
47%
38%
59%
41%
48%
44%
55%
36%
48%
42%
38%
25%
38%
Radio/TV/Billboard* Family/
Friends
Newspaper/
Magazine
A website
2011 2013 2015 2019
Responses are out of 71% of visitors
who heard something about Reno
before their trip.
RSCVA VPS 2019 Exec. Summary | 8
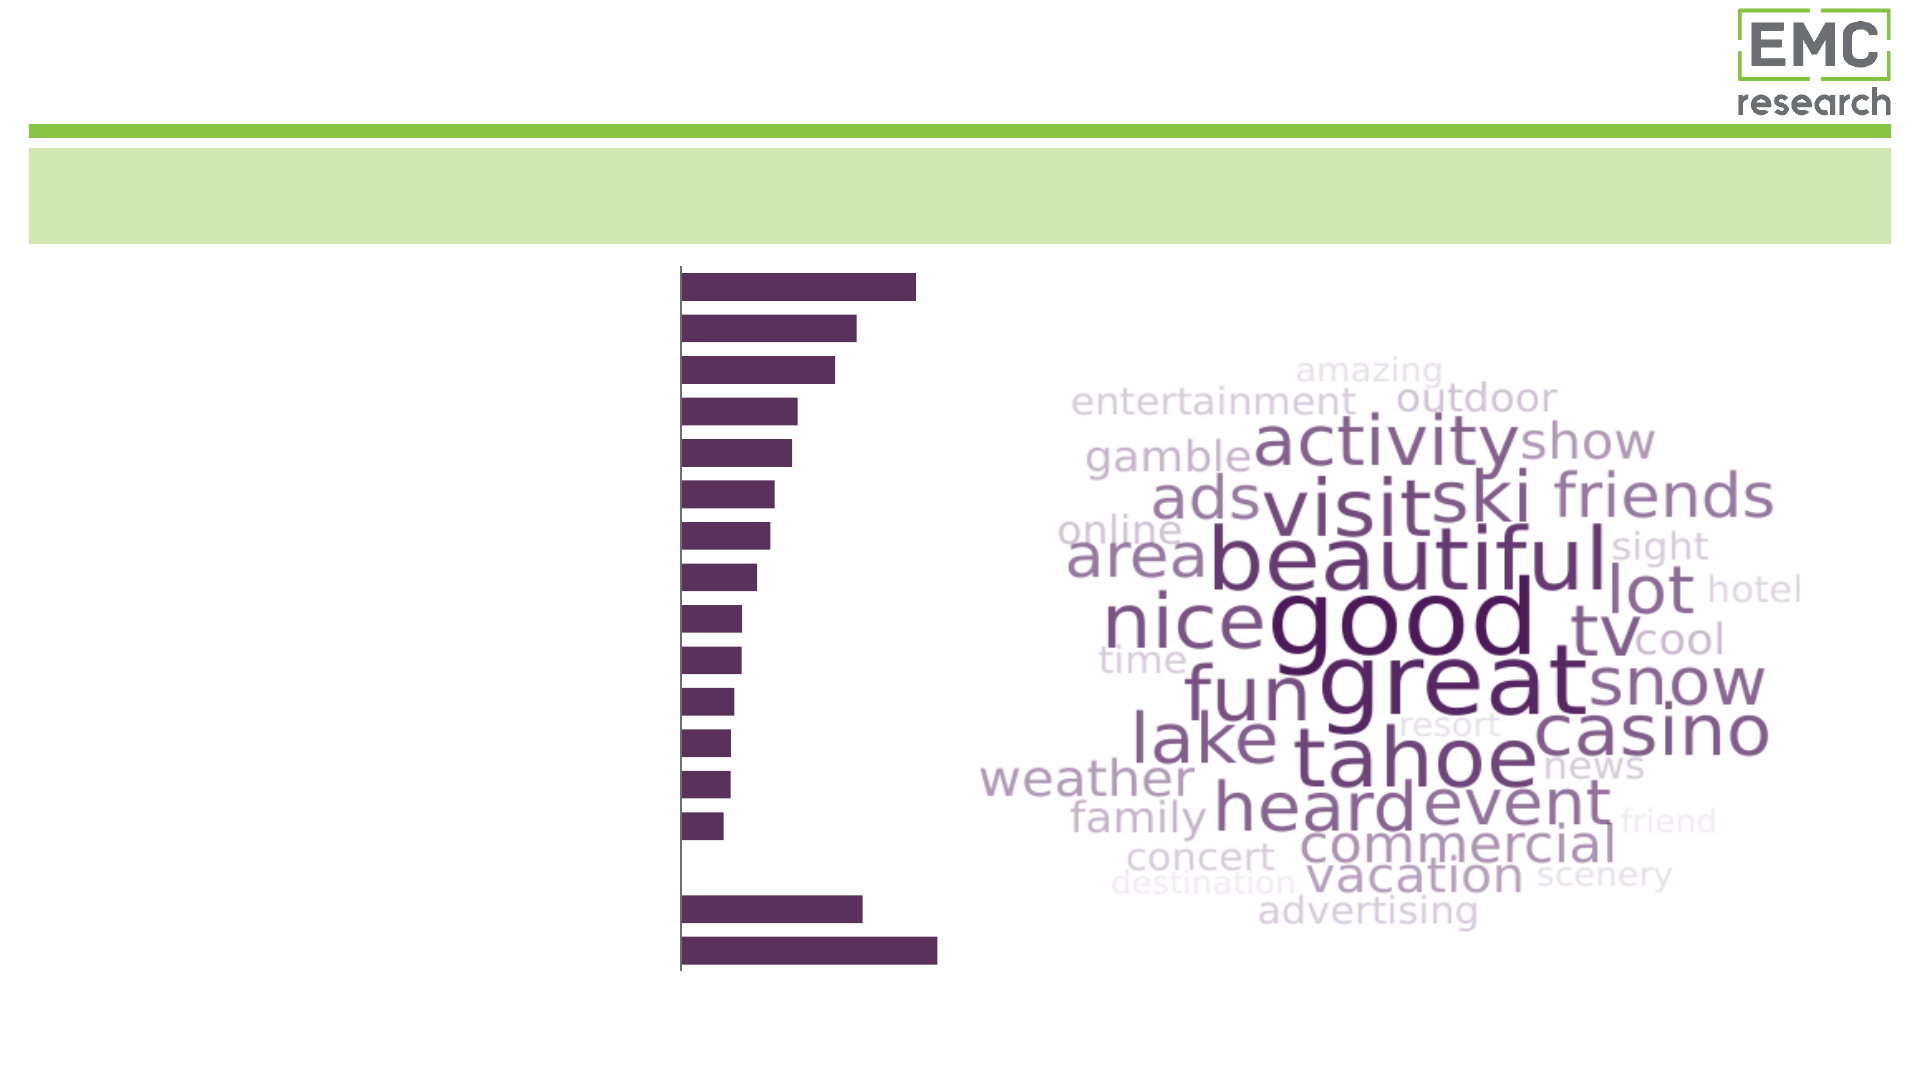
Reno Content Recall
13%
10%
9%
6%
6%
5%
5%
4%
3%
3%
3%
3%
3%
2%
10%
14%
Fun/Great Place
Good/Nice
Beautiful Area/Scenery
Outdoor Activities/Nature
Misc. Ads
Online/Phone Ads
Night Life/Events/Shows
Destination/Attractions/Sightseeing
Casinos, Gambling/Airport
Family/Friends
Variety of Activites
Weather
TV Ads
Get away/Relax/Good vacation spot
Other
Don't know/None
Of those who had heard or seen something about Reno, most make positive comments about the area generally, or the
outdoor activities and natural scenery.
Q54. What did you see or hear about Reno Tahoe recently?

RSCVA VPS 2019 Exec. Summary | 9
VisitRenoTahoe Website Visitation
Q52. Have you ever visited Reno-Tahoe’s website, www.VisitRenoTahoe.com?
26%
34%
38%
Visited VisitRenoTahoe.com,
40%
0%
10%
20%
30%
40%
50%
60%
70%
80%
90%
100%
2011 2013 2015 2019
Visitation to the VisitRenoTahoe website continues to grow.

Visitor Demographics and
Trip Details:
Who visits Reno?

RSCVA VPS 2019 Exec. Summary | 11
2019 Visitor Demographics
43%
31%
18%
8%
21-34
35-49
50-64
65+
Age
61%
39%
Male
Female
Gender
63%
13%
11%
9%
4%
White
African
American
Asian
Latino
Other/Prefer
not to respond
Ethnicity
42% Traveling with kids
58% Traveling without kids
6% LQBTQIA
91% Straight
3% Prefer not to respond

RSCVA VPS 2019 Exec. Summary | 12
Visitor Age
QA. What year were you born?
38%
36%
33%
21-34, 43%
27%
35%
38%
35-49, 31%
19%
20%
21%
50-64, 18%
16%
9%
7%
65+, 8%
0%
10%
20%
30%
40%
50%
60%
70%
80%
90%
100%
2011 2013 2015 2019
The average age continues to decrease, with an increase in Millennial visitors.
Average Age
2019
41
2015
42
2013
43
2011
44
RSCVA VPS 2019 Exec. Summary | 13
Visitors Traveling with Children
The definition of “Traveling with children” is those who had someone in their party under 21, and they are either over
30 or report having children.
21%
31%
35%
Traveling with children,
42%
79%
69%
65%
Not traveling with
children, 58%
0%
10%
20%
30%
40%
50%
60%
70%
80%
90%
100%
2011 2013 2015 2019
More Reno visitors are traveling with children than in previous years.

RSCVA VPS 2019 Exec. Summary | 14
Gaming
Core Gamer: Gamer + either rated gaming as extremely important and spent more than $200 on gaming, stayed overnight in a gaming hotel and spent more than
$250 on gaming, or spent more than $1,000 on gaming.
Middle Gamer: Gamer + not a core gamer and either spent more than $150 on gaming or stayed in a gaming hotel and spent more than $100 on gaming.
Casual Gamer: Gamer + not a core or middle gamer and either spent money on gaming or reported participating in gaming.
18%
17%
19%
Core gamer, 15%
18%
17%
12%
Middle gamer, 13%
30%
30%
27%
Casual gamer, 42%
34%
37%
42%
Non-gamer, 30%
0%
10%
20%
30%
40%
50%
60%
70%
80%
90%
100%
2011 2013 2015 2019
There are more casual gamers and fewer non-gamers overall, though the amount of core and middle gamers remains
relatively similar over the years.

RSCVA VPS 2019 Exec. Summary | 15
Visitors by Home State
A plurality of visitors to Washoe County are from California.
Visitors by Region
West 44%
South 29%
Midwest 15%
Northeast 12%
Top States by % of Visitors
California 27%
Texas 7%
New York 6%
Florida 5%
Illinois 5%
Nevada 4%
Note: Western
Region also includes
Alberta and British
Columbia, Canada

RSCVA VPS 2019 Exec. Summary | 16
Visitor Origin Over Time
QD. What state or province do you live in?
Note: Western Region also includes Alberta and British Columbia, Canada
10%
11%
11%
Northeast, 12%
13%
12%
15%
Midwest, 15%
19%
24%
26%
South, 29%
58%
53%
48%
West, 44%
0%
10%
20%
30%
40%
50%
60%
70%
80%
90%
100%
2011 2013 2015 2019
A plurality of visitors continue to be from the Western region of the United States, though that proportion has dropped since
2011 with an increase of visitors from other regions.

RSCVA VPS 2019 Exec. Summary | 17
California Visitor Origin Over Time
A plurality of California visitors come from the Los Angeles area, followed by the Bay and Sacramento Areas.
Percentages in this chart represent the total share of visitors from California to Reno, NV.
27%
31%
33%
Los Angeles, 39%
37%
32%
29%
SF Bay Area, 25%
San Diego, 6%
Central Coast, 1%
Central Valley, 8%
North, 4%
19%
19%
18%
Sacramento, 17%
0%
10%
20%
30%
40%
50%
60%
70%
80%
90%
100%
2011 2013 2015 2019

RSCVA VPS 2019 Exec. Summary | 18
Visitor Lodging
Q8. Where were your accommodations during this trip to the Reno area?
“Commercial non-gaming” includes non-gaming hotels, motels, and rentals/timeshares
“Other commercial gaming” includes Reno suburban, Sparks, and Lake Tahoe gaming hotels
“Non-commercial” includes friends/family and other
18%
13%
15%
Other comm. gaming,12%
20%
21%
18%
Reno dwntn commercial
gaming, 15%
29%
34%
37%
Commercial non-gaming,
44%
13%
11%
10%
Non-commercial, 13%
20%
21%
20%
Day tripper, 15%
0%
10%
20%
30%
40%
50%
60%
70%
80%
90%
100%
2011 2013 2015 2019
More visitors continue to stay at non-gaming commercial hotels in Reno compared to other lodging options.
RSCVA VPS 2019 Exec. Summary | 19
Visitor Origin by Lodging Type
California regions are shown out of total California visitors, not total Reno visitors.
Group 2019 Overall
Commercial non-
gaming
(44%)
Commercial Reno
downtown
gaming
(15%)
Other commercial
gaming
(12%)
Non
-
commercial
(family/friends)
(13%)
Day tripper
(15%)
Northeast
12% 14% 6% 10% 12% 12%
Midwest
15% 17% 17% 8% 11% 17%
South
29% 34% 18% 26% 34% 27%
West
44% 35% 59% 56% 43% 45%
California Visitors
Los Angeles
39% 53% 32% 26% 42% 28%
SF Bay Area
25% 22% 32% 32% 22% 19%
San Diego
6% 7% 3% 4% 6% 7%
Central Coast
1% 2% 0% 1% 1% 1%
Central Valley
8% 7% 12% 9% 8% 4%
Northern CA
4% 2% 4% 6% 1% 7%
Sacramento
17% 7% 17% 21% 19% 35%
Day trippers are most likely to come from the Sacramento area, while Los Angeles Area residents are most likely to stay in
non-gaming commercial properties.

RSCVA VPS 2019 Exec. Summary | 20
Lodging Reservation
Q14. How did you make your lodging or hotel reservations?
Over time, more and more reservations are made through online travel sites, and fewer directly with the property.
28%
45%
9%
5%
13%
36%
36%
9%
4%
16%
42%
33%
13%
3%
10%
50%
27%
11%
3%
9%
Online travel site Directly with hotel/motel Casino host/employee My company Other
2011 2013 2015 2019

Spend and Activities:
What do visitors do in Reno?

RSCVA VPS 2019 Exec. Summary | 22
Total Self-Reported Spending
Q44. Thinking about your typical 24-hour day in the Reno area, on average, about how much money did you spend per
person, per day for each of the categories below?
$639
$685
$681
Overall, $761
$305
$354
$411
Non-gaming, non-lodging,
$425
$219
$216
$147
Gaming, $195
$115 $115
$123
Lodging, $140
$0
$100
$200
$300
$400
$500
$600
$700
$800
$900
$1,000
2011 2013 2015 2019
Self-reported spending has risen since 2015, both in the gaming and non-gaming categories.

RSCVA VPS 2019 Exec. Summary | 23
Spending by Lodging Type
Q44. Thinking about your typical 24-hour day in the Reno area, on average, about how much money did you spend per
person, per day for each of the categories below?
Those staying at gaming hotels report an overall higher spend.
$761
$756
$881
$1,039
$684
$326
$195
$134
$355
$423
$120
$89
$140
$152
$107
$144
$107
$-
$425
$469
$419
$472
$456
$237
All property types Commercial non-
gaming (44%)
Reno downtown
gaming (15%)
Other commercial
gaming (12%)
Non-commerical
(family/friends) (13%)
Day tripper (15%)
Overall average spend Average gaming spend Average lodging spend Average other spend

RSCVA VPS 2019 Exec. Summary | 24
Breakout: Millennial Spend
Q44. Thinking about your typical 24-hour day in the Reno area, on average, about how much money did you spend per
person, per day for each of the categories below?
On average, millennials spend more on lodging, shopping, and entertainment, and less on gaming.
$140
$195
$89
$73
$120
$47
$54
$41
$151
$170
$88
$84
$134
$50
$55
$39
Lodging Gaming Food/ drink Entertainment Shopping Sightseeing Recreation Other
All Visitors Millennials (43%)

RSCVA VPS 2019 Exec. Summary | 25
Breakout: Family Spend
Q44. Thinking about your typical 24-hour day in the Reno area, on average, about how much money did you spend per
person, per day for each of the categories below?
Families spend more on lodging and recreation, and less on gaming.
$140
$195
$89
$73
$120
$47
$54
$41
$161
$151
$96
$83
$133
$61
$70
$45
Lodging Gaming Food/ drink Entertainment Shopping Sightseeing Recreation Other
All Visitors Traveling with Children (42%)

RSCVA VPS 2019 Exec. Summary | 26
Breakout: Gamer Spend
Q44. Thinking about your typical 24-hour day in the Reno area, on average, about how much money did you spend per
person, per day for each of the categories below?
Core and middle gamers spend more in nearly all categories, while casual gamers tend to spend the least.
$140
$195
$89
$73
$120
$47
$54
$41
$140
$630
$146
$131
$182
$80
$109
$87
$141
$53
$64
$53
$95
$36
$36
$30
Lodging Gaming Food/ drink Entertainment Shopping Sightseeing Recreation Other
All Visitors Core + Middle Gamers (28%) Casual Gamers (42%)

RSCVA VPS 2019 Exec. Summary | 27
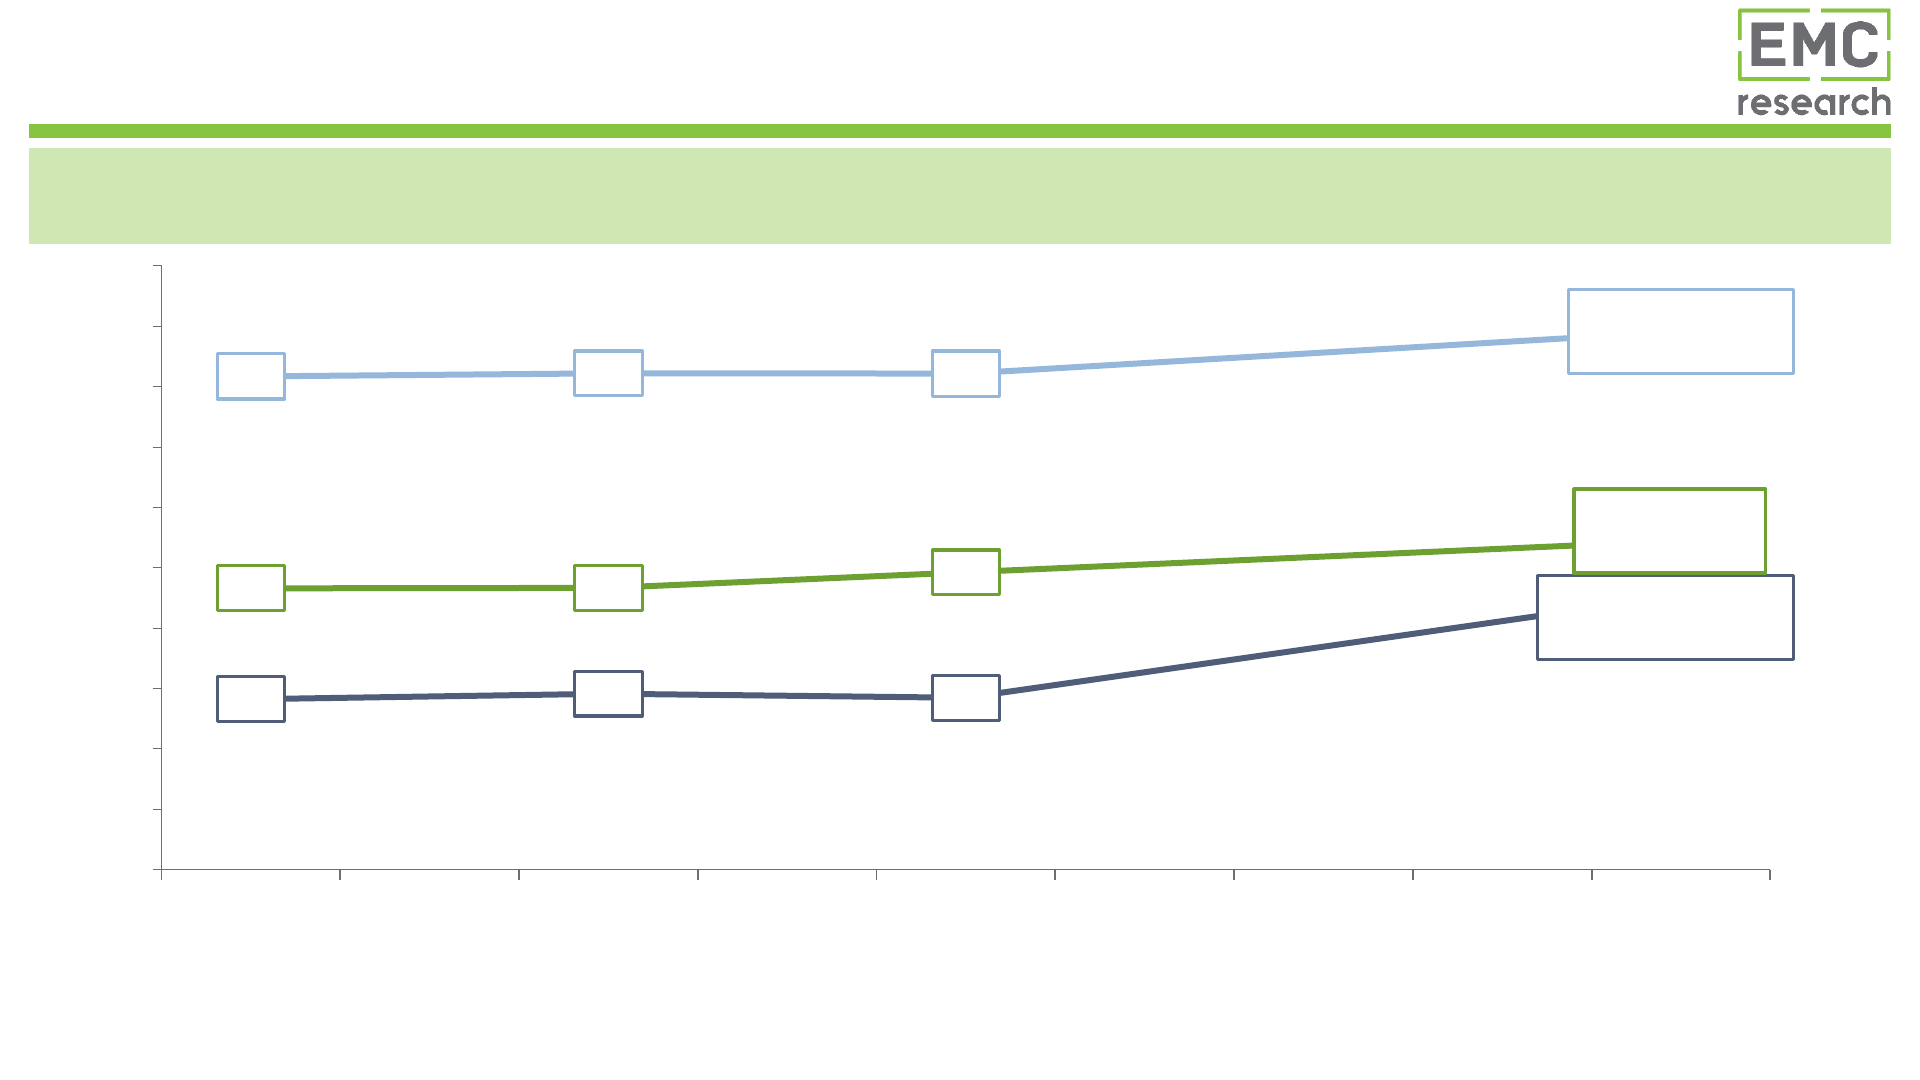
Self-Reported Participation in Activities
Q22-26. Did you attend/participate in any of the following activities during your most recent trip to the Reno area?
*Questions about attendance at specific events were added starting in 2015
More report attending events, entertainment, and live sports in 2019, as well as shopping and recreation. Self-reported
participation in gaming activities continues to decline.
90%
61%
54%
56%
33%
31%
21%
89%
60%
56%
48%
40%
33%
28%
85%
51%
56%
42%
63%
26%
21%
89%
64%
69%
37%
75%
27%
14%
Vacation Shopping Recreation Gaming *Events/ Ent/
Live Sports
Family and
Friends
Business/
Convention
2011 2013 2015 2019

RSCVA VPS 2019 Exec. Summary | 28
Top 2019 Special Events by Quarter
Q23. Did you attend or participate in any of the following activities during your
most recent trip to the Reno area?
Special Event Q1 2019
Reno Wine Walk
10%
Reno Pub Crawl
6%
Reno 1868 FC Soccer Game
5%
Safari Club International (Jan Only)
3%
The Sheep Show (Feb Only)
3%
Rocky Mountain Oyster Fry (Mar Only)
2%
Special Event Q2 2019
Reno Aces Baseball Game
11%
Reno Wine Walk
10%
Reno Pub Crawl
6%
Reno Rodeo/PRCA Xtreme Bull (June Only)
6%
Reno 1868 FC Soccer Game
5%
The Great Eldorado BBQ, Brews and Blues
(June Only)
3%
Special Event Q3 2019
Reno Aces Baseball Game
13%
Reno Wine Walk
7%
Reno 1868 FC Soccer Game
6%
Reno Pub Crawl
5%
Hot August Nights (Aug Only)
3%
Lake Tahoe Shakespeare Festival (Aug Only)
2%
Special Event Q4 2019
Reno Wine Walk
11%
Reno Pub Crawl
7%
Reno Aces Baseball Game
7%
Reno 1868 FC Soccer Game
5%
Reno Pop Culture Con (Nov Only)
3%
Zombie Crawl (Oct Only)
3%
The Aces, 1868FC, Wine Walks, and Pub Crawls are consistent attractions for visitors.

RSCVA VPS 2019 Exec. Summary | 29
Breakout: Millennial Activities
Q22-26. Did you attend/participate in any of the following activities during your most recent trip to the Reno area?
*Events/Ent/Live Sports questioning changed from 2013 to 2015
Millennials are more likely to engage in recreation and live entertainment and events.
89%
64%
69%
37%
75%
27%
14%
92%
65%
80%
29%
84%
28%
14%
Vacation Shopping Recreation Gaming *Events/ Ent/
Live Sports
Family and Friends Business/
Convention
All Visitors Millennials (43%)
Top special events:
UNR live sporting event
Reno Wine Walk
Amateur/youth sports tournament
Reno Pub Crawl

RSCVA VPS 2019 Exec. Summary | 30
Breakout: Family Activities
Q22-26. Did you attend/participate in any of the following activities during your most recent trip to the Reno area?
*Events/Ent/Live Sports questioning changed from 2013 to 2015
Families visiting Reno tend to participate in more recreation activities.
89%
64%
69%
37%
75%
27%
14%
92%
67%
80%
30%
79%
33%
17%
Vacation Shopping Recreation Gaming *Events/ Ent/
Live Sports
Family and Friends Business/
Convention
All Visitors Traveling with Children (42%)
Top special events:
UNR live sporting event
Reno Wine Walk
Amateur/youth sports tournament
Other live sporting event
Reno Aces baseball game

RSCVA VPS 2019 Exec. Summary | 31
Participation in Activities Among Gamers
Q22-26. Did you attend/participate in any of the following activities during your most recent trip to the Reno area?
*Questions about attendance at specific events were added starting in 2015
Core gamers participate in activities other than gaming at a similar rate as visitors overall.
89%
64%
69%
37%
75%
27%
14%
92%
70%
67%
67%
82%
24%
12%
93%
68%
79%
43%
82%
17%
Vacation Shopping Recreation Gaming **Events/ Ent/
Live Sports
Family and Friends Business/
Convention
All Visitors Core + Middle Gamers (28%) Casual Gamers (42%)

Visitor Satisfaction and
Intent to Return:
Do visitors enjoy Reno and
will they come back?
RSCVA VPS 2019 Exec. Summary | 33
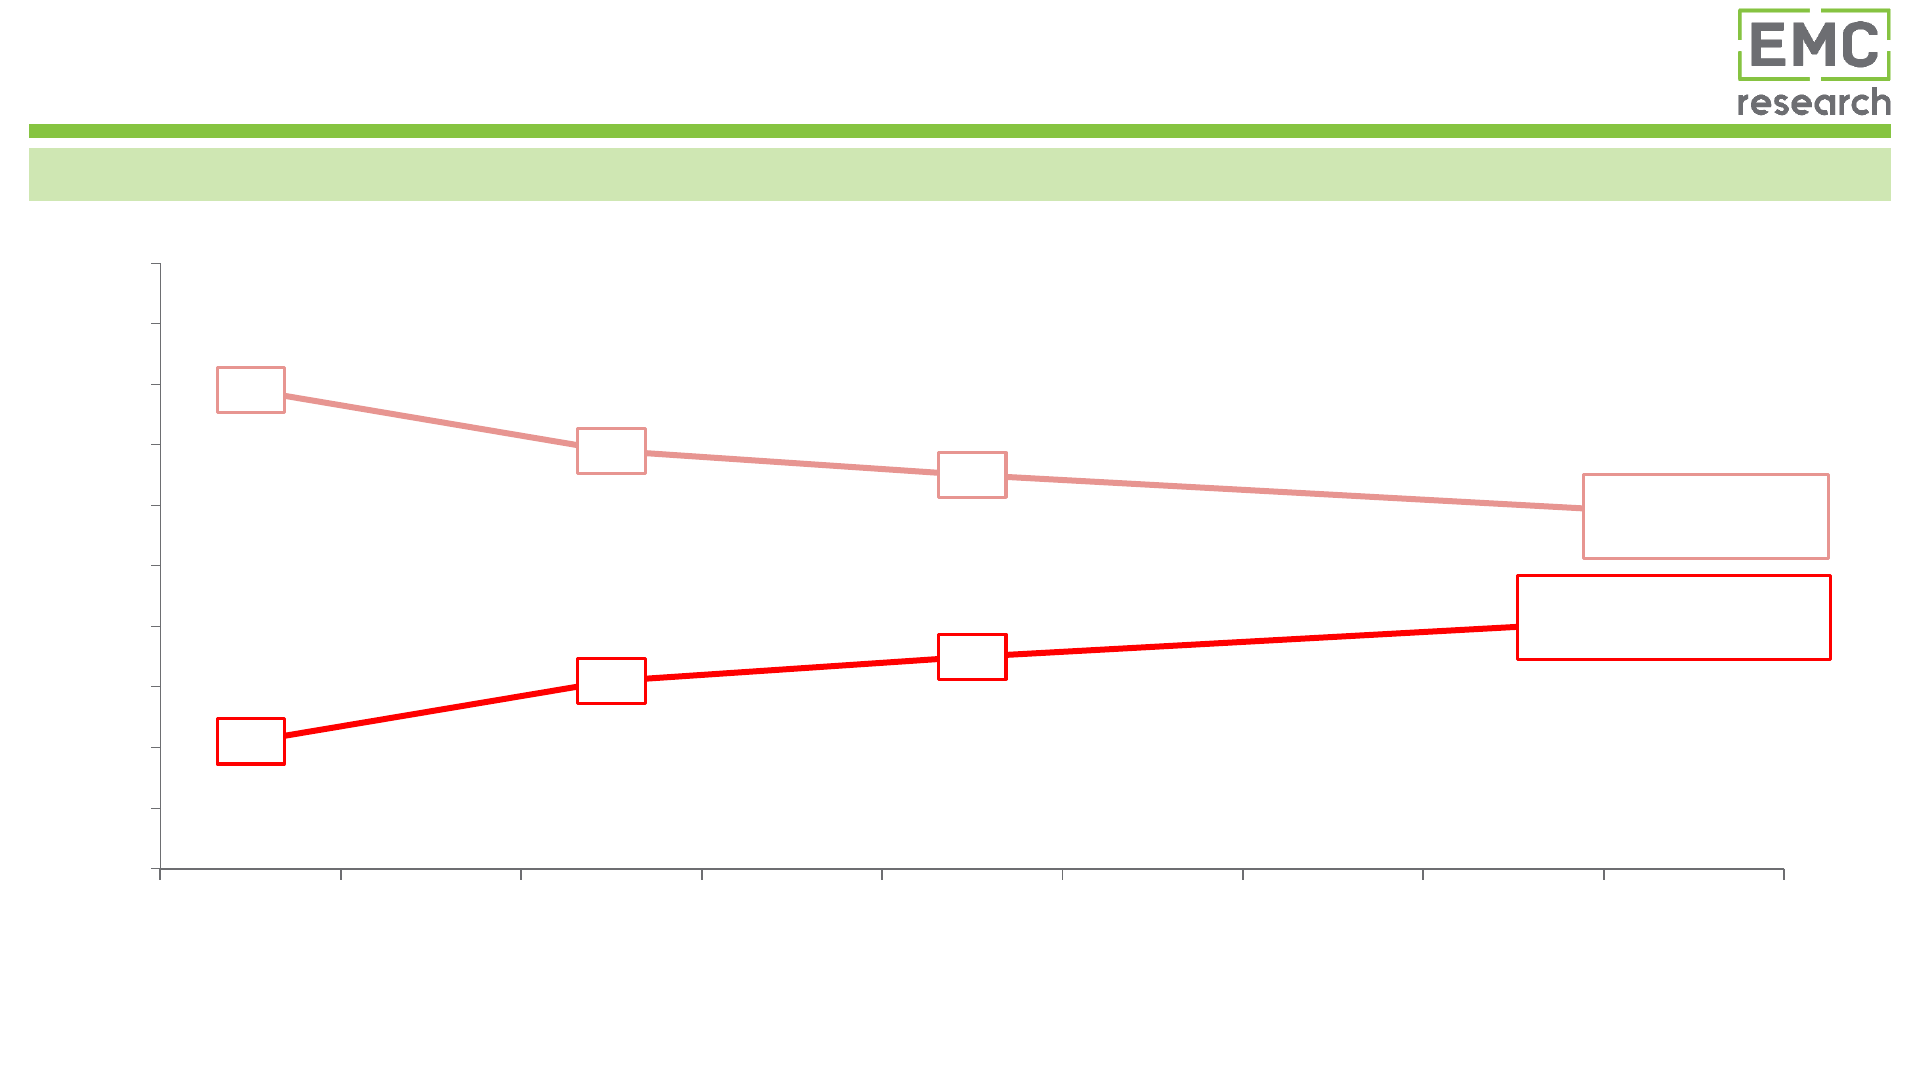
Returning to Reno and Experience Rating
Q45. On the following scale, how would you rate your overall experience on your most recent trip to the Reno area?
Q48. What is the likelihood that you will return to the Reno area in the next two years?
82%
82%
82%
Satisfied with
experience, 89%
28%
29%
28%
Rate experience as
excellent, 45%
47%
47%
49%
Will definitely
return, 54%
0%
10%
20%
30%
40%
50%
60%
70%
80%
90%
100%
2011 2013 2015 2019
Nearly all Reno visitors continue to be satisfied with their visit, and more than half say they will definitely return. The
proportion of visitors who rate their experience as excellent has increased significantly.

RSCVA VPS 2019 Exec. Summary | 34
Positive Experiences in Reno
16%
15%
13%
8%
8%
6%
5%
3%
3%
3%
3%
2%
8%
6%
Fun/Good/Great
City/Sightseeing/Activites
Nature/Outdoors/Scenery
Casinos/Gambling/Hotel
Family/Friends
Everything
Relaxing/Get away
Experience/Something new
Weather
Food/Restaurant/Shops
People/Locals
Convenient/Close/Cheap
Other
Don't know/Nothing
Those who had a positive experience comment that it is a fun location, and about the city, sightseeing and activities offered.
Q47. What did you especially like about your experience?

RSCVA VPS 2019 Exec. Summary | 35
Negative Experiences in Reno
13%
9%
7%
6%
4%
3%
3%
14%
41%
Dislike the area/Nothing to
do/Passing Through
Too crowded/Traffic
Casinos/Hotel/Shops
People/Homeless/Dirty/Run
down
Long drive/Far
away/inconvenient
Weather
Cost
Other
Don't know/Nothing
Of those who had a negative experience, the comments are less specific; some indicate that they did not like the area, traffic,
or casinos.
Q46. What did you dislike about your experience?
RSCVA VPS 2019 Exec. Summary | 36
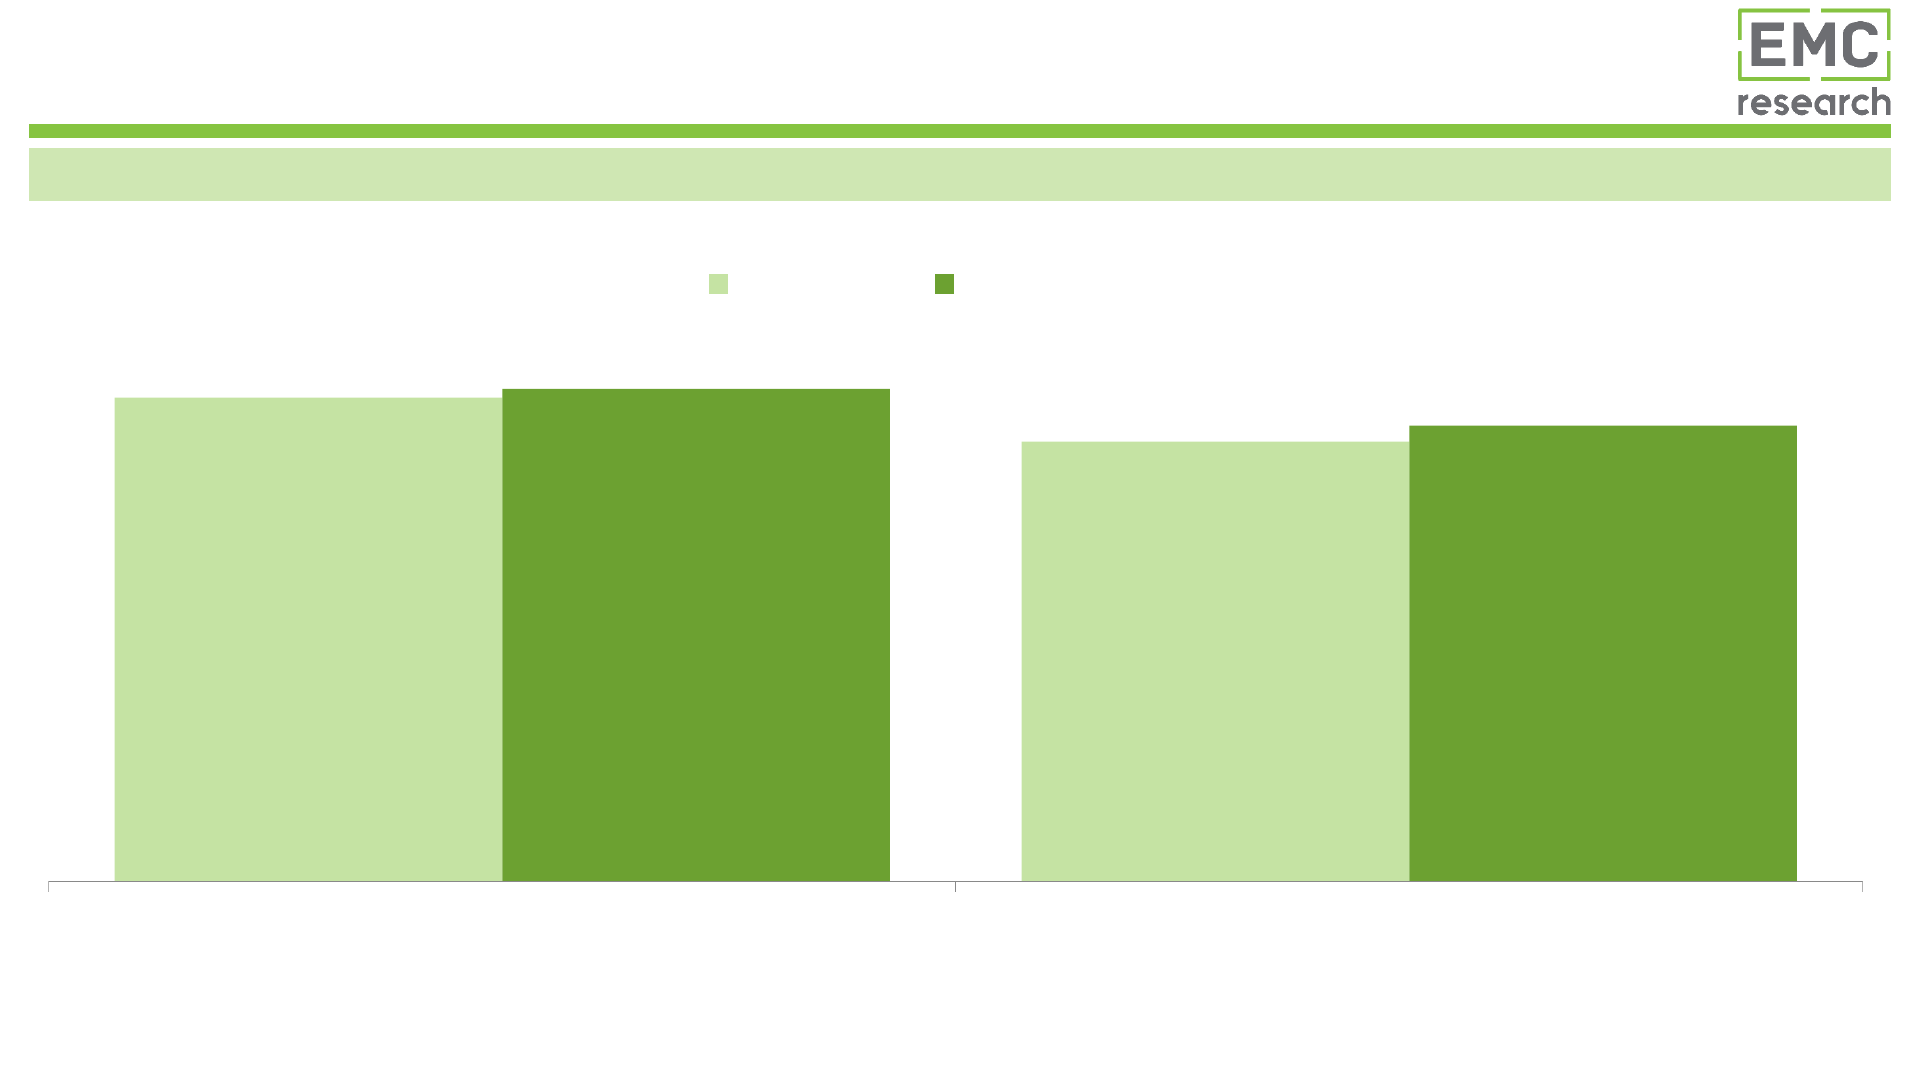
Breakout: Millennial Visit Ratings
Q45. On the following scale, how would you rate your overall experience on your most recent trip to the Reno area?
Q48. What is the likelihood that you will return to the Reno area in the next two years?
Millennials have similar ratings and intent to return to Reno as visitors overall.
89%
81%
91%
84%
Rate visit positively Likely to return
All Visitors Millennials (43%)

RSCVA VPS 2019 Exec. Summary | 37
Breakout: Family Visit Ratings
Q45. On the following scale, how would you rate your overall experience on your most recent trip to the Reno area?
Q48. What is the likelihood that you will return to the Reno area in the next two years?
Families also give Reno strong ratings, and nearly all say they are likely to return.
89%
81%
91%
87%
Rate visit positively Likely to return
All Visitors Traveling with Children (42%)

RSCVA VPS 2019 Exec. Summary | 38
Breakout: Gamer Visit Ratings
Q45. On the following scale, how would you rate your overall experience on your most recent trip to the Reno area?
Q48. What is the likelihood that you will return to the Reno area in the next two years?
Gamers tend to have a more positive experience and are more likely to return to Reno than non-gamers.
89%
81%
92%
85%
93%
73%
Rate visit positively Likely to return
All Visitors Core + Middle Gamers (28%) Casual Gamers (42%)

Sara LaBatt
sara@emcresearch.com
510.550.8924
Mallory Thayer
mallory@emcresearch.com
614.827.9676
Jonathan Lee
jonathanl@emcresearch.com
510.550.8921
