
ANNUAL COMPREHENSIVE
FINANCIAL REPORT
For the year ended June 30, 2022
RENO-TAHOE AIRPORT AUTHORITY
Reno, Nevada
ANNUAL COMPREHENSIVE
FINANCIAL REPORT
FOR THE YEAR ENDED JUNE 30, 2022
Prepared by
Finance Department
Randall O. Carlton
Chief Finance & Administration Officer

RENO-TAHOE AIRPORT AUTHORITY
ANNUAL COMPREHENSIVE FINANCIAL REPORT
FOR THE YEAR ENDED JUNE 30, 2022
Table of Contents
I. Introductory Section (Unaudited) Page(s)
Letter of Transmittal ...................................................................................................... 1-13
Board of Trustees and Senior Management…………………………………… ............. 14
Organization Chart............................................................................................................ 15
Certificate of Achievement for Excellence in Financial Reporting .................................. 16
II. Financial Section
Independent Auditor’s Report ................................................................................... 17-19
Management’s Discussion and Analysis ................................................................... 20-31
Basic Financial Statements:
Statement of Net Position ............................................................................... 32-33
Statement of Revenues, Expenses and Changes in Net Position ......................... 34
Statement of Cash Flows ................................................................................ 35-36
Notes to Financial Statements ........................................................................ 37-65
Required Supplementary Information:
Schedule of Changes in the RTAA’s Total OPEB Liability
and Related Ratios ............................................................................................... 66
Schedule of RTAA’s Proportionate Share of the Net Pension Liability ............. 67
Schedule of Pension Plan Contributions .............................................................. 68
Supplementary Information:
Schedule of Revenues and Expenses, Comparison of Budget to Actual ............. 69
III. Statistical Section (Unaudited)
Statistical Section Explanations ........................................................................................ 70
Financial Trends
Net Position and Changes in Net Position ...................................................... 71-72
Summary of Operating Results ....................................................................... 73-74
Revenue Capacity
Principal Revenue Payers ............................................................................... 75-76
Principal Revenue Sources ............................................................................. 77-78
Revenue Rates and Cost per Enplanements ......................................................... 79
Debt Capacity
Schedule of Debt and Obligation Coverages ....................................................... 80
Rate Maintenance Covenant Performance ...................................................... 81-82
Ratios of Outstanding Debt and Debt Service ................................................ 83-84
Demographic and Economic Information
Population in Air Trade Area .............................................................................. 85
Principal Employers ............................................................................................ 86
Operating Information
Employees ........................................................................................................... 87
Operational Statistical Summary ......................................................................... 88
Enplanements and Market Share by Scheduled Airline ................................. 89-91
Landed Weights and Market Share by Scheduled Airline .............................. 92-94
Capital Asset Information ............................................................................... 95-96

IV. Compliance Section
Independent Auditor’s Report on Internal Control over Financial Reporting and on
Compliance and Other Matters Based on an Audit of Financial Statements
Performed in Accordance with Government Auditing Standards ....................... 97-98
Independent Auditor’s Report on Compliance for Each Major Federal Program and
Report on Internal Control Over Compliance ..................................................... 99-101
Schedule of Expenditures of Federal Awards ................................................................. 102
Notes to Schedule of Expenditures of Federal Awards .................................................. 103
Schedule of Findings and Questioned Costs ................................................................... 104
Independent Auditor’s Report on Compliance with Requirements Applicable to
The Passenger Facility Charge (PFC) Program and on Internal Control Over
Compliance and the Schedule of Passenger Facility Charges Collected and
Expended ....................................................................................................... .....105-107
Sched
ule of Passenger Facility Charges Collected and Expended ................................. 108
Schedule of Passenger Facility Charges Findings and Questio
ned Costs ...................... 109

Introductory
Section
November 30, 2022
Board of Trustees
Reno-Tahoe Airport Authority
Reno, Nevada
This report is the Annual Comprehensive Financial Report (ACFR) of the Reno-Tahoe Airport Authority
(“RTAA” or “Authority”) for the fiscal year July 1, 2021, through June 30, 2022. The staff of the RTAA
prepared this report and is responsible for the information it contains. The purpose of this report is to
present fully and fairly RTAA’s financial position, operating results, and cash flows.
Management assumes full responsibility for the accuracy, completeness and reliability of the information
contained in this report, based upon a comprehensive framework of internal controls that it has established
for this purpose. The design of the internal accounting controls employed by RTAA is to provide
reasonable assurance that assets will be safeguarded against loss and that financial records will be reliable
for use in preparing financial statements that are free of any material misstatements.
This ACFR contains financial statements and statistical data that fully disclose all the material financial
operations of RTAA. A narrative overview and analysis of RTAA’s financial activities that occurred
during the fiscal year ended June 30, 2022, are presented in the Management’s Discussion and Analysis
(MD&A) found at the beginning of the Financial Section.
This ACFR reflects guidelines recommended by the Government Finance Officers Association of the
United States and Canada (GFOA). The GFOA awards a Certificate of Achievement to those entities
whose annual financial reports conform to the high standards of public financial reporting, including
generally accepted accounting principles issued by the Governmental Accounting Standards Board. It is
our belief that the accompanying ACFR also meets these program standards and will be submitted to the
GFOA for review.
REPORTING ENTITY
The RTAA is a quasi-municipal corporation created by the Nevada State Legislature and began operation
on July 1, 1977. The act creating RTAA provides that it will serve a public use and will facilitate safe and
convenient air travel and transport to and from the Reno-Tahoe area. RTAA is an independent entity that
is not part of any other unit of local government and does not use local property or sales tax revenue to
fund its operation.
1

The City of Reno, City of Sparks, Washoe County, and the Reno-Sparks Convention & Visitors Authority
(RSCVA) appoint the nine-member Board of Trustees that governs RTAA. Four members appointed by
the City of Reno, two by the City of Sparks, two by Washoe County, and a ninth board member by the
RSCVA. The Board of Trustees serve a four-year term, and terms are staggered to ensure the continued
presence of experienced members.
RTAA owns and operates the Reno-Tahoe International Airport (RNO) and the Reno-Stead Airport
(RTS). RTS is a general aviation facility that is home to approximately 200-based aircraft, as well as the
famous Reno National Championship Air Races. According to the latest available Federal Aviation
Administration (FAA) statistics, RNO is the 63
rd
busiest commercial passenger airport in the nation. RNO
also has substantial cargo activity and a vibrant general aviation community.
The geographical, or catchment area, served by RNO primarily encompasses the seven northern Nevada
counties of Churchill, Douglas, Humboldt, Lyon, Pershing, Storey, and Washoe and the major cities of
Reno, Sparks, and Carson City (the capital of the State of Nevada). The total catchment area for RNO
also includes the Lake Tahoe area and several communities in northeastern California.
As defined by the FAA, RNO is a medium hub commercial airport which served over 1.8 million
passengers in calendar year 2021. RNO is located four miles southeast of Reno’s central business district.
RTS is a general aviation airport located 11 miles northwest of the central business district. Carson City,
the capital of Nevada, is 30 miles south of Reno. The closest competing commercial airport is 115 miles
away in Sacramento, California. Commercial air service for the public is provided by Alaska Airlines,
Allegiant, American Airlines, Delta Airlines, Frontier Airlines, JetBlue, Southwest Airlines, Spirit
Airlines, Sun Country, United Airlines, and Volaris. Commercial cargo carriers include FedEx, United
Parcel Service (UPS), and DHL. In calendar year 2022, more than 147 million pounds of air cargo was
transported through RNO. Air cargo operations occupy about 25 acres north of the RNO passenger
terminal with two buildings used for air cargo activities that consist of approximately 67,300 square feet.
The ramp facilities can handle 14 aircraft. These facilities serve air cargo carriers including DHL, FedEx,
and UPS and accommodate all types of cargo aircraft.
ECONOMIC CONDITION AND OUTLOOK
The U.S. economy has faced some recent challenges brought on by high inflation, gas prices, and labor
force shortages. After a strong rebound of stock markets last year, 2022 has been a year of high volatility.
The Dow Jones Industrial average hit 36,800 on January 4, 2022, a new record, and 29,900 on June 16,
2022. S&P 500 recorded 4,800 and 3,700 on the same days.
The Bureau of Labor Statistics’ July report mentions the average unemployment rate of 3.5%, the lowest
level since February 2020, pre-pandemic. Total nonfarm payroll employment rose by 528,000 in July,
larger than the average monthly gain over the prior four months. The labor force participation rate of
62.1% has declined in recent months but exceeds the 61.7% recorded in July 2021.
According to the Congressional Budget Office’s (CBO) projections in July 2022, the current and
future economic impact of the COVID-19 pandemic can be summarized as follows:
The federal budget deficit is expected to reach $1 trillion in 2022, $1.8 trillion less than 2021. At
3.9% of gross domestic product (GDP), the projected deficit in 2022 is much smaller than those
recorded in 2020 and 2021, as federal spending in response to the coronavirus pandemic has
tempered and revenues have risen sharply. Based on CBO’s projections, federal deficits over the
2022–2052 period will average 7.3% of GDP, more than double the average over the past half-
century. This is primarily due to the increase in interest cost.
2

Federal spending in 2022 is expected to represent 23.5% of GDP, a reduction from 2021 and
continuing a declining trend in 2023 and 2024 as federal spending in response to the COVID-19
pandemic diminishes.
Federal debt held by the public is projected to reach 98% of GDP. According to the CBO debt
begins to rise in 2024, surpasses its historical high in 2031 (107%), and continues to climb
thereafter, rising to 185% of GDP in 2052.
Real, inflation adjusted GDP is expected to grow by 3.1% in 2022. After 2022, economic growth
is expected to slow and inflationary pressures ease.
The greater Reno area’s economic picture has become far more diversified and the growth in recent years
has been significant. The Reno-Tahoe regional area economy is no longer relying solely on tourism and
gaming, as it was at the time of the 2008 great recession. Northern Nevada’s business friendly
environment, proximity to customers, availability of skilled workforce and logistics continues to attract a
diverse group of businesses to the area. Companies like Tesla, Panasonic, Switch, Microsoft, Apple,
Rackspace, Amazon, Zulily, Patagonia, Urban Outfitters, Thrive Market, and Petco all call Northern
Nevada home for critical business functions.
The diversity of industry in Northern Nevada is expected to provide a solid foundation for recovery and
long-term growth following the COVID-19 pandemic. It will also help soften the effects of a potential
recession. Nevada’s June unemployment rate dropped to 4.7% compared to the 29.5% reached at the
height of the pandemic in April 2020 according to the Nevada Department of Employment, Training and
Rehabilitation (DETR). Of the three Metropolitan Statistical Areas (MSA) in Nevada, Reno’s
unemployment rate was the lowest at 3.3%, while the Las Vegas area was at 5.7% and Carson at 3.7% in
June 2022.
Reno MSA industry trends for the month of June, as published by Ekay Consulting:
Business Activity Index – provides historical and current trends for business activity in the Reno
MSA region. It includes data on employment, gaming revenue, taxable sales, and airline activity
at RNO (passengers and cargo). The Index shows a 3.19% increase between May and June 2022,
and a 2.22% decline from the same period last year (June 2021).
Construction Index – provides historical and current trends for the construction industry in the
Reno MSA region. It includes data on construction employment, commercial permits,
commercial permit valuation, residential permit units, and residential permit valuation. The index
shows a decrease of 7.53% between May and June 2022, and 26.52% compared to the same month
in the previous year (June 2022). Construction employment has increased both month over month
and year over year. Commercial and residential permit values, and the number of commercial and
residential permits have declined compared to the previous month and the previous year when
adjusted for inflation and seasonality.
Housing Affordability Index – based on a ratio of median family income to qualifying family
income, or the income necessary to purchase a median priced home in Washoe County. Includes
data on median price of new and existing homes in Washoe County, median family income, US
30-year fixed mortgage rate. A ratio of 100 indicates that median family income is sufficient to
purchase a median-priced home. The second quarter (2Q) 2022 index of 61.83 indicates median
family income is 38.17% below the income necessary to qualify for median priced home. The
index declined by 14.51% between 2Q 2022 and 1Q 2022, making homes in the region less
affordable.
3

AIR SERVICE MARKET UPDATE
Passenger Airlines
U.S. scheduled passenger airlines reported a 2021 after-tax net loss of $2.8 billion, declining for the
second straight year after seven consecutive annual after-tax profits and a pre-tax operating loss of $17.3
billion, declining for the second straight year after 11 consecutive annual pre-tax profit. In 2020, the
airlines reported after-tax net loss of $35.0 billion.
The airlines reported a $17.3 billion pre-tax operating loss in 2021, improved results when compared to
the $46.5 billion loss in 2020. Total 2021 operating revenue was $130.0 billion. The airlines collected
$86.7 billion from fares, 66.7% of total operating revenue, $5.3 billion from baggage fees, 4.1% of total
operating revenues. Reservation change fees were $698 million, or 0.5% of total operating revenues.
Reservation change fees as a percentage of total operating revenues have declined, while the other
categories improved over the prior year. Total operating expenses in 2021 were $147.3 billion, of which
fuel costs accounted for $23.0 billion, or 15.6% of total expenses, and labor costs accounted for $52.6
billion, or 35.7%. In 2020, the operating expense share for fuel was 9.8%, and labor was 39.7%.
Annual Net Income 2017-2021, Systemwide U.S. Scheduled Passenger Airlines
Billions of Dollars ($)
Source: Bureau of Transportation Statistics
4

Passenger Activity
Since its emergence as a global pandemic in February of 2020, COVID-19 has been an unprecedented
shock to the airline and travel industries. As vaccines were made available to all willing to be vaccinated
and domestic travel restrictions were lifted, pent-up demand for travel brought back strong passenger
numbers especially at domestic destination airports such as RNO.
U.S. airlines carried 801.3 million systemwide (domestic and international) scheduled service passengers
for the fiscal year ended June 30, 2022, seasonally adjusted, according to the Bureau of Transportation
Statistics’ (BTS), up 86% from the previous year. The airlines carried 16.7% more passengers, seasonally
adjusted, in June of this year than June 2021.
U.S. airlines carried 717.9 million scheduled domestic service passengers, up 81.6% in in the year ended
June 30, 2022, from the previous year, seasonally adjusted, according to the BTS. International passenger
enplanements increased by 137.2% to 83.4 million in the year ended June 30, 2022.
Monthly Passengers on U.S. Scheduled Airlines (Domestic & International)
Seasonally Adjusted, June 2019-June 2022
Source: Bureau of Transportation Statistics
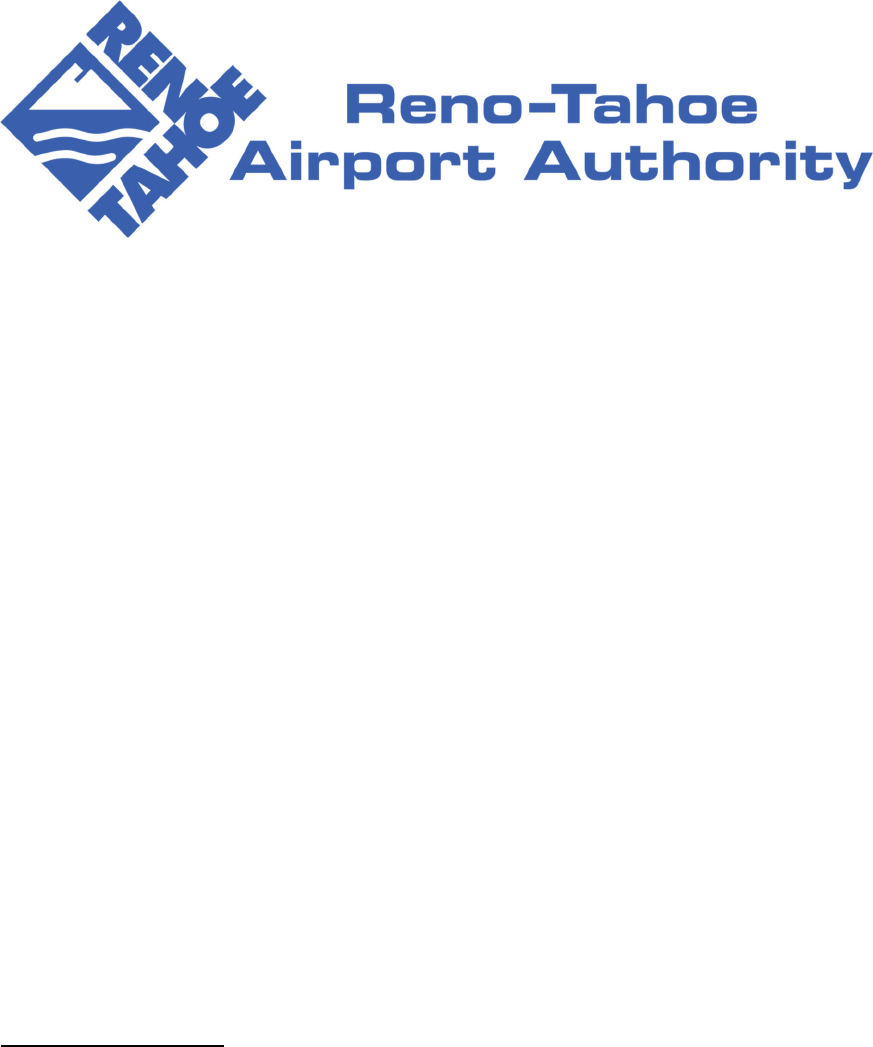
RNO Passengers
RNO served a total of 384,429 passengers in June 2022, a decrease of 3.4% from June 2021. The local
market was served by 11 airlines to 30 non-stop destinations. The total seat capacity decreased 10.5% and
flights decreased 14.8% when compared to June 2021. The average enplaned load factor was 85.7% in
June, an increase of 6.6% from the prior year. RNO served 4,155,405 total passengers during fiscal year
2021-22, a 68.0% increase when compared to fiscal year 2020-21.
On August 10, 2022, Spirit Airlines, RNO’s newest airline started service to Harry Reid International
Airport (LAS) in Las Vegas, Nevada.
5
RNO Enplaned Passengers
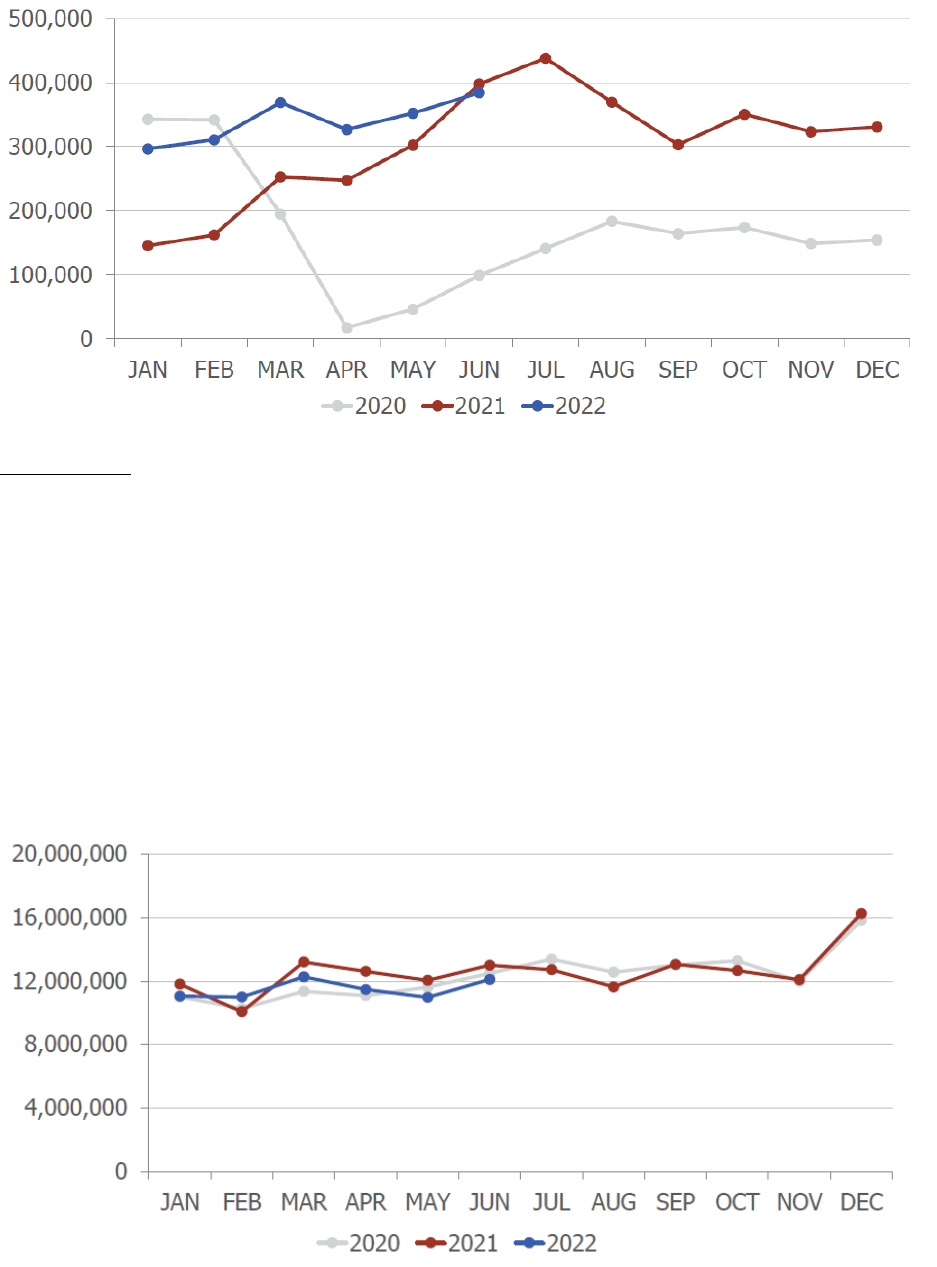
Cargo Airlines
Nevada has become a major west coast distribution hub due to its strategic location with the Reno/Sparks
area providing next-day ground service to almost every major U.S. city in the western United States. This
sector of the region’s economy includes the presence of major warehousing, pharmaceutical, e-commerce
and distribution facilities including such companies as Amazon, Walmart, Petco, Urban Outfitters, eBay,
Zulily and 1-800-Flowers.com. This sector of the economy, along with growth in industrial development
areas such as the Tahoe-Reno Industrial Center, has played a key role in cargo growth at RNO in recent
years.
RNO handled 12,105,721 pounds of air cargo in June 2022, a decrease of 6.9% when compared to June
2021. RNO handled 147,276,696 pounds of air cargo in Fiscal Year 2021-22, a decrease of 3.6% when
compared to Fiscal Year 2020-21.
RNO Total Cargo Volume in Pounds
6

MAJOR INITIATIVES
Strategic Initiatives
On June 14, 2018, the Board of Trustees approved a Strategic Plan for the fiscal years 2018-19 through
2022-23, as amended December 12, 2019. The Strategic Plan reflects extensive input from the Board,
RTAA employees, the public and interested stakeholders. The purpose and desired outcomes of the
updated plan include the following:
Shared Vision: A strategic vision for the organization that is shared by staff and the Board of
Trustees.
Strategic Direction: Core strategies that will help guide RTAA over the next 5 years.
Roadmap: A high-level plan to guide priority setting and serve as a helpful road map for staff
and the Board of Trustees.
Planning Structure: Long-term goals and performance measures that support the strategic
priorities and provide a planning structure for objectives setting and annual action plans.
Agility/Flexibility: A living plan that provides direction but is also flexible and broad enough to
incorporate constant change in the aviation industry.
The Strategic Plan consists of the following components, beginning with the broadest, long-term elements
to the more specific, short-range and tactical activities: (1) Vision Statement; (2) Mission Statement; (3)
Strategic Priorities and Support Strategies; (4) Long-Term Goals; (5) Key Performance Indicators; and
(6) Short-Term/Annual Objectives. The Vision Statement aims to provide modern, safe, convenient
facilities and deliver customer satisfaction that is a source of community pride and serves as a significant
contributor to regional economic health.
Our Mission Statement of We Move You! We Bring the World to Reno-Tahoe and Reno-Tahoe to the
World is directed by the following eight (8) adopted Strategic Priorities:
1. Passenger and Air Cargo Service: Enhance air service by retaining and increasing passenger and
air cargo service.
2. Safety and Security: Safety and security of all is our priority 24/7, 365.
3. General Aviation: Foster an atmosphere to encourage general aviation growth at both airports.
4. Customer Experience: Enhance services and provide a positive and convenient environment for
all.
5. People: With our employees being the current and future strength of our organization, our focus
is on development, succession planning and making RTAA the employer of choice.
6. Financial Diversification and Growth: Grow and diversify non-airline revenues at both Airports.
7. Facilities for the Future: Optimize infrastructure to address market demand.
8. Sustainability: Operate and manage with a holistic approach reflecting sustainability and
environmental stewardship.
7

On December 12, 2019, the Board approved an update to the Strategic Plan to incorporate input from the
Board and RTAA staff and adjust direction of Facilities for the Future from “substantively” to
“transformative” to accommodate the increasing demands and dynamics of the airport and customer
experience. A second adjustment in this update elevated Safety & Security from “sustain” to
“transformative” to address interests in upgrading public safety and security for all airport stakeholders.
Air Service Development
The success in expanding service by existing carriers reflects the combined efforts of RTAA and a
regional partnership with the Regional Air Service Corporation (RASC), comprised of convention and
visitor bureaus, hotels, casinos, ski resorts, and various business groups. In addition, the community
partnerships with RSCVA, EDAWN, Reno Sparks Chamber of Commerce, and associations have all
played an important role in the recent success. Staff is committed to building on this success by continuing
the following:
(a) Support of existing air service through awareness efforts, such as:
Airport website
Airline celebrations (inaugurals, anniversaries, etc.)
In-terminal assets (Lamar print and digital signage opportunities)
Local publications (i.e., Planners – North Tahoe, South Tahoe, RSCVA)
Advertorials in industry publications (i.e., anna.aero & Air Service One)
Community events (i.e., Chamber Alliance, etc.)
Community and partner presentations (i.e., RASC partner opportunities, RSCVA
convention and sales webinars, etc.)
(b) Continue to work with the RASC and the local community to bring new air service to RNO.
With the FAA policy restricting the use of RTAA funds in support of new air service, the RASC
and its partners have historically been able to provide the following:
Promotion through partner databases (locally and out of market)
Promotion through partner digital marketing efforts
Promotion through partner traditional marketing efforts
Air carrier marketing cooperative programs
Promotion through public relations programs
Air carrier risk mitigation efforts
RASC offers a marketing resource that no other community can match - a consortium that
spreads across multiple industries and counties to promote air service and the region.
(c) Host airline representatives to the Reno-Tahoe region as guests to highlight the area by private
invitations, Familiarization Tours promoting leisure and business, special event attendance, and
more.
(d) Continue on-going efforts to attract new, as well as expand and maintain existing air service
through headquarter meetings, industry conferences, and periodic check-in calls.
(e) Continue funding for an additional Customs and Border Protection (CBP) officer to reduce
processing times to enter the United States by international passengers. The additional CBP
officer began in July 2018.
8

(f) In accordance with the FAA's Policy and Procedures Concerning the Use of Airport Revenue and
Board adopted policy, RTAA revenue may provide the following financial incentives:
1. Waiver or reduction of airport fee and charges, and
2. Funding for acceptable promotional costs, where the purpose is to encourage an air carrier
to bring and/or increase air service at the airport.
The FAA allows promotional incentives to air carriers for new service to (a) increase travel using
the airport and/or (b) promote competition at the airport.
Land and Facilities Development
As an integral element to all strategic priorities, RTAA must not only support but also proactively respond
to market demands. Infrastructure needs outlined in the RNO Master Plan provides a proactive response
to the projected growth of passenger traffic at RNO by nearly 60% from 2017 to 2036, which is on top of
a 10% increase from 2016.
The strategic approach to create facilities for the future is envisioned as follows:
Relieve congestion in RNO public parking and rental car facilities. RNO’s growth over the last
five years has resulted in congestion in the public parking facilities requiring RTAA to implement
overflow procedures more frequently during peak periods. Additionally, the Short-Term Parking area
on the first floor of the garage fills to capacity during peak periods multiple times per week due to
constraints caused by sharing the space with the rental car companies. Moreover, the rental car
companies have outgrown their operations on the first floor of the garage. Together, the rental car
companies hired Conrac Solutions, LLC to design, build, finance, own and operate a new Consolidated
Rental Car Facility (ConRAC) to accommodate their need for additional space. A Ground Transportation
Center (GTC) component will also be incorporated into the project at the request of the rental car
companies, creating a centralized transportation hub for the airport. This facility will free up
approximately 700 parking spaces in the garage and current Quick Turn Around (QTA) areas.
Additionally, the rental car companies will move their current ticket counter operations out of baggage
claim and into the new customer service building located within the ConRAC/GTC, freeing up space that
can be utilized by airlines, airline support, or other underserved uses.
Redevelop RNO terminal concourses which are aging and undersized. With the existing concourses
being 40 years old, RTAA needs to replace the terminal concourses with new and larger concourses
to address existing constraints, such as limited space for new amenities and concessions, and allow for
future growth and expansion for both domestic and international travel. A planning study to identify the
preferred alternative for redevelopment concludes in 2022, and design is anticipated to begin in 2023.
The preferred alternative is the 28-Gate New Build Alternative and involves the full replacement of
existing Concourses B & C with larger concourses, the partial replacement of the Connector Concourse,
new and replacement aircraft apron, a new central utility plant to be located outside the main terminal
building footprint, and adjustments to existing Taxiway Alpha to provide room to expand the concourses
east.
9

The primary improvements are described below in greater detail:
Facility/Service PrimaryRecommendedImprovements
ConcourseDimensions
Increaseoverallsquarefootagefrom155,000SFto250,000SFand
concoursewidthfrom74’to110’.
Passenger&Employee
Experience
Incorporateexperienceenhancementsincludinghigherceilings,
increasednaturallight&mountainviews,outdoorspaces,intuitive
wayfinding,minimalincreasestowalki ngdistances,andexceed
requiredADAstandards.
BuildingSystems
Constructseparatecentralutilityplant,installnewmaindistribution
framefacilityandnewcentralizedmechanical&electricalsystems.
ClimateResiliency
Installcriticalbuildingsystemsabovefloodconcernareas,incorporate
intodesignfeaturesfocusedonenergyefficiency, greenhousegas
emissionreduction,waterconservation,wastemanagement,water
quality,andindoorairquality.
AircraftGates/Parking
Positions
Replaceexisting23gateswith28newgatesofvaryingsizes,capableof
supportingsixteen(16)737Max‐10aircraftandtwelve(12)ERJaircraft
atsametime.
Allaircraftgatestoincludepassengerboardingbridges(PBB).Eleven
(11)oftheexistingPBBcanbereusedforthenewconcourses.The
remainingtwelve(12)arepasttheendofusefullifeandwillrequirefull
replacement.
Atotalofseventeen(17)newPBBwillneedtobe
acquired.
PassengerHoldrooms
Replaceexisting23holdrooms(1,450SFaverage)with28new
holdroomsofvaryingsizes(16holdroomsat2,800SFeachand12
holdroomsat1,500SFeach).
Concessions
Replaceexisting25,000SFofretail,restaurant,gamingspacewith
50,000SFofnewspaceintheconcourses.
FirstFloorOperations
(Concessions,Airport)
Replaceexisting65,000SFwith85,000SFnewspace,incorporate50’
drive‐thrutunnelswideandtallenoughforexistinggroundvehicle
fleet,addcentraldistributioncenterfordeliveryandstaging.
Anadditional40,000SFcoveredspacewillalsobeavailableforfuture
build‐outifneeded.Untilthen,thatspacecanbeusedforstorage
and/orgroundvehicleparking.
AircraftNon‐Movement
andMovementAreas
Widendistancebetweennewconcoursestoallowforcreationofadual
taxilaneinthecentral alley,expandapronsouthtoreplacesouth
remainovernight(RON)spots,relocatenorthRONsandinternational
parkingpositions,andreconfigureTaxiwayAtoallowforeastern
expansionofconcourses.
10
Modernize the RNO Terminal Building to accommodate future technologies and enhance
customer experience and wayfinding. The terminal building consists of the functional areas in the
non-sterile zone, including the ticketing hall, main lobby, security-screening checkpoint (SSCP)
and baggage claim areas. The facility requirements analysis in the RNO Master Plan shows these
areas are sufficient in size through the projected 2036 planning period. However, RNO currently
experiences congestion, queuing, and wayfinding issues. This effort will focus on the following areas:
Ticketing Hall – Expand circulation by relocating the existing entry outside of the existing
terminal building envelope into the curbside public space to improve queuing and circulation,
build new restrooms within the ticket hall area, incorporate digital signage and common use
equipment, design improvements to make the experience in the Ticketing Hall more welcoming
and enjoyable including more natural light, higher ceilings, and art.
Intuitive Wayfinding – The basic layout at RNO allows for intuitive passenger wayfinding.
However, the current organization of concessions, art, gaming, and other amenities has relied
heavily on signs to communicate wayfinding. The execution of this signage diminishes the
intuitive nature of the airport layout. RTAA will focus on enhancing clarity by incorporating
intuitive wayfinding in future improvements projects.
Modify the RNO Airfield to FAA Compliance. The runway and taxiway system is in good condition
and meets FAA standards, except for some non-standard geometry that should be addressed as new
airfield projects are implemented. The following are identified airfield improvements:
Runway 17R CAT II Approach: Site the location of an additional Runway Visual Range (RVR)
on Runway 17R to enhance instrument approach capabilities.
Deicing Aprons: Examine dedicated deicing or anti-icing areas at ends of Runways 17R/L and
35L/R to help facilitate operations during winter storms. A north deicing pad could be constructed
after completion of the Concourse Redevelopment efforts, while a south deicing pad could be
constructed as part of future air cargo development.
Address taxiway hot spots and intersections: The FAA has designated three areas on the airfield
as being areas of high potential for incursion and improvements to these areas need to be evaluated
to enhance safety. The Juliet and Lima hotspots were successfully addressed during the Taxiway
Charlie Reconstruction project. The 17L/35R south end hotspot was initially recommended to be
addressed by correcting non-standard taxiway geometry at the south end of Taxiway Alpha. That
mitigation effort was not successful. As a result, additional analysis focused on signage and
marking adjustments is underway.
Develop airfield geometry improvements to address non-standard taxiway geometry and
intersections that do not comply with FAA taxiway design guidance.
Consider moving aircraft hold short positions to 294 feet from runway centerlines. RTAA will
coordinate with FAA Airport District Office to clarify the need for compliance with new
standards.
Run-Up Aprons: Evaluate areas to locate pavement where propeller aircraft can perform system
checks prior to departure. Construction of a run-up area at the north end of Taxiway Charlie has
been designed. Construction, pending bids and funding, is anticipated for 2023.
11

FINANCIAL INFORMATION
While RTAA is a quasi-governmental entity, the generally accepted accounting principles applicable to
an enterprise fund governmental entity apply. RTAA’s financial statements are prepared on an accrual
basis. Revenues are recognized when earned, not when received. Expenses are recognized when incurred,
not when paid. Financial policies are set to conform to generally accepted accounting principles and the
accrual basis of accounting. There were no unusual financial policies or one-time activities during the
current period.
RTAA has several funds that accumulate money for specific and discretionary purposes. These are not
the governmental purpose type funds usually seen in governmental accounting, but debt related accounts.
The RTAA’s revenue bond resolutions establish the funds and their payment priority. These funds are
common in the airport industry's revenue bond resolutions.
The revenue bond resolutions are the RTAA's contract with the purchasers of the revenue bonds. This
contract specifies how RTAA will manage its money so that it will have sufficient funds to operate the
Airport system, and to pay the interest and principal due.
RTAA prepares, approves, and revises its budget pursuant to Nevada's Local Government Budget and
Finance Act, airline agreements, and the RTAA’s revenue bond resolutions. The table below outlines the
statutory requirements:
Statutory Date Calendar Date Action
April 15
th
April 15, 2022 Tentative budget filed with the
Nevada Department of Taxation
Not more than 14 nor less than 7
days before the date set for the
hearing
May 10, 2022 Notice of Budget Public Hearing
published
Not sooner than the third
Monday in May and not later
than the last day in May
May 19, 2022 Hold Public Hearing
On or Before June 1s
t
May 19, 2022 Adopt Budget.
Pursuant to airline agreements, airlines that have signed agreements with RTAA must also review the
budget. Adoption of a resolution by the RTAA’s Board of Trustees is required for any subsequent changes
to the budget and the amendment submitted to the Nevada Department of Taxation for approval.
INTERNAL CONTROLS
The RTAA’s management is responsible for establishing and maintaining an internal control structure
designed to ensure that the assets are protected from loss, theft or misuse, and to ensure that adequate
accounting data are compiled to allow for the preparation of financial statements in conformity with
generally accepted accounting principles. The internal control structure is designed to provide reasonable,
but not absolute, assurance that these objectives are met. The concept of reasonable assurance recognizes
that: (1) the cost of a control should not exceed the benefits likely to be derived; and (2) the valuation of
costs and benefits requires estimates and judgments by management.
12

REPORTI
NG ACHIEVEMENT
The Government Finance Officers Association (“GFOA”) of the United States and Canada awarded a
Certificate of Achievement for Excellence in Financial Reporting to RTAA for its Annual Comprehensive
Financial Report for the fiscal year ended June 30, 2021. This was the 35th consecutive year that RTAA
has achieved this prestigious award. In order to be awarded a Certificate of Achievement, the Annual
Comprehensive Financial Report must be easily readable, efficiently organized, and conform to the
program standards. This report must satisfy both generally accepted accounting principles and applicable
legal requirements. A Certificate of Achievement is valid for a period of one year only. RTAA believes
this current report continues to meet the Certificate of Achievement Program’s requirements and will
submit this report to the GFOA to determine its eligibility for another certificate.
INDEPENDENT AUDIT
Nevada Revised Statutes 354.624 requires that RTAA have its financial statements audited each year by
an Independent Certified Public Accountant. In addition, the receipt of Federal funds and Passenger
Facility Charges, to assist in funding capital improvement projects and security-related costs, requires the
audit meet federal audit standards referred to collectively as the "Single Audit Act". The reports of the
RTAA’s auditors, Crowe LLP, are included herein.
Respectfully submitted,
Daren A. Griffin, A.A.E.
President/CEO
13

RENO-TAHOE AIRPORT AUTHORITY
JUNE 30, 2022
Board of Trustees Position Term
Expires
Represents
Shaun Carey Chair June 2023 City of Sparks
Adam Kramer Vice-Chair June 2025 Washoe County
Jenifer Rose Treasurer June 2023 City of Reno
Richard Jay Secretary June 2025 City of Reno
Jessica Sferrazza Trustee June 2023 City of Reno
Jennifer Cunningham Trustee June 2025 City of Reno
Art Sperber Trustee June 2025 City of Sparks
Carol Chaplin Trustee June 2025 Reno-Sparks Convention &
Visitors Authorit
y
Lisa Gianoli Trustee June 2023 Washoe Count
y
More information on the Board of Trustees can be viewed on the RTAA website at
www.renoairport.com or by clicking RTAA Board of Trustees.
Staff Title
Daren Griffin, A.A.E. President/CEO
Cris Jenson Chief Operations & Public Safety Officer
Gary Probert Chief Infrastructure & Planning Officer
Randall Carlton Chief Finance & Administration Officer
Tina Iftiger Chief Commercial Officer
Brian Kulpin Chief Marketing & Public Affairs Officer
Larry Harvey Chief People, Culture & Equity Officer
14

Scott Gordon
Manager of Reno-Stead
Airport
328-6573
Gary Probert
Chief Infrastructure and
Planning Officer
Randall Carlton
Chief Finance and
Administration Officer
Marty Mueller
Manager of IT Security
Alex Kovacs
Director of Finance
Tracy Caster
Manager of Accounting
Larry Harvey
Chief People, Culture and
Equity Officer
Chris Cobb
Manager of Engineering &
Construction
Art Rempp
Director of IT/ Chief Information
Officer
David Pittman
Director of Facilites &
Maintenance
George Lanyon
Facilities Superintendent
Dave Derie
Airfield Superintendent
Aurora Ritter
Manager of Airport Economic
Development
Cris Jensen
Chief Operations and Public
Safety Officer
Dale Carnes
Chief of Airport Rescue
Firefighters
Ricardo Duarte
Chief of Airport Police
Brandon Mikoleit
Manager of Landside
Operations
Carrie Guedea
Manager of Airside
Operations
Brad Erger
Manager of Properties
Reno-Tahoe Airport Authority Board of Trustees
Chief Legal Officer
Daren Griffin
President/CEO
Brian Kulpin
Chief Marketing and Public
Affairs Officer
Holly Luna
Manager of Purchasing &
Materials Management
Tina Iftiger
Chief Commercial Officer
Hasaan Azam
Manager of Ai
r Service & Cargo
B
u
si
nes
s
De
vel
o
p
m
en
t
Lissa Butterfield
Manager of Planning &
Environmental Serv
ices
Ben Carpenter
Manager of Airport
Communications
Shane Imsdahl
Manager of IT
Trish Tucker
Manager of Air Service &
Co
mmunity Engagement
Stacey Sunday
Director of Corporate
Communication
s
Janelle Conine
Customer Service Supervisor
Julie Sternberg
Manager of Labor Relations
and Benefits
Tracy Moore
Airport Emergerncy
Manager
Romona Agena
Manager of Airport
Security
Vacant
Director of Operations
15

Government Finance Officers Association
Certificate of
Achievement
for Excellence
in Financial
Reporting
Presented to
Reno-Tahoe Airport Authority
Nevada
For its Annual Comprehensive
Financial Report
For the Fiscal Year Ended
June 30, 2021
Executive Director/CEO
16

Financial Section

17
INDEPENDENT AUDITOR’S REPORT
To the Board of Trustees
Reno-Tahoe Airport Authority
Reno, Nevada
Report on the Audit of the Financial Statements
Opinion
We have audited the financial statements of the business-type activities of the Reno-Tahoe Airport Authority (the
“Authority” or “RTAA”), as of and for the year ended June 30, 2022, and the related notes to the financial
statements, which collectively comprise the Authority’s basic financial statements as listed in the table of
contents.
In our opinion, the accompanying financial statements referred to above present fairly, in all material respects,
the respective financial position of the business-type activities of the Authority, as of June 30, 2022, and the
respective changes in financial position and, where applicable, cash flows thereof for the year then ended in
accordance with accounting principles generally accepted in the United States of America.
Basis for Opinions
We conducted our audit in accordance with auditing standards generally accepted in the United States of America
(GAAS) and the standards applicable to financial audits contained in Government Auditing Standards
(Government Auditing Standards), issued by the Comptroller General of the United States. Our responsibilities
under those standards are further described in the Auditor's Responsibilities for the Audit of the Financial
Statements section of our report. We are required to be independent of the Authority, and to meet our other
ethical responsibilities, in accordance with the relevant ethical requirements relating to our audits. We believe
that the audit evidence we have obtained is sufficient and appropriate to provide a basis for our audit opinions.
Responsibilities of Management for the Financial Statements
Management is responsible for the preparation and fair presentation of the financial statements in accordance
with accounting principles generally accepted in the United States of America, and for the design,
implementation, and maintenance of internal control relevant to the preparation and fair presentation of financial
statements that are free from material misstatement, whether due to fraud or error.
In preparing the financial statements, management is required to evaluate whether there are conditions or events,
considered in the aggregate, that raise substantial doubt about the Authority’s ability to continue as a going
concern for twelve months beyond the financial statement date, including any currently known information that
may raise substantial doubt shortly thereafter.
Auditor’s Responsibilities for the Audit of the Financial Statements
Our objectives are to obtain reasonable assurance about whether the financial statements as a whole are free
from material misstatement, whether due to fraud or error, and to issue an auditor's report that includes our
opinions. Reasonable assurance is a high level of assurance but is not absolute assurance and therefore is not
a guarantee that an audit conducted in accordance with GAAS and Government Auditing Standards will always
detect a material misstatement when it exists. The risk of not detecting a material misstatement resulting from
fraud is higher than for one resulting from error, as fraud may involve collusion, forgery, intentional omissions,
misrepresentations, or the override of internal control. Misstatements are considered material if there is a
substantial likelihood that, individually or in the aggregate, they would influence the judgment made by a
reasonable user based on the financial statements.
18
In performing an audit in accordance with GAAS and Government Auditing Standards, we:
x Exercise professional judgment and maintain professional skepticism throughout the audit.
x Identify and assess the risks of material misstatement of the financial statements, whether due
to fraud or error, and design and perform audit procedures responsive to those risks. Such
procedures include examining, on a test basis, evidence regarding the amounts and
disclosures in the financial statements.
x Obtain an understanding of internal control relevant to the audit in order to design audit
procedures that are appropriate in the circumstances, but not for the purpose of expressing an
opinion on the effectiveness of the Authority’s internal control. Accordingly, no such opinion is
expressed.
x Evaluate the appropriateness of accounting policies used and the reasonableness of
significant accounting estimates made by management, as well as evaluate the overall
presentation of the financial statements.
x Conclude whether, in our judgment, there are conditions or events, considered in the
aggregate, that raise substantial doubt about the Authority’s ability to continue as a going
concern for a reasonable period of time.
We are required to communicate with those charged with governance regarding, among other matters, the
planned scope and timing of the audit, significant audit findings, and certain internal control-related matters that
we identified during the audit.
Required Supplementary Information
Accounting principles generally accepted in the United States of America require that the Management’s
Discussion and Analysis, the Schedule of RTAA’s Proportionate Share of the Net Pension Liability, the Schedule
of Pension Plan Contributions, and the Schedule of Changes in RTAA’s Total OPEB Liability and Related Ratios
as listed in the Table of Contents, be presented to supplement the basic financial statements. Such information,
although not a part of the basic financial statements, is required by the Governmental Accounting Standards
Board who considers it to be an essential part of the financial reporting for placing the financial statements in an
appropriate operational, economic or historical context. We have applied certain limited procedures to the
required supplementary information in accordance with auditing standards generally accepted in the United
States of America, which consisted of inquiries of management about the methods of preparing the information
and comparing the information for consistency with management’s responses to our inquiries, the basic financial
statements, and other knowledge we obtained during our audit of the basic financial statements. We do not
express an opinion or provide any assurance on the information because the limited procedures do not provide
us with sufficient evidence to express an opinion or provide any assurance.
Supplementary Information
Our audit was conducted for the purpose of forming an opinion on the financial statements that collectively
comprise the Authority’s basic financial statements. The Introductory Section, Statistical Section, the Schedule
of Revenues and Expenses, Comparison of Budget to Actual, the Schedule of Debt Service Requirements on
Bonds and Notes, and the Schedule of Expenditures of Federal Awards (SEFA) as required by Title 2 U.S. Code
of Federal Regulations (CFR) Part 200, Uniform Administrative Requirements, Cost Principles, and Audit
Requirements for Federal Awards, as listed in the Table of Contents, are presented for purposes of additional
analysis and are not a required part of the basic financial statements.
The Schedule of Revenues and Expenses, Comparison of Budget to Actual, Schedule of Debt Service
Requirements on Bonds and Notes, and SEFA the responsibility of management and were derived from and
relates directly to the underlying accounting and other records used to prepare the basic financial statements.
Such information (except for the cumulative thru June 30, 2021 amounts on the SEFA) has been subjected to
the auditing procedures applied in the audit of the basic financial statements and certain additional procedures,
including comparing and reconciling such information directly to the underlying accounting and other records
used to prepare the basic financial statements or to the basic financial statements themselves, and other
additional procedures in accordance with auditing standards generally accepted in the United States of America.
In our opinion, the Schedule of Revenues and Expenses, Comparison of Budget to Actual, Schedule of Debt
Service Requirements on Bonds and Notes, and SEFA (except for the Cumulative thru June 30, 2022 amounts)
are fairly stated, in all material respects, in relation to the basic financial statements as a whole.
The Introductory Section, Statistical Section, and Cumulative thru June 30, 2022 amounts on the SEFA have not
been subjected to the auditing procedures applied in the audit of the basic financial statements and accordingly,
we do not express an opinion or provide any assurance on them.

19
Other Reporting Required by Government Auditing Standards
In accordance with Government Auditing Standards, we have also issued our report dated November 30, 2022
on our consideration of the Authority’s internal control over ¿nancial reporting and on our tests of its compliance
with certain provisions of laws, regulations, contracts, and grant agreements and other matters. The purpose of
that report is solely to describe the scope of our testing of internal control over ¿nancial reporting and compliance
and the results of that testing, and not to provide an opinion on the eႇectiveness of the Authority’s internal control
over ¿nancial reporting or on compliance. That report is an integral part of an audit performed in accordance with
Government Auditing Standards in considering the Authority’s internal control over ¿nancial reporting and
compliance.
Crowe LLP
Indianapolis, Indiana
November 30, 2022
MANAGEMENT’S DISCUSSION
AND ANALYSIS
RENO-TAHOE AIRPORT AUTHORITY
MANAGEMENT’S DISCUSSION AND ANALYSIS
JUNE 30, 2022
This Management Discussion and Analysis (MD&A) of Reno-Tahoe Airport Authority (“RTAA” or “the
Authority”) provides an introduction and overview of the major activities affecting the operations and the
financial performance of RTAA for the fiscal year (FY) ended June 30, 2022. The information contained
in this MD&A should be considered in conjunction with the information contained in RTAA’s financial
statements.
FINANCIAL HIGHLIGHTS
The Authority’s assets and deferred outflows exceeded liabilities and deferred inflows, or Net
Position, by $459.125 million at June 30, 2022.
The number of enplaned passengers at the Reno-Tahoe International Airport (RNO) increased 69%
to 2.080 million and landing fees increased 18% to $10.585 million from the prior year.
At June 30, 2022 the Authority had no debt. As of June 30, 2021, RTAA had $12.290 million of
outstanding airport revenue bonds related to the construction of the public parking garage. On
December 9, 2021, the Board of Trustees approved the prepayment of the 2015 Bonds. RTAA
received federal stimulus funds as reimbursement of the debt payoff amount in January 2022.
RTAA’s operating revenues increased $14.402 million (33%) from the prior fiscal year.
The Authority recognized $41.522 million in lease receivables, $41.265 million in deferred inflow
of resources, and $592 thousand in lease interest income as on June 30, 2022, and for the year then
ended, related to the implementation of Governmental Accounting Standards Board (GASB)
Statement No. 87, Leases.
Federal stimulus grant revenue increased 59% over prior year to $14.483 million for the year ended
June 30, 2022. Funding sources include award amounts from the Coronavirus Aid, Relief and
Economic Security (CARES) Act, American Rescue Plan Act (ARPA), and Coronavirus Response
and Relief Supplemental Appropriations (CRRSA) Act funding.
OVERVIEW OF THE FINANCIAL STATEMENTS
RTAA’s financial statements are prepared on the accrual basis in accordance with accounting principles
generally accepted in the United States of America (GAAP) promulgated by GASB. RTAA has a single
enterprise fund, and as such separate government-wide financial statements are not prepared. Revenues are
recognized when earned, not when received, and expenses are recognized when incurred, not when paid.
Capital assets are capitalized and depreciated over their useful lives. See the notes to RTAA’s financial
statements for a summary of the significant accounting policies.
This discussion and analysis is intended to serve as an introduction to RTAA’s basic financial statements.
The basic financial statements consist of three components: 1) fund financial statements, 2) notes to the
financial statements, and 3) required supplementary information other than the MD&A.
Fund financial statements – RTAA maintains its accounting records in a single enterprise fund. An
enterprise fund is a type of proprietary fund used to report business-type activities.
The statement of net position presents information on RTAA’s assets, deferred outflows of resources,
liabilities, and deferred inflows of resources, with the difference shown as net position.
20

MANAGEMENT’S DISCUSSION AND ANALYSIS
The statement of revenues, expenses and change in net position presents information on how RTAA’s net
position changed during the fiscal year. All changes in net position are reported as soon as the underlying
events giving rise to the changes occur, regardless of the timing of the related cash flows.
The statement of cash flows presents RTAA’s cash flow (sources and uses) related to operating activities,
non-capital financing activities, capital financing activities, and investing activities during the year.
Notes to Financial Statements - The notes to the basic financial statements provide additional information
that is essential to a full understanding of the data provided in the fund financial statements.
Required Supplementary Information other than MD&A - In addition to the basic financial statements
and accompanying notes, this report also presents certain required supplementary information related to
RTAA’s pension plan as required by the GASB to supplement information found in the notes to the basic
financial statements.
FINANCIAL ANALYSIS
Statement of Net Position
Net position may serve over time as a useful indicator of an organization’s financial position. The
Authority’s assets and deferred outflows exceeded liabilities and deferred inflows by $459.125 million at
June 30, 2022.
The following summarizes RTAA’s financial position as of June 30, 2022, and 2021:
2022 2021
$ Change % Change
Assets
Current assets 96,078,982$ 75,560,311$ 20,518,671$ 27%
Current assets-restricted 29,978,053 26,517,614 3,460,439 13%
Capital assets, net of depreciation 388,632,933 375,980,175 12,652,758 3%
Lease receivable, long term 33,195,211 - 33,195,211 100%
Other assets 1,383,599 1,383,599 - 0%
Total assets 549,268,778 479,441,699 69,827,079 15%
Deferred outflows of resources 14,125,539 5,771,560 8,353,979$ 145%
Liabilitie s
Current liabilities 11,951,622 8,551,985 3,399,637 40%
Payable from restricted assets 101,202 3,649,496 (3,548,294) -97%
Non-current liabilities 29,239,410 52,996,819 (23,757,409) -45%
Total liabilities 41,292,234 65,198,300 (23,906,066)$ -37%
Deferred Inflow of Resources 62,977,306 2,977,221 60,000,085$ 2015%
Net Position
Net Investment in Capital Assets 388,632,933 361,855,033 26,777,900 7%
Restricted Net Position 28,495,282 25,980,476 2,514,806 10%
Unrestricted Net Position 41,996,562 29,202,230 12,794,332 44%
Total Net Position 459,124,777$ 417,037,739$ 42,087,038$ 10%
21

MANAGEMENT’S DISCUSSION AND ANALYSIS
Total assets of $549.269 million reflect an increase of $69.827 million or 15% as compared to 2021. A
significant portion of the increase relates to the creation of a lease receivable balance from GASB 87 and
capital asset activity.
Unrestricted current assets increased by $20.519 million or 27%. This is mainly due to the increase of cash
and investments of $12.752 million and the recognition of $8.242 million in lease receivables as a result of
the implementation of GASB Statement No. 87. These increases are partially offset by reductions in
accounts receivable of $196 thousand and other current assets of $251 thousand.
Restricted current assets increased by $3.460 million or 13%, due to higher balances in restricted
investments of $4.645 million or 20%. This increase is partially offset by the $2.281 million or 99%
decrease in cash and cash equivalents.
Capital assets of $388.633 million increased by $12.653 million or 3% as compared to the prior year. The
increase is primarily due to $28.754 or 4% increase in new capital assets and $8.838 million or 22% increase
in construction in progress. These increases are partially offset by the $24.939 million or 4% increase in
accumulated depreciation and amortization.
Other assets are comprised of regional road impact credits with the Regional Transportation Commission
(RTC) of Washoe County valued at $1.384 million. The regional road impact fee is a one-time assessment
to pay for new roads or improvements to existing roads necessary to serve traffic from a new development.
The fee is paid at the time a building permit is issued. RTAA owned credits are currently set to expire on
June 26, 2033 and can be used as an offset to the road impact fee as needed or sold to others.
Total liabilities of $41.292 million decreased $23.906 million or 37% for the fiscal year ended June 30,
2022. The significant factors for the decline are the retirement of $12.290 million in outstanding revenue
bonds, and a reduction in net pension liability of $14.017 million.
The largest portion (85%) of RTAA’s total net position represents the investment in capital assets, less the
related indebtedness outstanding used to acquire those capital assets. On June 30, 2022, RTAA had
$388.633 million of net investment in capital assets, an increase of $26.778 million or 7% from the prior
fiscal year. RTAA uses these capital assets to provide services to airlines, passengers, visitors, and service
providers at the Airport. Consequently, these assets are not available for future spending.
An additional portion (6%) of RTAA’s net position represents restricted resources of $28.495 million, a
$2.515 million or 10% increase from FY 2021. The restricted net position is not available for spending due
to the following commitments:
As of June 30, 2022, the remaining unrestricted net position of $41.997 million, or 9% of total net position
represents liquidity available to meet any of RTAA’s on-going obligations.
2022 2021
Revenue bond operations and maintenance 7,532,989 7,724,482
Renewal and replacement 770,498 786,759
Passenger facility charge projects 20,160,846 15,516,627
Debt service - 1,909,953
Other reserve purposes 30,949 42,655
28,495,282 25,980,476
22

MANAGEMENT’S DISCUSSION AND ANALYSIS
The following presents RTAA’s deferred outflows and inflows as of June 30, 2022, and 2021:
A deferred outflow of resources is the recognition of “consumed” net assets that is applicable to a future
reporting period. This recognition includes: (1) pension contributions of $2.819 million to the Public
Employees Retirement System (PERS) of the State of Nevada after the measurement date of June 30, 2021;
(2) the pension value changes in actuarial assumptions of $8.156 million; differences identified on the
Schedule of Employer Allocations, Schedule of Pension Amounts by Employer and Related Notes by
PERS; (3) pension differences between expected and actual pension experience of $2.721 million; and (5)
contributions related to Other Postemployment Benefits (OPEB) liability of $127 thousand.
Conversely a deferred inflow of resources is the recognition of “acquired” resources of net assets applicable
to a future reporting period. This recognition includes: (1) pension difference between actual and projected
earnings on plan investments of $20.044 million (2) the differences in economic and demographic factors
used in the projected actuarial assumptions and actual experiences of $173 thousand; (3) the difference
between the actual and proportionate share of contribution of $1.580 million; and (4) the value of lease
receivables of $41.180 million.
The deferred outflows and inflows related to RTAA’s pension plan and OPEB are further explained in Note
9 - Pension Plan and Note 13 - Other Postemployment Benefits (OPEB) in the notes to the financial
statements. Deferred inflows related to leases are discussed in detail in Note 8 – Leases.
Statement of Changes in Net Position
During the current fiscal year, the Authority’s net position increased by approximately $42.087 million.
The following summarizes the changes in RTAA’s net position for June 30, 2022, and 2021:
2022 2021 $ Change % Change
Deferred outflows of resources 14,125,539$ 5,771,560$ 8,353,979$ 145%
Deferred inflows of resources 62,977,306 2,977,221 60,000,085 2015%
2022 2021 $ Change % Change
Operating revenues 58,065,181$ 43,662,916$ 14,402,265$ 33%
Operating expenses 46,340,021 42,612,297 3,727,724 9%
Operating income before depreciation
and amortization 11,725,160 1,050,619 10,674,541 1016%
Depreciation and amortization expense 25,079,112 26,827,690 (1,748,578) -7%
Operating income/(loss) (13,353,952) (25,777,071) 12,423,119 48%
Non-operating revenues/(expenses) 27,754,958 16,386,414 11,368,544 69%
Income/(loss) before capital contributions 14,401,006 (9,390,657) 23,791,663 253%
Capital contributions 27,686,032 25,193,485 2,492,547 10%
Change in net position 42,087,038$ 15,802,828$ 22,043,085$ 139%
23

MANAGEMENT’S DISCUSSION AND ANALYSIS
Significant Changes in Net Position for Fiscal Year 2022 versus 2021
Total operating revenues increased by $14.402 million or 33% and total operating expenses increased by
$3.728 million or 9%. A review of these two categories is detailed below.
Depreciation and amortization expense of $25.079 million was $1.749 million or 7% lower than the prior
year due the full depreciation of certain assets in the prior year.
Non-operating income of $27.755 million increased by $11.369 million or 69% over prior year. This is
primarily due to the increase of federal stimulus grant revenues (CARES, ARPA, and CRRSA).
Capital contributions of $27.686 million, primarily comprised of grants from the Federal Aviation
Administration (FAA), increased by $2.493 million or 10% in FY 2022 as compared to FY 2021. The grant
contributions include reimbursements for runways, taxiways, and apron rehabilitation.
Operating Revenues
Revenues are defined as “operating” for those revenue categories used to finance RTAA’s operation and
maintenance of RNO and Reno-Stead Airport (RTS). Included are landing fees, concession revenues,
parking, and other charges. The table below represents operating revenues by source for the fiscal years
ended June 30, 2022, and 2021:
Significant Changes in Operating Revenues for Fiscal Year 2022 versus 2021
A key metric associated with RTAA’s operating revenues is the number of enplaned passengers at RNO.
The COVID-19 pandemic caused unprecedented disruption of the passenger airline traffic worldwide.
Governments issued travel restrictions, mask mandates, and other restrictive measures in an effort to
manage the pandemic. The number of enplaned passengers recorded at RNO declined significantly during
FY 2021, ending the year with 1.232 million enplanements. With the rollout of vaccines, lifting travel
restrictions, and the transition back to business as usual in FY 2022, passenger traffic has increased to pre-
pandemic levels in some months, ending the year with 2.080 million enplanements.
Landing fee revenues of $10.585 million increased $1.636 million or 18% from the prior year mainly due
to the recovery of airline activity at RNO. Cargo airlines benefited from the boom of ecommerce during the
pandemic and recorded higher landed weights than pre-pandemic. Landing fees represent approximately
18% of RTAA’s total operating revenues.
2022 2021
$ Change % Change
Landing fees 10,584,517$ 8,948,847$ 1,635,670$ 18%
Concession revenue 15,257,011 9,628,195 5,628,816 58%
Parking and ground transportation 14,004,587 7,361,177 6,643,410 90%
Rentals 15,073,833 15,715,644 (641,811) -4%
Reimbursements for services 3,000,059 1,823,280 1,176,779 65%
Other revenue 145,174 185,773 (40,599) -22%
Total operating revenue 58,065,181$ 43,662,916$ 14,402,265$ 33%
24

MANAGEMENT’S DISCUSSION AND ANALYSIS
Concession revenues of $15.257 million were generated from auto rental, gaming, food and beverage,
merchandising, advertising, and other concessions. They represent 26% of the total operating revenues and
58% higher than FY 2021. Concession revenues recorded in FY 2021 were $1.674 million, which was 15%
below FY 20 results due to the impacts of the COVID 19 pandemic. In August 2021 the Board authorized
the President/CEO to provide temporary financial relief to in-terminal concessionaires: The Paradies Shops,
LLC, SSP America, Inc., MAG US Lounge Management, Traveler Gifts, LLC, and Tahoe Douglas Visitors
Authority through the waiver of monthly minimum annual guarantee (MAG) payments, rents, or reduction
of concession fees through June 30, 2022.
Parking and Ground Transportation revenues of $14.005 million accounted for 23% of total operating
revenues. Parking revenues increased by $6.643 million or 90% above the prior year results. Current
parking rates are $1.00 for the first 30 minutes, $2.00 for the first hour, and an additional $1.00 per hour,
with maximum amounts of $24.00 per day for short-term, $14.00 per day for the long-term garage, and
$10.00 per day for long-term surface lot parking.
Rental revenues of $15.074 million decreased $642 thousand or 4%. The decrease is the result of the year
end airline fee settlement calculation with revenues higher than budget and expenses lower than the budget
estimate.
Reimbursements for services and the other revenue category generated $3.145 million or 5% of total
operating revenues. Reimbursements for services increased $1.177 million or 65% from fiscal year 2021.
Revenues in this category include airline charges to use RTAA’s baggage handling system (BHS). The
BHS fee reflects 100% cost recovery of the direct operating and maintenance costs of the system less any
reimbursement from the Transportation Security Administration (TSA) for direct costs associated with their
screening equipment. Other revenues of $145 thousand include miscellaneous revenues, such as late fees
collected by RTAA, and rebates received.
Operating Expenses
The RTAA’s total operating expenses totaled $46.340 million in FY 2022, an increase of $3.728 million or
9% above the prior year results. The increase is primarily due to the increase of funding allocated to
operating activities after the budget reductions due to the COVID-19 pandemic, as well as contracted
services related to capital projects. Of the total operating expenses, 65% were costs associated with
employee wages and benefits of a workforce of 279 employees as of June 30, 2022. The following is a
summary of expenses (excluding depreciation and amortization) by source for the years ended June 30,
2022, and 2021:
2022 2021
$ Change % Change
Employee wages and benefits 30,348,607$ 30,923,994$ (575,387)$ -2%
Utilities and communications 3,156,581 2,454,099 702,482 29%
Purchase of services 7,405,170 4,887,352 2,517,818 52%
Materials and supplies 2,575,145 2,259,926 315,219 14%
Administrative expenses 2,854,518 2,086,926 767,592 37%
Total Operating Expenses 46,340,021$ 42,612,297$ 3,727,724$ 9%
25

MANAGEMENT’S DISCUSSION AND ANALYSIS
Significant Changes in Operating Expenses for Fiscal Year 2022 versus 2021
Employee salaries, wages, and benefits of $30.349 million decreased $575 thousand or 2% in fiscal year
2022. Personnel related expenses represent approximately 65% of total operating expenses. The following
table outlines the major expense categories within employee salaries, wages, and benefits for the years
ending June 30, 2022, and 2021:
2022 2021 $ Change % Change
Sala
r
ies $21,724,003 $19,400,633 $2,323,370 12%
Overtime, Standby, Holiday Worked 1,645,304 1,162,234 483,070 42%
Employee Benefits 6,979,281 10,361,127 (3,381,846) -33%
Total Employee Wages and Benefits
$30,923,994 $32,120,112 ($1,196,118) -2%
Employee salaries have increased by $2.323 million or 12% from FY 2021. This increase reflects a return
to pre-pandemic operation levels with filling existing open positions. Overtime also increased by $483
thousand. Employee benefits decreased approximately $3.382 million or 33% due largely to decreases of
RTAA’s share of the net pension liability based on the actual results of investments. The net pension
liability and related inflows and outflows of deferred revenue are based on actuarial assumptions at June
30, 2021. During FY 2021 actual results of earnings on investments was significantly larger than
expectations, resulting in a decrease of the net pension liability and RTAA’s related expense. These
expenses are further explained in Note 9 – Pension Plan and Note 11 – Other Post-Employment Benefits
(OPEB).
Utilities and communications expenses of $3.157 million increased $702 thousand or 29% from the prior
year and represents 7% of total operating expenses. This category includes electricity, natural gas, water,
sewer service, telephone, and other utility services.
Purchase of services expense includes professional and technical services and totaled $7.405 million, an
increase of $2.518 million or 52% from the prior year. The increase was primarily due to higher costs
associated with consultant services and contracted services related to capital projects and financial software
conversion and implementation. Purchase of services expense represents 52% of total operating expenses.
Expenses for materials and supplies totaled $2.575 million, an increase of $315 thousand or 14% from the
prior year. Materials and supplies represent 14% of total operating expenses.
The administrative expense category includes travel, training, air service development, insurance, and other
general expenses. In total, the category incurred $2.855 million in cost, an increase of approximately $768
thousand or 37% from the prior fiscal year. This increase reflects increased costs associated with training,
conference sponsorship, insurance premiums, and community outreach.
Non-Operating Revenues and Expenses
The category of non-operating revenues and expenses contains sources and uses of RTAA funding not
directly associated with supporting the operations of the airports or funding intended or restricted for
specific uses. Included in this group are the items following: interest income, Passenger Facility Charges
(PFCs), Customer Facility Charges (CFCs), jet fuel taxes, federal stimulus grants, and interest expense on
RTAA revenue bonds.
26

MANAGEMENT’S DISCUSSION AND ANALYSIS
The following is a summary of non-operating revenues and expenses for the years ended June 30, 2022,
and 2021:
Significant Changes in Non-Operating Revenues and Expenses for Fiscal Year 2022 versus 2021
Interest income consists of interest from leases under GASB 87 of $591 thousand and interest earned on
cash and investments of $655 thousand. Interest income from cash and investments decreased 35% and
loss on the value of investments increased 66% this past fiscal year. Interest rate changes impact RTAA’s
financial position in two ways: 1) revenues will change based on lower or higher interest rates and 2)
investment market values will change positively if rates decline and negatively if rates rise. The impact is
dependent on the overall maturity structure of the investment portfolio. Overall interest rates were low most
of the fiscal year, increasing slightly in the fourth quarter. Reduced rates during the year resulted in lower
investment revenue, due to the reinvestment of maturities at lower replacement yields.
Jet fuel tax revenues are derived from a one cent per gallon of fuel for jet or turbine aircraft sold, distributed,
or used. The tax is collected by Washoe County and remitted to RTAA as outlined in Nevada Revised
Statute (NRS) 365.170. These revenues are used by RTAA to support air service development objectives
and other discretionary expenses. The increase in revenues is due to higher volume of aircraft operations at
RNO.
Federal stimulus grant revenues of $14.483 million increased by $7.424 million in FY 2022. This includes
eligible cost reimbursement from the CARES, CRRSA, and ARPA Acts of $13.887 million. This funding
is permissible for any eligible use of airport revenues. CARES Act reimbursement in fiscal year 2022
included debt service, contracted services, salaries, and wages. RTAA also received funding for concession
rent relief through CRRSA and ARPA of $596 thousand.
Interest expense of approximately $400 thousand increased by $62 thousand or 15% above the previous
year. This increase reflects the additional expenses for prepaid interest due the early retirement of debt.
2022 2021
$ Change % Change
Interest income 1,246,627$ 886,650$ 359,977$ 29%
Gain (loss) on investment valuation (2,737,875) (935,537) (1,802,338) 66%
Passenger facility charge revenue 8,502,997 4,514,399 3,988,598 47%
Customer facility charge revenue 6,350,891 4,954,128 1,396,763 22%
Jet fuel tax revenue 294,018 203,765 90,253 31%
Gain (loss) on sale of capital assets 15,080 41,838 (26,758) -177%
Federal grant revenue 14,483,077 7,059,146 7,423,931 51%
Interest expense (399,857) (337,975) (61,882) 15%
Total Non-Operating revenues 27,754,958$ 16,386,414$ 11,368,544$ 69%
27

MANAGEMENT’S DISCUSSION AND ANALYSIS
CAPITAL ASSETS
RTAA’s investment in capital assets as of June 30, 2022, was $388.633 million, a net increase of $26.778
million or 7%. This increase is primarily due to the debt payoff during the year. Investments in capital
assets include land, construction in progress, improvements, buildings, equipment, and development rights.
The following presents RTAA’s capital assets for the years ended June 30, 2022, and 2021:
Major Capital Asset Events during Fiscal Year 2022
Federal grants funded over $27.686 million of capital projects in FY 2022. Projects included a runway
rehabilitation at RNO, Taxiway B & C design at RNO, RTS Parking Apron, and RTS Taxiway A.
Completed RNO terminal building projects include HVAC upgrades, jet bridge replacement, and a ticketing
hall study. Technology upgrade projects completed this year included financial system replacement and
security system upgrades.
RTAA continued its on-going pavement maintenance program with major projects in the airfield, landside
parking and various tenant properties adding to the value of capital assets. For additional information on
capital assets, see Notes to the Financial Statements, Note 5 – Capital Assets.
DEBT ADMINISTRATION
At June 30, 2022, RTAA had no outstanding debt. During FY 2022, the Authority paid off $12.290 million
in debt comprised of senior lien revenue bonds (Series 2015 Airport Refunding Bond). On September 30,
2015, the proceeds from the 2015 Bond were used to redeem the Airport Revenue Refunding Bonds, Series
2005 (the “Series 2005 Bonds”), which were outstanding as of July 1, 2015, in the amount of $20,940,000,
and the cost of issuance necessary to execute this transaction. The 2015 Bond reflects the remaining
outstanding debt from 1996 bonds issued to construct RTAA’s three story, 2,400 space parking garage, a
new roadway system to accommodate the parking garage, and a passenger skyway to connect the parking
garage to the terminal.
RTAA, unlike most local governments, has no debt limit or maximum debt per capita. RTAA does have a
rate maintenance covenant in its revenue bond resolutions requiring that net pledged revenues equal or
exceed 125% of the bond debt service. For additional information on bonds, see Notes to the Financial
Statements, Note 6 - Long-Term Debt.
2022 2021 $ Change % Change
Capital Assets, not depreciated:
Land 172,449,079$ 172,449,079$ -$ 0%
Construction in progress 49,359,777 40,521,963 8,837,814 22%
Development rights 2,924,038 2,924,038 - 0%
Capital Assets, depreciated, net:
Improvements 105,146,063 101,095,687 4,050,376 4%
Buildings 33,868,706 39,397,653 (5,528,947) -14%
Equipment 24,885,270 19,591,755 5,293,515 27%
Total Capital Assets 388,632,933$ 375,980,175$ 12,652,758$ 3%
28
MANAGEMENT’S DISCUSSION AND ANALYSIS
PASSENGER FACILITY CHARGES (PFCs)
In October 1993, RTAA received approval from FAA to impose a PFC of $3.00 per enplaned passenger.
Collection began January 1, 1994. In May 2001, that amount increased to $4.50 per enplaned passenger
with collection beginning August 1, 2001. For the fiscal year ended June 30, 2022, RTAA collected PFCs,
including interest earnings thereon, totaling $8.503 million, a $3.989 million or 47% increase over the prior
year. This increase is due to a 69% increase in enplanements over FY 2021. PFCs are collected by airlines
on their passengers’ tickets and remitted monthly to RTAA. These funds are spent on a list of projects
reviewed by the airlines in a process prescribed by the FAA. This funding must be segregated from all other
Airport revenues. For further details, see the Summary Schedule of Passenger Facility Charges Collected
and Expended in the Compliance Section of this report.
CUSTOMER FACILITY CHARGES (CFCs)
CFCs are paid by customers utilizing rental cars based at RNO. Implemented in August 2012, the CFCs are
collected and remitted by the rental car companies to RTAA. For the fiscal year ended June 30, 2022, RTAA
collected CFCs, including interest earnings thereon, totaling $6.351 million, a $1.397 million or 22%
increase over the prior year. This increase is due to the increased passenger activity at RNO. They are
designated to fund property management, repairs, and improvements to RTAA-owned rental car facilities.
In addition, they will provide funding for a future Consolidated Rental Car (CONRAC) facility as identified
in RTAA’s current master plan. Beginning July 1, 2020, CFC per rental car transaction day fees increased
to $5.50 from $4.50.
AIRLINE SIGNATORY RATES AND CHARGES
RTAA and the airlines successfully negotiated an airline use and lease agreement effective July 1, 2015,
for a term of five years. In FY 2020, the agreement was extended for three years and includes seven
“signatory airlines” including five passenger and two cargo airlines. The airline agreement establishes the
airline rate setting formula and the airport model is known as a hybrid rate setting formula. In this formula,
the two airports owned and operated by RTAA are divided into six cost centers: Airfield, Terminal Building,
Baggage Handlings System (BHS), Landside (Parking and Ground Transportation), Other, and Reno-Stead
Airport. The Airfield and Terminal Building airline related cost centers are used in the calculation of the
landing fee and terminal rental rate.
Net airfield costs and associated landing fees are established on a cost center residual methodology in which
the signatory airlines bear 100% of the financial risk for the Airfield. The expenditures associated with the
Airfield cost center, which are primarily comprised of operating expenses, debt service, and recovery of
capital projects/equipment with unit costs of less than $300,000, are divided by estimated aircraft landed
weight resulting in a landing fee rate.
In contrast, the terminal building rental rates reflect a commercial compensatory rate setting formula that
places the financial risk of funding terminal building costs with RTAA. The expenditures, which are
primarily comprised of operating expenses, debt service, and recovery of capital project/equipment
expenditures with unit costs of less than $300,000, in the Terminal Building cost center are divided by a
“rentable” space divisor (total terminal space available that is revenue producing and available for lease).
The result of this approach is that the signatory airlines are only responsible for terminal building costs
allocated to airline leased premises and any costs allocated to vacant, concession, or other rentable space is
the financial responsibility of RTAA.
In addition, the current hybrid agreement provides that RTAA’s net available revenues after debt service
are split equally (50%-50%) between the signatory airlines and RTAA through a revenue sharing formula.
29

MANAGEMENT’S DISCUSSION AND ANALYSIS
Revenue sharing is derived by taking the sum of RTAA’s total revenues less total expenses posted to all
costs centers less debt service and other identified requirements. A credit estimate offsets airline terminal
building rents collected during the year with a final airline rates and charges reconciliation and settlement
prepared based on audited year-end results.
The final rates and charges for the signatory airlines are shown below for the fiscal year ended June 30,
2022, and 2021:
Comparing the operating results of airports is difficult. The landing fee and terminal rental rates of airports
are often not comparable because of the different airline operating agreements used to calculate those fees.
As a result, an airport’s impact to signatory airline tenants is benchmarked on a ratio of total fees paid by
the airlines (landing fees and terminal rents), divided by the number of passengers boarding aircraft. RTAA
targets to maintain a reasonable cost structure for the airlines to attract and retain air service to the Reno-
Sparks community. The RNO cost per enplaned passenger for the fiscal year ended June 30, 2022, was
calculated to be $6.21 as compared to $9.17 in the prior year. The chart below presents the history of the
cost per enplaned passenger.
ECONOMIC FACTORS AND NEXT YEAR’S BUDGET
Faced with the many challenges brought on by the COVID-19 pandemic and economic uncertainty, RTAA
proved its resiliency, and is in a strong financial position entering FY 2022-23. The global and regional
economy is rebounding, and RNO is experiencing above pre-pandemic level summer traffic volumes unlike
many other similar size airports. As we now focus on recovery efforts, we remain committed to ensuring
the wellbeing of our employees, the sustainability of business partnerships and meeting our critical
operational responsibilities with safety being our first and foremost responsibility.
2022 2021 $ Change % Change
Landing Fee Rate
(Per 1,000-pound units) $ 3.04 $ 3.23 ($0.38) 12%
Terminal Rental Rate (Average) (Per
square foot annually) $40.66 $45.74 ($5.08) -11%
30
MANAGEMENT’S DISCUSSION AND ANALYSIS
The greater Reno area’s economic picture has become far more diversified and the growth in recent years
has been significant. The Reno-Tahoe regional area economy is no longer relying solely on tourism and
gaming, as it was at the time of the 2008 great recession. Northern Nevada’s business friendly environment,
proximity to customers, availability of skilled workforce and logistics continues to attract a diverse group
of businesses to the area.
The diversity of industry in Northern Nevada is expected to provide a solid foundation for recovery and
long-term growth following the COVID-19 pandemic. It will also help soften the effects of a potential
recession. Nevada’s June unemployment rate dropped to 4.7% compared to the 29.5% reached at the height
of the pandemic in April 2020 according to the Nevada Department of Employment, Training and
Rehabilitation (DETR). Of the three Metropolitan Statistical Areas (MSA) in Nevada, Reno’s
unemployment rate was the lowest at 3.3%, while the Las Vegas area was at 5.7% and Carson at 3.7% in
June 2022.
The fiscal year 2022-23 Board approved budget is balanced, includes increased funding for mission critical
airport operations, higher revenues, and the usage of federal funding to maintain reasonable signatory
airline rates and charges. As the recovery progresses, we continue to closely monitor airline traffic,
revenues, and expenses and are prepared to make necessary adjustments if the current forecast does not
materialize or are faced with an economic recession.
REQUESTS FOR INFORMATION
This financial report is designed to provide a general overview of the financial activity and condition of
RTAA to all having such an interest. Questions concerning any of the information provided in this report
or requests for additional financial information should be addressed to Reno-Tahoe Airport Authority,
Accounting Department, P.O. Box 12490, Reno, NV 89510-2490 or “Ask the Airport” at
31
BASIC FINANCIAL
STATEMENTS

RENO-TAHOE AIRPORT AUTHORITY
STATEMENT OF NET POSITION
JUNE 30, 2022
ASSETS
CURRENT ASSETS
Unrestricted Assets:
Cash and cash equivalents 12,924,586$
Investments 68,254,001
Accounts receivable, net 4,805,216
Lease receivable 8,242,115
Interest receivable 174,662
Inventory 905,754
Other current assets 772,648
Total Unrestricted Assets 96,078,982
Restricted Assets:
Cash and cash equivalents 30,944
Investments 28,398,664
Grants receivable 1,482,845
Interest receivable 65,600
Total Restricted Assets 29,978,053
Total Current Assets 126,057,035
NON-CURRENT ASSETS
Capital Assets:
Non-depreciable 224,732,894
Depreciable 830,511,877
Less accumulated depreciation and amortization (666,611,838)
Total Capital Assets 388,632,933
Other Assets:
Road credits 1,383,599
Lease receivable 33,195,211
Total Other Assets 34,578,810
Total Non-Current Assets 423,211,743
Total Assets 549,268,778
DEFERRED OUTFLOWS OF RESOURCES
Pension contributions after measurement date 2,819,460
Pension difference between actual and proportionate
share of contributions 301,778
Pension changes in actuarial assumptions 8,156,060
Pension difference between expected and actual pension
experience 2,721,075
OPEB contributions after measurement date 127,166
Total Deferred Outflows of Resources 14,125,539
Total Assets and Deferred Outflows of Resources 563,394,317
Continued
32

RENO-TAHOE AIRPORT AUTHORITY
STATEMENT OF NET POSITION
JUNE 30, 2022
LIABILITIES
CURRENT LIABILITIES
Payable from Unrestricted Assets:
Accounts payable 6,131,855$
Construction contracts payable 2,198,705
Rents received in advance 2,027,604
Accrued payroll and compensated absences 1,593,458
Total current unrestricted assets 11,951,622
Payable from Restricted Assets:
Construction contracts payable 101,202
Total restricted current liabilities 101,202
Total Current Liabilities 12,052,824
NON-CURRENT LIABILITIES
Compensated absences, net of current portion 1,270,995
Deposits 899,278
Reclamation liability 564,844
Total OPEB liability 1,939,121
Net pension liability 24,565,172
Total Non-Current Liabilities 29,239,410
Total Liabilities 41,292,234
DEFERRED INFLOWS OF RESOURCES
Pension difference between actual and projected earnings on
plan investments 20,044,398
Pension difference between actual and expected pension experience 172,881
Pension difference between actual and proportionate share
of contribution 1,579,990
Leases 41,180,037
Total Deferred Inflows of Resources 62,977,306
NET POSITION
Net investment in capital assets 388,632,933
Restricted for:
Operations and maintenance reserve 7,532,989
Renewal and replacement reserve 770,498
Passenger facility charge projects 20,160,846
Other reserve purposes 30,949
Total Restricted 28,495,282
Unrestricted 41,996,562
Total Net Position 459,124,777
Total Liabilities, Deferred Inflows of Resources, and Net Position 563,394,317$
See accompanying notes to financial statements.
33

RENO-TAHOE AIRPORT AUTHORITY
STATEMENT OF REVENUES, EXPENSES, AND CHANGES IN
NET POSITION FOR THE YEAR ENDED JUNE 30, 2022
OPERATING REVENUES
Landing fees 10,584,517$
Concession revenue 15,257,011
Parking and ground transportation 14,004,587
Rentals 15,073,833
Reimbursements for services 3,000,059
Other revenue 145,174
Total operating revenues 58,065,181
OPERATING EXPENSES
Employee wages and benefits 30,348,607
Utilities and communications 3,156,581
Purchase of services 7,405,170
Materials and supplies 2,575,145
Administrative expenses 2,854,518
Total operating expenses 46,340,021
OPERATING INCOME BEFORE DEPRECIATION
AND AMORTIZATION 11,725,160
Depreciation and amortization expense 25,079,112
OPERATING INCOME (LOSS) (13,353,952)
NON-OPERATING REVENUES (EXPENSES)
Interest income 1,246,627
Gain (Loss) on value of investments (2,737,875)
Passenger facility charge revenue 8,502,997
Customer facility charge revenue 6,350,891
Jet fuel tax revenue 294,018
Gain on sale of capital assets 15,080
Federal grant revenue 14,483,077
Interest expense (399,857)
Total non-operating revenues (expenses) 27,754,958
INCOME (LOSS) BEFORE CAPITAL CONTRIBUTIONS 14,401,006
CAPITAL CONTRIBUTIONS (FEDERAL) 27,686,032
CHANGE IN NET POSITION 42,087,038
NET POSITION, BEGINNING OF YEAR 417,037,739
NET POSITION, END OF YEAR 459,124,777$
See accompanying notes to financial statements.
34

RENO-TAHOE AIRPORT AUTHORITY
STATEMENT OF CASH FLOWS
FOR THE YEAR ENDED JUNE 30, 2022
CASH FLOWS FROM OPERATING ACTIVITIES
Cash received from customers 58,641,436$
Cash paid to employees and for benefits (33,731,727)
Cash paid to suppliers (14,553,707)
Net cash provided by operating activities 10,356,002
CASH FLOWS FROM NONCAPITAL FINANCING ACTIVITIES
Federal grants received 13,209,077
Jet fuel tax revenue 294,018
Net cash provided by noncapital financing activities 13,503,095
CASH FLOWS FROM CAPITAL AND RELATED FINANCING ACTIVITIES
Capital contributions (federal) 27,845,338
Passenger facility charge revenue 8,502,997
Customer facility charge revenue 6,350,891
Acquisition and construction of capital assets (37,267,116)
Proceeds from sale of capital assets 15,080
Principal paid on bonds (12,290,000)
Interest paid on bonds (568,844)
Net cash provided by (used in) capital and related
financing activities (7,411,654)
CASH FLOWS FROM INVESTING ACTIVITIES
Receipts of interest 1,226,258
Purchase of investments (116,397,285)
Sale of investments 99,488,157
Net cash provided by (used in) investing activities (15,682,870)
NET INCREASE (DECREASE) IN CASH AND CASH EQUIVALENTS 764,573
CURRENT AND RESTRICTED CASH AND CASH
EQUIVALENTS, BEGINNING OF YEAR 12,190,957
CURRENT AND RESTRICTED CASH AND CASH
EQUIVALENTS, END OF YEAR 12,955,530$
Continued
35

RENO-TAHOE AIRPORT AUTHORITY
STATEMENT OF CASH FLOWS
FOR THE YEAR ENDED JUNE 30, 2022
RECONCILIATION OF OPERATING INCOME (LOSS) TO NET CASH
PROVIDED BY OPERATING ACTIVITIES
Operating (loss) income (13,353,952)$
Adjustments to reconcile operating (loss) income to net cash
provided by operating activities:
Depreciation and amortization 25,079,112
(Increase) Decrease in Assets:
Accounts receivable, net 196,186
Lease receivable (41,437,326)
Inventory (113,509)
Other current assets 251,218
Increase (Decrease) in Liabilities:
Accounts payable 1,301,952
Rents received in advance 296,280
Accrued payroll 223,623
Deposits and unearned revenues 341,079
Total OPEB liability and related deferred outflows of resources (72,006)
Net pension liability and related deferred outflows
and inflows of resources (3,534,753)
Lease deferred inflows of resources 41,180,037
Reclamation liability (1,938)
Net cash provided by operating activities 10,356,002$
Noncash activities:
Capital assets included in construction contracts payable 2,299,907$
Capital Contributions
Total Capital Contributions 27,686,032$
Grants Receivable (June 30, 2022 and 2021) (591,945)
Grants Receivable (June 30, 2021 and 2020) 1,482,845
28,576,932$
See accompanying notes to financial statements.
36
NOTES TO THE
FINANCIAL STATEMENTS

RENO-TAHOE AIRPORT AUTHORITY
NOTES TO FINANCIAL STATEMENTS
JUNE 30, 2022
1.
Organization and Reporting Entity
A.
Organization
The Reno-Tahoe Airport Authority (“RTAA” or “Authority”) (formerly the Airport Authority of
Washoe County) was created on July 1, 1977, by an act of the Nevada Legislature for the purpose of
operating Reno-Tahoe International Airport (RNO) and Reno-Stead Airport (RTS).
B.
Reporting Entity
RTAA is an independent reporting entity and not a component unit of another government. This
conclusion is based on the following criteria:
i.
Composition of the Board.
The governing boards of the following jurisdictions appointed nine members to the Board of
Trustees
as follows: (1) four members by the City of Reno, (2) two members by the City of
Sparks, (3) two
members by Washoe County, and (4) one member by the Reno-Sparks
Convention & Visitors
Authority (RSCVA). The Board directs the President/CEO, who is
responsible for management
and staffing of the RTAA departments. RTAA is responsible
for the day-to-day operations at the
two airports.
ii.
Accounting for Fiscal Matters.
RTAA is responsible for reviewing, approving, and revising its budget. The Authority is
solely
responsible for financing the entity’s deficits and has sole control of its surplus funds,
restricted only
by the RTAA’s Bond Resolutions and underlying Lease and Use Agreements.
RTAA collects revenues, controls disbursements, and has title to all assets. RTAA establishes
fees and
charges and negotiates contracts with commercial enterprises.
2.
Summary of Significant Accounting Policies
A.
Basis of Accounting
The accompanying financial statements have been prepared on the accrual basis of accounting in
accordance with accounting principles generally accepted in the United States of America (GAAP)
as applicable to governmental units. RTAA uses the economic resources measurement focus,
whereby revenues and expenses are recognized in the period earned or incurred, regardless of when
the related cash flows take place. All transactions are accounted for in a single enterprise fund.
Enterprise funds account for the following activities:
i.
Financed and operated in a manner similar to private business enterprises – where the intent of the
governing body is that the costs of providing goods or services to the general public on a
continuing basis be financed or recovered through user charges; or
37

RENO-TAHOE AIRPORT AUTHORITY
NOTES TO FINANCIAL STATEMENTS
JUNE 30, 2022
ii.
The governing body has decided that periodic determination of revenues earned, expenses
incurred, or net income is appropriate for capital maintenance, public policy, management control,
accountability, or other purposes.
Revenues from landing fees, rents, parking operations, and other miscellaneous sources are reported
as
operating revenues. Transactions, which are capital, financing or investing related, are reported
as
non-operating revenues, including Passenger Facility Charges (PFC) and Customer Facility Charges
(CFC).
Expenses from employee wages and benefits, purchases of services, materials and supplies, and other
miscellaneous expenses are reported as operating expenses. Interest expense and financing costs are
reported as non-operating expenses.
B.
Use of Estimates
The preparation of financial statements in conformity with U.S. GAAP requires management to
make estimates and assumptions that affect certain reported amounts and disclosures. Accordingly,
actual results could differ from those estimates.
C.
Budgets
RTAA adheres to the Local Government Budget and Finance Act established by Nevada state statute.
The filing deadlines and procedures during fiscal year 2021-2022 were as follows:
i.
On or before April 15, the RTAA files a preliminary operating budget with the State Department
of Taxation.
ii.
A public hearing on the proposed budget with the Board of Trustees on the Thursday following
the third Monday in the month of May.
iii.
On or before June 1, the final budget is adopted by a majority vote of the Board of Trustees.
iv.
The budget is adopted on the accrual basis. Actual operating and non-operating expenses
(excluding depreciation) may not exceed budgeted appropriations. Budget augmentations that
change the total revenues or expenses must be approved by a resolution of the Board of Trustees
and filed with the Nevada Department of Taxation. Unexpended appropriations lapse at year-end.
D.
Cash, Cash Equivalents, and Investments
RTAA considers all liquid investments (including restricted assets) with an original maturity of three
months or less to be cash equivalents. Investments are measured at fair value.
E.
Inventory
Inventory is valued by the weighted average method. Weighted average measures the total cost of
items in inventory divided by the total number of units available for issuance. Inventory items are
recorded as assets when purchased and expensed as consumed.
38

RENO-TAHOE AIRPORT AUTHORITY
NOTES TO FINANCIAL STATEMENTS
JUNE 30, 2022
F.
Capitalization of Interest
Through June 30, 2020, RTAA capitalized, as a part of the historical cost of constructing assets for
its own use, a portion of
the net interest cost incurred during the construction period. The Authority
implemented Governmental Accounting Standards Board (GASB) Statement No. 89, Accounting for
Interest Cost Incurred before the End of a Construction Period, and no interest was capitalized for the
year ended June 30, 2022.
G.
Deferred Outflows/Inflows of Resources
In addition to assets and liabilities, the statement of net position may report a separate section for
deferred outflows of resources and deferred inflows of resources, respectively. These separate
financial statement elements represent the consumption or addition to net position that applies to a
future reporting period(s) and as such will not be recognized as flows of resources
(expenses/revenues) until then.
The statement of net position contains items relating to deferred outflows and deferred inflows
associated with
GASB Statement No. 68, Accounting and Financial
Reporting for Pensions, GASB
Statement No. 71, Pension Transition for Contributions Made
Subsequent to the Measurement Date,
and GASB Statement No. 87, Leases. A description of the deferred outflow and inflow items is as
follows:
Pension - contributions after measurement date for pensions and Other Postemployment Benefits
(OPEB). These contributions are
made after the measurement date through the fiscal year end
resulting in a cash outlay not yet recognized under GASB 68. This amount is deferred and
recognized in the following fiscal year. This item is presented as a deferred outflow of
resources.
Pension - difference between actual and proportionate share of contributions. This represents
the unamortized difference between actual and proportional contributions to the defined benefit
pension plan and
increases in the RTAA’s allocation share as provided in the schedule of
employer allocations
for the year ending June 30, 2021.
Pension - changes in actuarial assumptions. These amounts represent the difference resulting from
a change in assumptions used to measure the underlying net pension, OPEB liability, or asset.
These differences are deferred and recognized over the estimated average remaining lives of all
members determined as of the beginning of the measurement period. This item can be presented
as both a deferred outflow and deferred inflow of resources.
Pension - difference between expected and actual pension experience. These amounts
represent
the difference in expected and actual pension or OPEB experience. These differences
are deferred
and recognized over the estimated average remaining lives of all members determined as of the
beginning of the measurement period. This item can be
presented as both a deferred outflow
and deferred inflow of resources shown as net if there are unamortized balances for categories.
39

RENO-TAHOE AIRPORT AUTHORITY
NOTES TO FINANCIAL STATEMENTS
JUNE 30, 2022
Pension - difference between actual and projected earnings on plan investments. These
amounts represent the difference in projected and actual earnings on pension plan assets.
The
differences are deferred and amortized over a closed five-year period. This item can
be presented
as both a deferred outflow and deferred inflow of resources and is combined
annually as a
single net unamortized balance.
Leases – value of the lease receivable and prepayments. These amounts represent the present
value of future lease payments in addition to any payments received at or before the
commencement of the lease term that relates to future periods. The deferred inflow will be
amortized over the life of the lease.
See Note 8 - Leases, Note 9 - Pension Plan, and Note 13 - Other Postemployment Benefits (OPEB)
for additional information on the deferred outflows and inflows of resources.
H.
Compensated Absences
RTAA accounts for compensated absences by accruing a liability for employees’ compensation of
future absences. Employees accrue vacation in varying amounts based on classification and length of
service.
Additionally, certain employees are allowed compensated time off in lieu of overtime
compensation
and/or working on holidays. Vacation pay and compensatory time vests as earned and
sick pay vests
after five years of service at the rate of 50% available for payout at termination for
certain
represented employees. After 880 hours, sick pay also vests for certain represented employees.
The liability for the compensated absences is included in both the current and non-current portion of
accrued payroll. As of June 30, 2022, liabilities related to compensated absences were $2,330,697.
I.
Landing Fees, Terminal Building Rents, and Baggage Handling System (BHS) Charges
Landing fees, terminal rents, and BHS charges are set based and collected on estimates of airline
activity, revenues, and expenses. The actual landing fees, terminal rental rates, and BHS charges due
from the signatory airlines are calculated based on actual year-end results in accordance with the
Airline
Use and Lease Agreement (AULA). Any over-collections and under-collections are netted
and recorded on
the Statements of Net Position as an accounts receivable or accounts payable.
J.
Net Position
The following categories comprise the RTAA’s net position:
i.
Net Investment in Capital Assets – Capital assets, net of accumulated depreciation and outstanding
principal balances of debt attributable to the acquisition, construction, or improvement of those
assets.
ii.
Restricted – Net Position that has external constraints placed on it by creditors, grantors,
contributors, or laws or regulations of other governments, or imposed by law through contribution
provision of enabling legislation.
iii.
Unrestricted – Unrestricted net position consists of net position that does not meet the definition
of “restricted” or “net investment in capital assets.”
40

RENO-TAHOE AIRPORT AUTHORITY
NOTES TO FINANCIAL STATEMENTS
JUNE 30, 2022
At times, RTAA will fund outlays for a particular purpose from both restricted and unrestricted
resources. It is the RTAA’s policy to deplete restricted net position, if permitted, before unrestricted
net position is applied.
K.
Passenger Facility Charge (PFC) Revenue
Currently, RTAA has approval from the Federal Aviation Administration (FAA) to impose
and use a PFC of $4.50 per enplaned
passenger. PFC collections fund FAA approved projects to
improve or renew passenger safety, conveyance, or related facilities. The airlines collect and remit
PFC
revenues monthly to RTAA. These revenues are recognized by RTAA as non-operating revenues.
L.
Customer Facility Charge (CFC) Revenue
Effective August 2012, RTAA implemented a $1.25 CFC per
transaction day on each individual
vehicle rental collected by each participating rental car lessee. On July 1, 2019, the rate increased
to $4.50 and on July 1, 2020, increased to $5.50. CFC revenues fund the following projects: (1)
renewal
and replacement improvements to the Quick Turnaround (QTA) Facility and the Service
Facility
Area, (2) the on-going overhead and maintenance of the QTA, and (3) the building of a future
consolidated rental car facility. In addition, $0.11 per rental day of
CFC receipts reimburse RTAA
to cover reasonable costs associated with accounting,
administering, and managing the CFC program.
The rental car companies operating at RNO collect and remit CFC revenues monthly to RTAA. These
revenues are classified as non-operating revenues.
M.
Capital Contributions
The FAA’s Airport Improvement Program (AIP) funds a
significant portion of eligible costs for
airport capital improvements along with matching funds
provided by RTAA or through the PFC
program. In addition, the Transportation Security
Administration (TSA) funds certain approved
capital projects associated with passenger and luggage
screening.
Capital funding provided under government grants and agreements are considered earned as the
related allowable expenses are incurred. Grants and related agreements for the acquisition of land,
acquisition and construction of property, and certain types
of equipment are reported in the
Statements of Revenues, Expenses and Changes in Net Position,
after non-operating revenues and
expenses, as capital contributions.
N.
Regional Road Impact Fee Credits
The regional road impact fee is a one-time assessment to pay for new roads or improvements to
existing roads necessary to serve traffic from a new development. Payment of this fee is typically
required upon issuance of a building permit. RTAA owns credits for the fees and can use them
as
needed or sell them to others until the credits expire June 26, 2033. The value of these credits was
determined by Washoe County, who provided the credits to RTAA.
41

RENO-TAHOE AIRPORT AUTHORITY
NOTES TO FINANCIAL STATEMENTS
JUNE 30, 2022
O. Recent Accounting Pronouncements Adopted/Implemented:
During the year, RTAA adopted the following new GASB Statements:
GASB Statement No. 87, Leases. This Statement, originally issued in June 2017, requires the
recognition of certain leased assets and liabilities for leases that previously were classified as
operating leases and recognize them as inflows of resources or outflows of resources based on the
payment provisions of the contract. It establishes a single model for lease accounting based on
the foundational principle that leases are financings of the right to use an underlying asset. This
Statement had a material effect on the financial statement of the Authority. For a detailed
discussion please refer to Note 8 – Leases.
GASB Statement No. 89, Accounting for Interest Cost Incurred before the End of a Construction
Period. This Statement requires that interest cost incurred before the end of a construction period
be recognized as an expense in the period in which the cost is incurred for financial statements
prepared using the economic resources measurement focus. As a result, interest cost incurred
before the end of a construction period will not be included in the historical cost of a capital asset
reported in a business-type activity or enterprise fund. This Statement did not have a material
effect on the financial statements.
GASB Statement No. 92, Omnibus 2020. The objectives of this Statement are to enhance
comparability in accounting and financial reporting and to improve the consistency of
authoritative literature by addressing practice issues that have been identified during
implementation and application of certain GASB Statements. This Statement did not have a
material effect on the financial statements.
GASB Statement No. 93, Replacement of Interbank Offered Rates. The objective of this
Statement is to address accounting and financial reporting implications that result from the
replacement of an IBOR. This statement did not have an effect on the financial statements.
GASB Statement No. 97, Certain Component Unit Criteria, and Accounting and Financial
Reporting for Internal Revenue Code (IRC) Section 457 Deferred Compensation Plans. The
objective of this statement is to improve the reporting post-employment benefit plans for primary
governments with component units. This Statement did not have an effect on the financial
statements.
GASB Statement No. 98, The Annual Comprehensive Financial Report. This Statement
establishes the term annual comprehensive financial report and its acronym ACFR. That new term
and acronym replace instances of comprehensive annual financial report and its acronym in
generally accepted accounting principles for state and local governments. This Statement did not
have a material effect on the financial statements.
42

RENO-TAHOE AIRPORT AUTHORITY
NOTES TO FINANCIAL STATEMENTS
JUNE 30, 2022
In addition, GASB has issued the following statements that have not yet been implemented by RTAA:
GASB Statement No. 91, Conduit Debt Obligations.
GASB Statement No. 94, Public-Private and Public-Public Partnerships and Availability
Payment Arrangements.
GASB Statement No. 96, Subscription-Based Information Technology Arrangements.
GASB Statement No. 99, Omnibus 2022.
GASB Statement No. 100, Accounting Changes and Errors – An Amendment of GASB Statement
No. 62.
GASB Statement No. 101, Compensated Absences.
RTAA will continue to evaluate GASB Statements and determine if these statements will have a
financial impact and require implementation in future reporting periods.
3.
Cash, Cash Equivalents, and Investments
RTAA accounts for its investments at fair value. Cash, Cash Equivalents, and Investments consist
of the following as of June 30, 2022:
The balance of cash and cash equivalents as of June 30, 2022, was $12,955,531. Restricted cash, cash
equivalents, and investments represent funds deposited with third-party custodians, which are
restricted as to use pursuant to the revenue bond resolutions as discussed in Note 6 – Long-Term
Debt. The resolutions also impose limitations as to the disposition of related interest income.
Cash and Cash Equivale nts :
12,955,530$
Investments:
State of Nevada Local Government Pool 26,416,580
US Government Agency Securities 55,865,882
Corporate Securities 14,370,203
Total Investments 96,652,665
Total Cash, Cash Equivalents, Investments 109,608,195
Less: Unrestricted Cash, Cash Equivalents, Investments (81,178,587)
Total Re stricte d Cash, Cash Equivalents, Investments
28,429,608$
43

RENO-TAHOE AIRPORT AUTHORITY
NOTES TO FINANCIAL STATEMENTS
JUNE 30, 2022
GASB Statement No. 72, Fair Value Measurement and Application, defines fair value, establishes a
framework for measuring fair value and provides a fair value hierarchy that prioritizes the inputs to
valuation techniques used to measure fair value as follows: Level 1 inputs are unadjusted quoted
prices for identical assets or liabilities in active markets; Level 2 inputs are other observable inputs;
Level 3 inputs are unobservable.
The estimated fair values of the RTAA’s U.S. Treasury obligations, commercial paper, notes, bonds,
and other obligations issued by U.S. Corporations are based on quoted market prices provided by
recognized broker dealers (Level 1 inputs). The estimated fair value of U.S. Agency securities is
based on a matrix pricing model that maximizes the use of observable inputs for similar securities as
provided by recognized broker dealers (Level 2 inputs). Below is the categorization of the RTAA’s
total cash, cash equivalents, and investments as of June 30, 2022, by fair market value using the
categories of relative reliability:
Investment Policies
In accordance with Nevada Revised Statute (NRS) 355 Public Investments, the RTAA’s Bond
Resolution and Investment Policy, RTAA manages its exposure to interest rate risk by regular
evaluation of the RTAA’s cash position to determine the amount of short and long-term funds available
for investment within the context of the entire portfolio and its cash flow and liquidity needs. By
purchasing a combination of shorter term and longer-term investments and timing their maturities,
RTAA meets its cash flow and liquidity needs. RTAA uses specific identification for calculating
unrealized gains or losses for investment valuation.
Total Cash,
Cash
Equivalents,
and
Investments
Quoted Prices
in Ac tive
Markets for
Identical
Assets
Significant
Other
Observable
Inputs
Significant
Unobservable
Inputs
June 30, 2022 (Level 1) (Level 2) (Level 3)
Investments by Fair Value Level:
US Agencies 24,535,198$ -$ 24,535,198$ -$
US Treasury Notes 31,330,684 31,330,684 - -
Corporate Securities 14,370,203 - 14,370,203 -
Total Investments by Fair Value Level 70,236,085$ 31,330,684$ 38,905,401$ -$
Investments at Net Asset Value (NAV):
State of Nevada Local Government Pool 26,416,580
Total Investments at Net Asset Value (NAV) 26,416,580
Cash:
Collateralized Bank Deposits 12,955,530
Total Cash, Cash Equivalents,
and Inve s tments
109,608,195$
44

RENO-TAHOE AIRPORT AUTHORITY
NOTES TO FINANCIAL STATEMENTS
JUNE 30, 2022
Included in the RTAA’s investment portfolio as of June 30, 2022, are the following statutorily approved
investments:
Demand Deposits, Time and Savings Deposits including Negotiable Order of Withdrawal
(NOW) accounts. They are issued by insured commercial banks, credit unions or saving and
loan associations, either within the limits of insurance provided by an instrumentality of the
United States and/or collateralized as required under the Nevada pooled collateral program
(NRS 356).
US Government Agency Securities (Mortgage-Backed Securities). These securities are issued
by a U.S. government-sponsored agency with backing by the federal government, but not
guaranteed since the agencies are private entities. Such agencies have been set up in order to
allow certain groups of people to access low-cost financing, e.g. home buyers, farmers, and
students. The RTAA’s investments include Federal National Mortgage Association, Federal
Home Loan Banks, Federal Home Loan Mortgage Corporation, and Federal Farm Credit
Banks.
US Treasury Notes. These notes are issued by the United States government in order to pay for
government projects. They are backed by the U.S. government making them low risk. Interest
payments on the notes are made every six months until maturity which is usually not less than
one year or more than seven years.
Certificate of Deposit (CD). A CD is a time deposit offered by a financial institution. The
Federal Deposit Insurance Corporation (FDIC) insures CDs similar to savings accounts. They
are different from savings accounts in that the CD has a specific, fixed term (often three months,
six months, or one to five years), and, usually, a fixed interest rate. The FDIC provides deposit
insurance, which guarantees the safety of deposits in member banks, currently up to $250,000
per depositor per bank.
State of Nevada Local Government Investment Pool (LGIP). Investment of the LGIP is a
function performed by the Office of the State Treasurer pursuant to NRS. In addition to
investing the assets of the LGIP as prescribed by law, with regular oversight provided by the
State Board of Finance, an investment policy also controls the parameters used to invest pool
assets. Investment in the LGIP is carried at fair value, which is the same as the value of pool
shares. By pooling funds, participating local governments benefit from economies of scale,
full-time portfolio management, diversification, and liquidity. The external investment pool is
not registered with the Securities and Exchange Commission (SEC) as an investment company.
The LGIP investment policy allows for investments in bankers’ acceptances, commercial paper,
corporate notes, money market funds, negotiable certificates of deposit, repurchase agreements, tax-
exempt municipal bonds, time certificates of deposit, U.S. Treasury securities, U.S. agency securities,
and asset-backed securities, with the objective of preserving the principal investment and providing a
competitive return.
45

RENO-TAHOE AIRPORT AUTHORITY
NOTES TO FINANCIAL STATEMENTS
JUNE 30, 2022
The fair value of the investment in this type has been determined using a Net Asset Value (NAV)
calculation. The NAV is calculated daily by dividing the total value of the securities and other assets,
less any liabilities, by the total outstanding shares of the fund. RTAA may withdraw funds from the
pool upon written notice and LGIP shall comply at the first reasonable opportunity. However, the LGIP
may charge RTAA any penalty or loss of interest resulting from the withdrawal of funds, if necessary,
to meet the request. RTAA has no unfunded commitments as of June 30, 2022.
In addition, NRS 355.171 provides the following additional authorized investments for counties and
school districts with county populations greater than 100,000 (Washoe County) and city governments
with city populations greater than 150,000:
A.
Notes, bonds, and other unconditional obligations for the payment of money issued by
corporations organized and operating in the United States that:
i.
Are purchased from a registered broker-dealer;
ii.
At the time of purchase, have a remaining term to maturity of no more than five
years;
iii.
Are rated by a nationally recognized rating service as “A” or its equivalent, or
better;
iv.
Such investments must not, in aggregate value, exceed 20% of the total portfolio
as determined on the date of purchase; and
v.
Not more than 25% of such investments may be in notes, bonds and other
unconditional obligations issued by any one corporation.
B.
Collateralized mortgage obligations that are rated by a nationally recognized rating
service as
“AAA” or its equivalent.
C.
Asset-backed securities that are rated by a nationally recognized rating service as “AAA”
or its
equivalent.
Custodial Credit Risk
Custodial credit risk is the risk that in the event of the failure of a depository financial institution, a
government will not be able to recover its deposits or will not be able to recover collateral securities
that are in the possession of an outside party. Any deposits in excess of FDIC Insurance, if applicable,
are held in the financial institution’s name. RTAA has no investment securities exposed to custodial
credit risk in the event of the failure of the counter party to a transaction.
46

RENO-TAHOE AIRPORT AUTHORITY
NOTES TO FINANCIAL STATEMENTS
JUNE 30, 2022
Interest Rate Risk
As of June 30, 2022, the RTAA’s cash, cash equivalents and investments have the following
maturity distributions:
Credit Risk
State statutes, the RTAA’s revenue bond resolutions and the RTAA’s investment policy authorize
investments in direct obligations of, or obligations guaranteed by the United States of America.
RTAA may also invest in commercial paper (rated A-1 or better by Standard & Poor’s or P-1 by
Moody’s Investor Services) or interests in short-term investment trust funds restricted to the
investment obligations described above.
The RTAA’s investment policy also permits investment in the State of Nevada LGIP and in deposit
accounts with
financial institutions collateralized under the State of Nevada Pooled Collateral
Program. This state
sponsored program provides 102% of collateral for any deposit in a participating
financial institution, above FDIC insurance protection. The collateral is composed of US Treasury
Obligations
and US Agency Securities. The LGIP is unrated external investment pools subject to
NRS 355.171 Public
Investment statutory requirements on authorized and prohibited investments.
At June 30, 2022, Standard & Poor’s had rated US Government Agency Securities (mortgage-
backed securities) as AA+ and the Fidelity Government Fund 57 (money market funds) as AAA.
Concentration of Credit Risk
Concentration of credit risk is the risk of loss attributed to the magnitude of the RTAA’s investment
in a single issue. RTAA places no limit on the amount RTAA may invest in any one issuer. As of
June 30, 2022, the following investments equaled or exceeded 5% of the RTAA’s total cash, cash
equivalents and investments:
0 to 1 Month 1 to 12 Months 1 to 2 Years 2 to 3 Years 3 to 5 Years Total
Cas h 12,955,530$ -$ -$ -$ -$ 12,955,530$
LGIP - 26,416,580 - - - 26,416,580
Securities:
US Treasury - 10,656,127 13,878,477 6,796,080 - 31,330,684
US Government Agency - 6,090,771 18,444,427 - - 24,535,198
Corporate - - 2,949,690 9,748,963 1,671,550 14,370,203
Total 12,955,530$ 43,163,478$ 35,272,594$ 16,545,043$ 1,671,550$ 109,608,195$
Investment Types 2022
Local Government Investment Pool 24%
We lls Fargo Collaterized Deposit 12%
US Agencies 22%
US Treasuries 29%
Corporate Securities 13%
Total 100%
47

RENO-TAHOE AIRPORT AUTHORITY
NOTES TO FINANCIAL STATEMENTS
JUNE 30, 2022
4.
Accounts and Grants Receivable
The following amounts represent receivables due to RTAA at June 30, 2022:
The grants receivable in the accompanying Statements of Net Position represent reimbursements due
for project costs under the FAA and TSA compliance audit by the RTAA’s independent auditor.
However, RTAA believes that the receivable amounts recorded result from qualified expenses and,
accordingly, an allowance for doubtful accounts is not required.
5.
Capital Assets
Capital assets are stated at historical cost and include property, equipment, and capitalized expenses
that substantially increase the useful lives of existing assets. The RTAA’s policy is to capitalize assets
with an initial cost of $5,000 or more and an estimated useful life of more than one year.
Accounts and Grants Receivable 2022
Current, Unrestricted:
Accounts Receivable 4,984,216$
Less: Allowance for uncollectable (179,000)
Net Accounts Receivable 4,805,216
Grants Receivable, Restricted 1,482,845
Total Current Accounts and Grants Receivable 6,288,061$
48

RENO-TAHOE AIRPORT AUTHORITY
NOTES TO FINANCIAL STATEMENTS
JUNE 30, 2022
Capital asset balances and changes for the year ended June 30, 2022, are as follows:
The straight-line method at various rates allocates the costs of property and equipment over the useful
lives of assets for depreciation. The estimated lives by general classification are as follows:
Years
Improvements 5-30
Buildings 3-30
Equipment 3-15
Development rights, which preclude residential development near RNO, are recorded at cost.
Development rights, which prevent the construction of residential homes on property adjacent to
RNO, are a condition of land ownership that goes on into perpetuity.
Balance Additions Deletions Balance
July 1, 2021 and Transfers and Transfers June 30, 2022
Capital Assets, not depreciated:
Land 172,449,079$ -$ -$ 172,449,079$
Construction in progress 40,521,963 37,121,919 (28,284,105) 49,359,777
Development rights 2,924,038 - - 2,924,038
Total Capital Assets, not depreciated 215,895,080 37,121,919 (28,284,105) 224,732,894
Capital Assets, depreciated:
Improvements 426,455,667 19,950,757 (46,380) 446,360,044
Buildings 289,439,198 170,853 - 289,610,051
Equipment 85,862,836 8,818,826 (139,880) 94,541,782
Total Capital Assets,depreciated: 801,757,701 28,940,436 (186,260) 830,511,877
Less accumulated depreciation for:
Improvements (325,359,980) (15,854,001) - (341,213,981)
Buildings (250,041,545) (5,699,800) - (255,741,345)
Equipment (66,271,081) (3,525,311) 139,880 (69,656,512)
Total accumlated depreciation: (641,672,606) (25,079,112) 139,880 (666,611,838)
Total Capital Assets, net 160,085,095 3,861,324 (46,380) 163,900,039
Net Capital Assets 375,980,175$ 40,983,243$ (28,330,485)$ 388,632,933$
49

RENO-TAHOE AIRPORT AUTHORITY
NOTES TO FINANCIAL STATEMENTS
JUNE 30, 2022
6.
Long-Term Debt
The changes in long-term debt for the year ended June 30, 2022, are as follows:
Bond Resolution
The revenue bond resolution established certain cash and investments sub-accounts (referred to as
“Funds”). These Funds provide accountability for bond proceeds and pledged revenues to assure
adherence to restrictions on expenses. Gross Revenues are defined as all income and revenues
received or accrued under generally accepted accounting principles derived directly or indirectly by
RTAA from the operation and use of and otherwise pertaining to the Airport System, or for any service
rendered by RTAA in the operation thereof. Gross revenues are deposited at least weekly in the
Revenue Fund. Operation and maintenance expenses are paid from these revenues. The remaining
funds are applied monthly, as outlined in the Bond Resolution, in the following amounts and order of
priority:
Bond Fund Interest and Principal Accounts – deposited in amounts sufficient to meet the next
required debt service payment on the revenue bonds.
Operating and Maintenance Reserve Fund – from amounts remaining after the above allocations
and the payment of debt service on any subordinate securities. This fund receives an allocation in
the amount necessary to reinstate over a one-year period a minimum reserve of 17% or two
months of the RTAA’s currently budgeted operation and maintenance expenses. RTAA's airline
agreement allows for the amount necessary to satisfy the two month O&M reserve fund be
included in the airline rates and charges calculation. The reserve fund requirement is calculated
annually based on the adopted budget.
Renewal and Replacement Fund – $10,000 per month until a specified maximum amount
(currently $780,000 but not less than $600,000) determined by RTAA is accumulated as an
emergency capital account.
Remaining funds are transferred then to the RTAA’s Special Fund in an amount aggregating
35% of annual gaming concession revenues.
Any remaining funds are transferred to the General Purpose Fund, to be used for additional
construction, maintenance, or other Airport obligations.
Balance Principal Balance
July 1, 2021 New Debt Repayment June 30, 2022
Revenue Bonds:
Series 2015 Bonds 12,290,000$ -$ (12,290,000)$ -$
Total Revenue Bonds 12,290,000 - (12,290,000) -
Less: Current Portion (1,910,000) - - -
Long-term debt: 10,380,000$ -$ (12,290,000)$ -$
50

RENO-TAHOE AIRPORT AUTHORITY
NOTES TO FINANCIAL STATEMENTS
JUNE 30, 2022
Pursuant to the Bond Resolution, the Revenue Fund, the Operation and Maintenance Fund, the
Operation and Maintenance Reserve Fund, the Renewal and Replacement Fund, the Special Fund,
and the General Purpose Fund may be held by RTAA. The Bond Fund and all accounts therein are
held by a commercial bank who serves as the Paying Agent and Trustee.
As the Authority has no outstanding debt as of June 30, 2022, and therefore does not require a Bond
Service Reserve Fund under the existing bond resolutions, RTAA may include separate debt service
reserve funds, created for individual series of parity securities issued, if required by the supplemental
instrument authorizing the issuance of such series of parity securities.
The revenue bond resolutions require RTAA to meet a rate maintenance covenant, whereby its annual
revenues, after deducting operation and maintenance expenses and 35% of gaming concession
revenues, must equal at least 125% of the revenue bond debt service requirement to be paid from such
revenues. Agreements with airlines provide for this coverage and the rate maintenance covenant
continues to be met for the year ended June 30, 2022, as there are no debt service requirements.
Series 2015 Bond
On September 30, 2015, RTAA issued the "Reno-Tahoe Airport Authority, Nevada, Airport Revenue
Refunding Bond, Series 2015" (the "2015 Bond"). The proceeds from the bond sale were used to
redeem the current Airport Revenue Refunding Bonds, Series 2005 (the “Series 2005 Bonds”), which
were outstanding as of July 1, 2015, in the amount of $20,940,000, and the cost of issuance necessary
to execute this transaction.
The Series 2015 Bond is a direct loan of $20,690,000 secured through a Request for Proposals (RFP)
process issued on July 9, 2015, to numerous banks and financial lending organizations. Upon review
of the submitted proposals, Compass Mortgage Corporation, an Alabama Corporation and a
subsidiary of BBVA Compass, provided the most favorable business terms and conditions.
On December 20, 2021, the Series 2015 Bond was paid in full. Fees related to the early termination
of debt were $265,854. Interest paid on this debt was $302,990 and interest expense for the current
fiscal year was $134,003.
7.
Non-Current Liabilities
Other long–term liability activity for the year ended June 30, 2022, is summarized below:
Balance Additions Deletions Balance
July 1, 2021 and Transfers and Transfers June 30, 2022
Compensated absences 2,312,166$ 865,858$ (847,327)$ 2,330,697$
Deposits 558,199 443,060 (101,981) 899,278
Reclamation liability 566,782 1,365 (3,303) 564,844
Less current portion of
compensated absenses - - - (1,059,702)
Total 3,437,147$ 1,310,283$ (952,611)$ 2,735,117$
51

RENO-TAHOE AIRPORT AUTHORITY
NOTES TO FINANCIAL STATEMENTS
JUNE 30, 2022
8.
Leases
Substantially all the property owned by RTAA is subject to non-cancelable leases and concession
agreements. The Authority, as a lessor, recognizes a lease receivable and a deferred inflow of
resources at the commencement of the lease term, with certain exceptions for leases of assets held as
investments, certain regulated leases, short-term leases, and leases that transfer ownership of the
underlying asset. For the lessor the asset underlying the lease is not derecognized. The lease
receivable is measured at the present value of the lease payments expected to be received during the
lease term. The deferred inflow of resources should be measured at the value of the lease receivable
in addition to any payments received at or before the commencement of the lease term that relate to
future periods.
For the purposes of the GASB No. 87 implementation, leases have been categorized as follows:
GASB No. 87 Leases – Included
GASB No. 87 Leases – Excluded – Regulated
GASB No. 87 Leases – Included
In accordance with GASB No. 87, the Authority recognizes a lease receivable and a deferred inflow
of resources for leases that are categorized as GASB No. 87 - Included. At the implementation date
of July 1, 2021, the beginning lease receivable and the deferred inflows were equal. These leases are
summarized as follows:
Concessions – the Authority has entered into multiple lease agreements for the use of concession
space. The terms of these agreements include a variable revenue component that is not included in
the measurement of the lease receivable related to the Authority receiving a concession fee based on
concession sales. Revenue recognized under the variable component of these lease agreements was
$9,458,011 for the year ending June 30, 2022. The agreements related to rental car concessions expire
on June 20, 2023, and other concession spaces have various expiration dates between 2023 and 2038.
Rentals – the Authority has entered into multiple property lease agreements to include land, buildings,
and office space. These leases range in expiration dates through February 28, 2067. The rent escalates
by an inflationary factor each year.
Beginning
Lease
Receivable
Implied
Interest
Annual Lease
Revenue
Ending Lease
Receivable
Deferred
Inflows
Concessions 11,317,061$ 78,994$ 5,799,000$ 6,829,501$ 6,799,828$
Rentals 37,416,007 513,421 3,277,370 34,607,825 34,380,209
Total 48,733,068$ 592,415$ 9,076,370$ 41,437,326$ 41,180,037$
52

RENO-TAHOE AIRPORT AUTHORITY
NOTES TO FINANCIAL STATEMENTS
JUNE 30, 2022
The receivable on these leases was discounted to the net present value determined as of July 1, 2021.
The discount rates are based on the Authority’s alternative minimum tax (AMT) borrowing rate and
the length of the lease and range from 0.83% to 2.02%.
Total future minimum lease payments to be received under lease agreements are as follows:
GASB No. 87 Leases – Excluded - Regulated
In accordance with GASB Statement No. 87, the Authority does not recognize a lease receivable and
a deferred inflow of resources for regulated leases. Regulated leases are certain leases subject to
external laws, regulations, or legal rulings, e.g., the U.S. Department of Transportation (DOT) and
the FAA, regulated aviation leases between airports and air carriers and other aeronautical users.
The Authority leases certain assets to various third parties, including ticket counters, passenger hold
rooms, terminal operations space, terminal office space, baggage service office space, unenclosed
storage areas, hangars, grounds and land, and are regulated leases under the FAA Rates and Charges
Policy and Grant Assurance 22. Leased land and hangars are considered exclusive use, while several
of the terminal locations are considered preferential or joint use. Terminal areas considered
preferential or exclusive use under regulated leases are as follows:
Passenger hold rooms – 14 of 23 available passenger hold rooms are designated as
preferential use
Baggage service office space – 100% of available space is designated preferential use
Ticket counters – 35 of 53 available ticket counters are designated as preferential use
Ticket office space – 100% of available space is designated preferential use
Terminal operations space – 100% of available space is designated preferential use
Unenclosed storage areas – 100% of available space is designated preferential use
Year Ending
June 30, Principal Interest Total Payments
2023 8,931,660$ 548,369$ 9,480,029$
2024 2,281,698 496,288 2,777,986
2025 2,206,258 469,598 2,675,856
2026 2,214,296 443,123 2,657,419
2027 1,740,770 417,584 2,158,354
2028-2032 5,052,142 1,823,234 6,875,376
2033-2037 4,106,513 1,485,017 5,591,530
2038-2042 4,242,383 1,153,147 5,395,530
2043-2047 4,546,818 804,711 5,351,529
2048-2052 4,927,754 423,776 5,351,530
2053-2057 2,522,915 111,975 2,634,890
2058-2062 791,800 48,160 839,960
2063-2067 769,245 14,718 783,963
Total 44,334,252$ 8,239,700$ 52,573,952$
53

RENO-TAHOE AIRPORT AUTHORITY
NOTES TO FINANCIAL STATEMENTS
JUNE 30, 2022
For the year ended June 30, 2022, RTAA received $2,596,704 in payments from leases under
regulated lease agreements, of which $1,113,198 was for fixed payments.
Future noncancelable fixed minimum payments under regulated lease agreements are as follows:
9.
Pension Plan
A. Purpose and History
RTAA contributes to the Public Employees Retirement System of Nevada (PERS), a cost-sharing,
multiple-employer, defined benefit plan governed by the Public Employees Retirement Board. PERS
provides retirement benefits, disability benefits, and death benefits, including annual cost of living
adjustments, to plan members and their beneficiaries. NRS Chapter 286 establishes the benefit
provisions provided to the participants of PERS. These plan provisions may only be amended through
legislation.
PERS was established by the Nevada Legislature in 1947, effective July 1, 1948, to provide a
reasonable base income to qualified employees who have been employed by a public employer and
whose earning capacities have been removed or substantially impaired by age or disability.
Pension plan fiduciary net position: Detailed information about the pension plan’s fiduciary net
position is available in the separately issued pension plan financial reports. PERS issues a publicly
available financial report that includes financial statements and required supplementary information.
The report may be obtained by going to www.nvpers.org , writing to the Public Employees Retirement
System of the State of Nevada, 693 Nye Lane, Carson City, NV 89703-1599 or by calling (775) 687-
4200.
Year Ending
June 30, Amoun
t
2023 3,174,736$
2024 776,052
2025 678,929
2026 592,884
2027 590,764
2028-2032 2,917,453
2033-2037 2,867,238
2038-2042 2,846,293
2043-2047 2,837,843
2048-2052 2,809,815
2053-2057 2,396,087
2058-2062 2,124,544
Total 24,612,638$
54

RENO-TAHOE AIRPORT AUTHORITY
NOTES TO FINANCIAL STATEMENTS
JUNE 30, 2022
B. Benefits
Benefits for plan members are funded under one of two methods: the employer paid contribution plan,
or the employer/employee paid contribution plan. All RTAA employees are under the employer paid
contribution plan where RTAA is required to contribute all amounts due under the plan. The
contribution requirements are established by NRS Chapter 286. The funding mechanism and benefits
may only be amended through legislation.
The RTAA’s contribution rates based on employee members covered payroll and amounts contributed
(equal to the required contributions) are as follows:
Contribution Rate
Regular Police/Fire Total Contribution
29.75% 44.00% $6,193,630
Benefits, as required by NRS, are determined by the number of years of accredited service at time of
retirement and the member’s highest average compensation in any 36 consecutive months with special
provisions for members entering the System on or after January 1, 2010. Benefit payments to which
participants or their beneficiaries may be entitled under the plan include pension benefits, disability
benefits, and survivor benefits.
Monthly benefit allowances for members are computed at 2.5% of average compensation for each
accredited year of service prior to July 1, 2001. For service earned on and after July 1, 2001, this
multiplier is 2.67% of average compensation. For members entering the System on or after January
1, 2010, there is a 2.25% multiplier.
The System offers several alternatives to the unmodified service retirement allowance which, in
general, allow the retired employee to accept a reduced service retirement allowance payable monthly
during his or her lifetime and various optional monthly payments to a named beneficiary after his or
her death. Post-retirement increases are provided by the authority of NRS 286.575–.579.
C. Vesting
Regular members are eligible for retirement at age 65 with five years of service, at age 60 with ten
years of service, or at any age with 30 years of service. Regular members entering the System on or
after January 1, 2010, are eligible for retirement at age 65 with five years of service, or age 62 with
ten years of service, or any age with 30 years of service. Regular members who entered the System
on or after July 1, 2015, are eligible for retirement at age 65 with five years of service, or at age 62
with ten years of service, or at age 55 with 30 years of service or any age with 33 1/3 years of service.
Police/Fire members are eligible for retirement at age 65 with five years of service, at age 55 with ten
years of service, at age 50 with 20 years of service, or at any age with 25 years of service. Police/Fire
members entering the System on or after January 1, 2010, are eligible for retirement at age 65 with
five years of service, or age 60 with ten years of service, or age 50 with 20 years of service, or at any
age with 30 years of service. Only service performed in a position as a police officer or firefighter
may be counted towards eligibility for retirement as Police/Fire accredited service.
55

RENO-TAHOE AIRPORT AUTHORITY
NOTES TO FINANCIAL STATEMENTS
JUNE 30, 2022
The normal ceiling limitation on monthly benefit allowances is 75% of average compensation.
However, a member who has an effective date of membership before July 1, 1985, is entitled to a
benefit of up to 90% of average compensation. Both Regular and Police/Fire members become fully
vested as to benefits upon completion of five years of service.
D. Member Contributions
The authorit
y for establishing and amending the obligation, to make contributions and member
contribution rates, is set by NRS. New hires, in agencies which did not elect the Employer-Pay
Contribution (EPC) plan, prior to July 1, 1983, have the option of selecting one of two contribution
plans. One plan provides for matching employee and employer contributions, while the other plan
provides for employer-pay contributions only.
Under the matching Employee/Employer Contribution plan a member may, upon termination of
service for which contribution is required, withdraw employee contributions which have been credited
to their account. All membership rights and active service credit in the System are canceled upon
withdrawal of contributions from the member’s account. If EPC was elected, the member cannot
convert to the Employee/Employer Contribution plan.
E.
Termination
Upon termination or
partial termination of the System, all accrued benefits that are funded become
100% vested and non-forfeitable.
F. Pension Liabilities, Pension Expense, Deferred Outflows of Resources, and Defe
rred Inflows of
Resources Related to Pensions
Based on a
Schedule of Employer Allocations, Schedule of Pension Amounts by Employer and
Related Notes provided by PERS, RTAA reported the net pension liability, total deferred outflow of
resources, deferred inflows of resources, and pension expense as of June 30, 2021.
The RTAA’s proportional share reflects the actuarial valuation date as of June 30, 2021, per the PERS
Actuarial Reports. Due to the difference between the valuation date of the PERS Actuarial Reports
and payments made in advance of the RTAA’s reporting date, pension contributions are recognized
as a deferred outflow of resources.
As of June 30, 2022, RTAA is reporting a liability of $24,565,172 for its proportionate share of the
net pension liability. This represents a decrease of $14,016,576 as compared to $38,581,748 reported
as of June 30, 2021. The RTAA’s proportion of the net pension liability reflects the RTAA’s
contributions to the pension plan relative to the contributions of all participating entities.
At June 30, 2022, the RTAA’s proportion share of the net pension liability, based on the RTAA’s
contributions to the pension plan relative to the contribution of all participating entities, is 0.2694%
of the total. This compares to the prior year’s proportion share of 0.2770% of the total. For the year
ended June 30, 2022, RTAA recognized pension expense reduction of $3,606,759.
56

RENO-TAHOE AIRPORT AUTHORITY
NOTES TO FINANCIAL STATEMENTS
JUNE 30, 2022
Deferred Outflows and Inflows of Resources:
At June 30, 2022, RTAA reported deferred outflows of resources and deferred inflows of resources
related to pensions from the following sources:
The deferred outflows of resources of $2,819,460 relates to RTAA pension contributions made after
the measurement date of June 30, 2021, but before the end of the RTAA’s reporting period of June
30, 2022, will be recognized as a reduction of the net pension liability in the subsequent fiscal year
ending June 30, 2023.
Experience gains/losses and the impact of changes in actuarial assumptions, if any, are amortized over
the average remaining service life of the active and inactive System members at the beginning of the
fiscal year, which was 6.14 years. Investment gains and losses are amortized over a fixed five-year
period. Deferred outflows/ (inflows) related to pensions excluding pension contributions made
subsequent to the measurement date and the change in proportion and differences between actual
contributions and proportionate share contributions will be recognized as follows:
Deferred Outflows Deferred Inflows
of Resources of Resources
Difference between expected and actual experience 2,721,075$ 172,881$
Changes of assumptions 8,156,060 -
Net difference between projected and actual earnings on investments - 20,044,398
Change in proportion and contributions differences between
employer contributions and proportionate share of contributions 301,778 1,579,990
Contributions subsequent to measurement date 2,819,460 -
Total 13,998,373 21,797,269
Net Deferred
Year Ended Outflow/(Inflow)
June 30, of Resources
2023 (3,174,728)$
2024 (3,113,514)
2025 (3,239,215)
2026 (3,471,836)
2027 2,088,877
2028 292,060
Total (10,618,356)$
57

RENO-TAHOE AIRPORT AUTHORITY
NOTES TO FINANCIAL STATEMENTS
JUNE 30, 2022
Assumptions
The net pension liability reported as of June 30, 2021, was determined using the following
assumptions in the PERS Actuarial Reports, applied to all periods included in the measurement:
Inflation rate 2.50%
Productivit
y
p
a
y
increase 0.50%
Projected salary increases Regular: 4.20% to 9.10% depending on service
Police/Fire: 4.60% to 14.50% depending on service
Rates include inflation and
p
roductivit
y
increases
Investmen
t
rate of return 7.25%
Other Assumptions Same as those used in the June 30, 2021, funding actuarial
valuation.
The following actuarial assumptions determined the mortality rates:
Pre-
.
Retirement:
Pub-2010 General Employee Amount-Weighted Above-Median Mortality
Table (separate tables for males and females), projected generationally with
the two-dimensional mortality improvement scale MP-2020.
Healthy: Pub-2010 General Healthy Retiree Amount-Weighted Above-Median Mortality
Table (separate tables for males and females) with rates increased by 30% for
males and 15% for females, projected generationally with the two-dimensional
monthly improvement scale MP-2020.
For ages less than 50, mortality rates are based on the Pub-2010 General Employee
Amount-Weighted Above-Median Mortality Tables and the rates at age 50 from
the Pub-2010 General Healthy Retiree Amount-Weighted Above-Median
Mortality Tables.
Disabled: Pub-2010 Non-Safety Disabled Retiree Amount-Weighted Mortality Table (separate
tables for males and females) with rates increased by 20% for males and 15% for
females, projected generationally with the two-dimensional mortality improvement
scale MP- 2020.
Changes since measurement date: There were no changes between the measurement date of the
collective net pension liability and the employer's reporting date.
Assumed Asset Allocation
The PERS Board establishes the target asset allocations for the investment portfolio and the expected
real rates of return (expected returns, net of investment expenses and inflation) for each asset class.
The asset allocation is reviewed annually and is designed to meet the future risk and return needs of
the System. The following target asset allocation policy was adopted as of June 30, 2020.
58

RENO-TAHOE AIRPORT AUTHORITY
NOTES TO FINANCIAL STATEMENTS
JUNE 30, 2022
Asset
Class
Target
Allocation
Long-Term Geometric
Expected Real Rate of
Return*
U.S. Stocks 42% 5.50%
International Stocks 18% 5.50%
U.S Bonds 28% 0.75%
Private Markets 12% 6.65%
*The PERS’ long-term inflation assumption was 3.50%
G. Discount rate
The discount rate used in the PERS Actuarial Reports to measure the total pension liability is 7.25%.
The projection of cash flows used to determine the discount rate assumed the employee and employer
contributions will be made at the rate specified in statute. Based on those assumptions, the pension
plan’s fiduciary net position at June 30, 2021 was projected to be available to make all projected
future benefit payments for current active and inactive members. Therefore, the long-term expected
rate of return on pension plan investments was applied to all periods of projected benefit payments to
determine the total pension liability as of June 30, 2021.
H. Sensitivity of the Net Pension Liability to Changes in the Discount Rate
The following presents the RTAA’s net pension liability using the discount rate of 7.25%, as well as
what the RTAA net pension liability would be if it were calculated using a discount rate that is one-
percentage-point lower (6.25%) or one-percentage-point higher (8.25%) than the current rate:
10.
Capital Contributions
Certain expenses for airport capital improvements are significantly funded through the FAA’s AIP
program, with certain matching funds provided by RTAA either through internal funds or PFCs.
Capital improvements may also be funded by an agreement between RTAA and TSA.
Grants and related agreements for the acquisition and construction of land, property and certain types
of equipment are reported in the Statements of Revenues, Expenses and Changes in Net Position, after
non-operating revenue and expenses, as capital contributions.
The Authority recognized $27,680,873 from federal sources and $5,159 from other sources for the
year ended June 30, 2022.
1% Decrease Discount Rate 1% Increase
(6.25%) (7.25%) (8.25%)
RTAA's proportionate share
of the net pension liability 48,908,470 24,565,172 4,483,943
59

RENO-TAHOE AIRPORT AUTHORITY
NOTES TO FINANCIAL STATEMENTS
JUNE 30, 2022
11.
Commitments and Contingencies
RTAA has outstanding commitments for various construction projects. The following is a summary
of the more significant of these commitments at June 30, 2022:
Financial resources for these projects will come from FAA grants, PFC revenue, CFC revenue, the
General Purpose Fund, and Special Fund. In 2000, RTAA entered into a Consent Decree in the case
captioned “Nevada Division of Environmental Protection vs. United States of America et al.” The
Consent Decree, which relates to certain land located at the Reno-Stead Airport, requires those parties
identified to perform environmental investigation, monitoring, and remediation for any contamination
found. Other parties to this Consent Decree are the City of Reno, U.S. Department of Defense by and
through the U.S. Army Corps of Engineers and various Lear entities. These parties utilize an
allocation for costs to address the contamination as follows: U.S. Army Corps of Engineers 51%, City
of Reno 12%, Lear entities 18.5% and RTAA 18.5%.
Previously, U.S. Army Corps of Engineers paid $2.62 million to prefund these costs and the Lear
entities paid $1.57 million as a settlement to end participation. The bank balance of this fund is
$523,721 for year ended June 30, 2022.
During the 2011-2012 fiscal year, an updated study was completed, which identified additional
remediation costs of $5.48 million that would be required over the next 23 years. Based on the 18.5%
share allocated to RTAA, additional expense and a related liability of $474,912 was recorded and
$475,000 was added to the fund for the RTAA share. The reclamation liability at June 30, 2022, is
$564,844.
RTAA may be a defendant in certain litigation arising out of the normal operation and ownership of
the Airports. RTAA management and legal counsel estimate that the potential claims against RTAA
will not materially affect the financial statements.
12.
Risk Management
RTAA is exposed to various risks of loss related to theft of, damage to and destruction of assets,
police and public official liability, injuries to employees and customers, and natural disasters. These
risks are covered by commercial insurance purchased from independent third parties. RTAA also
provides employees with health, dental, vision, and prescription benefits. These benefits (except
vision and dental which are self-funded) are covered by commercial insurance purchased from
independent third parties. Settled claims from these risks have not exceeded commercial insurance
coverage for the past three years.
Airfield 4,353,832$
Terminal 2,425,007
Landside 7,649,879
Reno-Stead Airport 3,180,489
Other 854,610
Total outstanding commitments 18,463,817$
60

RENO-TAHOE AIRPORT AUTHORITY
NOTES TO FINANCIAL STATEMENTS
JUNE 30, 2022
13.
Other Postemployment Benefits (OPEB)
The RTAA provides other postemployment benefits for eligible retirees through one plan: State of
Nevada’s Public Employees Benefits Program (PEBP) if retired prior to September 1, 2008. This plan
provides medical benefits to eligible RTAA retirees and beneficiaries.
Plan Description and Eligibility: For employees who retired prior to September 1, 2008, NRS 287.023
allows retired employees of governmental entities within the State of Nevada to join the state’s PEBP,
an agent multiple- employer defined benefit OPEB plan administered by a nine-member governing
board. PEBP provides medical, prescription, vision, life, and accident insurance, and dental for
retirees. Retirees can choose between a self-funded Preferred Provider Organization (PPO) and a
Health Maintenance Organization (HMO) plan. RTAA makes contributions as outlined below under
the section titled “Funding Policy” and retirees are responsible for payment of unsubsidized
premiums. The plan is not accounted for as a trust fund, as an irrevocable trust has not been established
to account for the plan, and no financial reports are issued.
Eligibility and subsidy requirements are governed by statutes of the State of Nevada and can only be
amended through legislation. The statutes were revised with an effective date of November 30, 2008,
to create new participation limitations so that only active members of PEBP can elect coverage after
retirement. As a result, no employees retiring from RTAA on or after September 1, 2008, are eligible
to participate in this plan as a retiree at the RTAA’s expense.
Funding Policy: RTAA is required to provide a subsidy to the plan of each retiree that has joined the
PEBP. Contribution requirements for plan members and the participating employers are assessed by
the PEBP Board annually. The contributions required for PEBP subsidies depends on the date of
retirement, prior years of PERS service former employees earned while working for RTAA, and
number of qualifying employers. The subsidies are determined by years of service and range from a
minimum of $3 to a maximum of $1,526 per month for the year ended June 30, 2022. Subsidies for
retiree premiums are paid directly to the State PEBP when due.
The RTAA’s obligation for subsidies is limited to payment of the statutorily required contribution.
The current year contribution to PEBP was $127,166 for 34 retirees, which equaled the required
contribution. As of June 30, 2022, the plan was funded on a “pay as you go” basis and no contribution
was made to fund the actuarial determined liability.
Actuarial assumptions and other inputs: The total OPEB liability in the June 30, 2020, actuarial
valuation was determined using the following actuarial assumptions and other inputs. Applied to all
periods included in the measurement, unless otherwise specified:
Valuation Date June 30, 2020
Measurement Date June 30, 2021
Fundin
g
Method Entr
y
A
g
e Normal Cost, level
p
ercen
t
of
p
a
y
Asset Valuation Method ($0; no OPEB trust has been established)
Discount Rate 2.21% as of June 30, 2020
2.16% as of June 30
,
2021
Partici
p
ants Valued Onl
y
curren
t
PEBP Retirees
Salar
y
Increase No
t
a
pp
licable; no active em
p
lo
y
ees in
p
lan
General Inflation Rate 2.5%
p
e
r
y
ea
r
61

RENO-TAHOE AIRPORT AUTHORITY
NOTES TO FINANCIAL STATEMENTS
JUNE 30, 2022
Changes in the Total OPEB Liability: The total OPEB liability at June 30, 2022, was calculated as
follows:
Sensitivity of Liabilities to Changes in the Discount Rate and Healthcare Cost Trend Rate: The discount
rate used for the fiscal year ending June 30, 2021, is 2.21%. Healthcare cost trend rate prior to eligibility
for Medicare was assumed to start at 5.8% (increase effective January 1, 2021) and fluctuate down to
the ultimate rate of 4.0% by year 2076; medical cost inflation for those covered by Medicare. The
impact of a 1% increase or decrease in these assumptions is shown in the chart below.
OPEB Liability at June 30, 2021 1,995,373$
Changes for the year:
Interest cost 42,867
Assumption changes 12,293
Benefit payments (111,412)
OPEB Liability at June 30, 2022 1,939,121$
Mortality The basic mortality rates used in this valuation are based on
the published report of
the Nevada Public Employees
Retirement System, dated June 30,
2019.
Non-disabled life rates for Regular employees:
Males and Females: Headcount-Weighted RP-2014 Healthy
Disabled life rates for Regular & Safety employees:
Males and Females: Headcount-Weighted RP-2014 Disabled
Retiree Table, set forward 4 years
Medicare Eligibility Absent contrary data, all individuals are assumed to be eligible
for
Medicare Parts A and B at 65. Retirees over age 65 who
are no
t
eli
g
ible fo
r
Medicare are assumed to remain ineli
g
ible.
Participation Rate All retirees currently covered by PEBP are assumed to retain
thei
r
existin
g
election until death.
Healthcare Trend
RTAA’s subsidy toward the cost of PEBP retiree coverage is
assumed to increase at the following rates:
Effective
July 1
Premium
Increase
2021
5.8%
2022
5.7%
2023
5.6%
2024
5.5%
2024 - 2026
5.4%
2027 - 2029
2030 - 2051
5.3%
5.2%
62

RENO-TAHOE AIRPORT AUTHORITY
NOTES TO FINANCIAL STATEMENTS
JUNE 30, 2022
OPEB Expense, Deferred Outflows of Resources, and Deferred Inflows of Resources Related to
OPEB:
The deferred outflow of resources of $127,166 relates to RTAA’s OPEB contributions made after the
measurement date of June 30, 2021, but before the end of the RTAA’s reporting period of June 30,
2022.
14.
Post-Employment Health Plan (PEHP) – Defined Contribution Plan
Plan Description and Eligibility: RTAA established the Post Employment Health Plan, pursuant to
Section 501(C) (9) of the Internal Revenue Code permitting such plans. The plan is administrated by
Nationwide Retirement Solutions. The purpose of the plan is to provide for reimbursement of
qualified post-employment expenses for medical care, including expenses for medical insurance,
incurred by employees covered by RTAA and who have separated from service.
Funding Policy: The plan provides employees, subject to Management Guidelines, Civil Service Plan,
or the collective bargaining agreement with the RTAA Police Officers Association, an individual
account for post-employment health benefits. The funding of the employees subject to Management
Guidelines and Civil Service Plan is as follows:
A. Each July 1, RTAA shall contribute the amount of accrued sick leave as of the last pay
period in June into the employee’s individual PEHP plan account at 100% of the
employee’s
base rate of pay.
Change in 1% Decrease Discount Rate 1% Increase
Discount Rate (1.16%) (2.16%) (3.16%)
Incre ase in Lia bility 2,212,971 1,939,121 1,715,075
Change in Healthcare
Cost Trend Rate 1% Decrease Current Trend 1% Increase
Incre ase in Lia bility 1,723,190 1,939,121 2,197,422
Deferred Outflows Deferred Inflows
of Resources of Resources
Contributions subsequent to measurement date 127,166 -
Total 127,166 -
63

RENO-TAHOE AIRPORT AUTHORITY
NOTES TO FINANCIAL STATEMENTS
JUNE 30, 2022
All contributions will be made on a pre-tax basis as follows:
Sick Leave Balance Amount of Sick Leave Contributed
to Em
p
lo
y
ee’s PEHP Accoun
t
100-199 hours 5 hours
200-299 hours 10 hours
300-399 hours 25 hours
400-499 hours 35 hours
500-599 hours 50 hours
600-699 hours 65 hours
700-799 hours 80 hours
800-899 hours 95 hours
900-999 hours 110 hours
1000 or more hours 150 hours
Each July 1
for those employees with accrued vacation leave balances greater than two hundred
(200) hours as of the last pay period in June, RTAA shall contribute 20 hours from
each
employee’s accrued vacation account into the employee’s individual PEHP plan account at
100%
of the employee’s base rate of pay on June 30. All contributions will be made on a pre-tax basis.
B. Each July 1
for those employees that have not used the Floating Holiday as of the last
pay
period in June, RTAA will convert the Floating Holiday hours at the employee’s base
rate of
pay on June 30
and contribute those funds to the employee’s individual PEHP plan
account. All
contributions will be made on a pre-tax basis.
For the year ended June 30, 2022, $224,590 was contributed to the PEHP plan.
The plan for employees covered by the collective bargaining agreement with the RTAA
Police
Officers Association is funded under the following provisions:
A.
Upon the plan’s inception, RTAA contributed a one-time lump sum payment in the amount
of $900 into the plan for each officer.
B.
Each pay period, $31 of each member’s salary will be put into their plan account.
C.
Once a member has accumulated eighty (80) hours of compensatory time, RTAA shall
contribute 100% of that member’s compensatory time in excess of eighty (80) hours into
their
plan account at 100% of their base pay.
D.
On the first pay period each December, RTAA shall contribute forty (40) hours of each
member’s accrued vacation time into their plan account at 100% of their base pay, provided
such
contribution does not reduce the member’s vacation accrual balance to less than
200 hours.
For the year ended June 30, 2022, $13,335 was contributed to the RTAA Police Officers
Association
plan.
64

RENO-TAHOE AIRPORT AUTHORITY
NOTES TO FINANCIAL STATEMENTS
JUNE 30, 2022
The plan for employees covered by the collective bargaining agreement with the RTAA
Reno Airport Fire Fighters Association is funded under the following provisions:
A.
Effective October 1, 2017 – June 30, 2022, the employer will contribute $92.31 each pay
period
(26 pay periods per year) into each employee’s individual plan account.
B.
An amount equal to $60.00 of each employee’s salary per pay period (26 pay periods per
year)
shall be contributed into his/her plan account.
C.
If an employee has greater than 116 hours of compensatory time as of the last pay period
of any
fiscal year (prior to any roll-over of hours), the employer shall contribute 20
hours of that
employee’s compensatory time into their plan account at 100% of their base
pay.
D.
If an employee has greater than 200 hours of vacation accrual as of the last pay period
of any
fiscal year, the employer shall contribute 20 hours of that employee’s vacation
accrual into their
plan account at 100% of their base pay.
E.
If an employee has not used his/her floating holiday as of the last pay period of any fiscal
year,
the employer shall contribute that employee’s floating holiday (12 hours) into their
plan account
at 100% of their base pay.
F.
If an employee with the indicated years of service has greater than 600 hours of sick accrual
as
of the last pay period of any fiscal year, the employer shall contribute 20 hours of that
employee’s sick accrual into their plan account at the indicated percentage of their base pay:
Years of Service % of Base Pay
5
b
u
t
less than 10 12.5%
10
b
u
t
less than 20 25%
20 o
r
more 50%
For the year ended June 30, 2022, $90,026 was contributed to the Reno Airport Fire
Fighters
Association plan.
15.
Subsequent Events
Management of the Authority has evaluated events and transactions occurring after June 30, 2022,
through the date the financial statements were available for issuance for recognition and/or disclosure
in the financial statements.
On August 3, 2022, RTAA entered into a Non-Revolving Agreement with Wells Fargo Bank,
National Association in an aggregate principal amount not to exceed $50,000,000 for certain capital
improvements. No material draws have been made other than for debt issuance fees.
65
REQUIRED
SUPPLEMENTARY
INFORMATION

RENO-TAHOE AIRPORT AUTHORITY
SCHEDULE OF CHANGES IN THE AUTHORITY'S TOTAL OPEB LIABILITY
AND RELATED RATIOS
2022 2021 2020 2019 2018
Total OPEB Liability
Service Cost - - - - -
Interest Cost 42,867$ 55,995$ 61,637$ 59,099$ 53,980$
Changes of Benefit Terms (a) - - - (22,397) -
Differences between expected and actual experience - 38,657 - (42,484) -
Assumption Changes 12,293 363,229 71,227 18,135 (129,137)
Benefit Payments (111,412) (115,638) (128,486) (120,364) (124,223)
Net change in total OPEB liability (56,252) 342,243 4,378 (108,011) (199,380)
Total OPEB Liability - beginning 1,995,373 1,653,130 1,648,752 1,756,763 1,956,143
Total OPEB Liability - ending 1,939,121$ 1,995,373$ 1,653,130$ 1,648,752$ 1,756,763$
RTAA's Covered Payroll (b) -$ -$ -$ -$ -$
(a) Subsequent to fiscal year end 2019 the RTAA Group Health Plan no longer had retirees.
(b) The Public Employee Benefit Program is a closed plan; and therefore, there are no current covered employees.
(c) There are no assets accumulated in a trust to pay related benefits
This schedule is presented to illustrate the requirement to show information for 10 years. However until
a full 10-year trend is compiled, the RTAA is presenting information for those years for which
information is available.
66

RENO-TAHOE AIRPORT AUTHORITY
SCHEDULE OF THE AUTHORITY'S PROPORTIONATE SHARE
OF THE NET PENSION LIABILITY
2022
(b)
2021
(b)
2020
(b)
2019
(b)
2018
(b)
2017
(b)
2016
(b)
2015
(b)
RTAA's proportion of the net pension liability 0.2694% 0.2770% 0.2795% 0.2774% 0.2867% 0.2810% 0.2846% 0.2800%
RTAA's proportionate share of the net
pension liability $24,565,172 $38,581,748 $38,109,676 $37,835,366 $38,129,158 $37,811,756 $32,609,501 $29,388,235
RTAA's covered payroll $17,749,645 $18,298,781 $17,709,373 $17,204,432 $17,041,362 $15,831,440 $15,511,214 $15,137,166
RTAA's proportion of the net pension liability
as a percentageof its covered payroll 138.40% 210.84% 215.19% 219.92% 223.74% 238.84% 210.23% 194.15%
Plan fiduciary net position as a percentage
of the total pension liability 86.5% 77.04% 76.46% 75.2% 74.4% 72.2% 75.1% 76.3%
(a) This schedule is presented to illustrate the requirement to show information for 10 years. However until a full 10-year trend is compiled, the Authority is
presenting information for those years for which information is available.
(b) Actuarial Studies used to calculate total and RTAA net pension liability are completed as of June 30th in the previous fiscal year. Covered payroll also
reflects the previous year to match the liability.
67

RENO-TAHOE AIRPORT AUTHORITY
SCHEDULE OF THE AUTHORITY'S CONTRIBUTIONS
2022 2021 2020 2019 2018 2017 2016 2015
Statutorily required contribution 6,193,630 5,675,385 5,771,419 5,383,749 5,149,826 5,146,592 4,742,955 4,392,386
Contributions in relation to the statutorily
required contribution 6,193,630 5,675,385 5,771,419 5,383,749 5,149,826 5,146,592 4,742,955 4,392,386
Annual contribution deficiency (excess) - - - - - - - -
Percent funded 100% 100% 100% 100% 100% 100% 100% 100%
Authority's covered payroll 19,053,901 17,749,645 18,298,781 17,709,373 17,204,432 17,041,362 15,831,440 15,511,214
Contributions as a percentage of covered
payroll
32.51% 31.97% 31.54% 30.40% 29.93% 30.20% 29.96% 28.32%
This schedule is presented to illustrate the requirement to show information for 10 years. However until a full 10-year trend is compiled, the RTAA is presenting
information for those years for which information is available.
Note: Amounts reported above for statutorily required contributions include employer and employee contributions made to the Plan. RTAA contributes the
employees' share on their behalf.
68
OTHER
SUPPLEMENTARY
INFORMATION

RENO-TAHOE AIRPORT AUTHORITY
SCHEDULE OF REVENUES AND EXPENSES
COMPARISON OF BUDGET TO ACTUAL
JUNE 30, 2022
Original
Budget
Final
Amended
Budget Actual
Variance To
Final Budget
Operating revenues:
Landing fees 9,553,953$ 9,553,953$ 10,584,517$ 1,030,564$
Concession revenue 10,592,343 10,592,343 15,257,011 4,664,668
Parking and ground transportation 8,853,300 8,853,300 14,004,587 5,151,287
Rentals 16,792,796 16,792,796 15,073,833 (1,718,963)
Reimbursements for services 2,194,932 2,194,932 3,000,059 805,127
Other revenue 93,900 93,900 145,174 51,274
Total Operating Revenues 48,081,224 48,081,224 58,065,181 9,983,957
Operating expenses:
Employee wages and benefits 32,939,635 32,939,635 30,348,607 2,591,028
Utilities and communications 2,848,730 2,848,730 3,156,581 (307,851)
Purchase of services 8,011,140 8,011,140 7,405,170 605,970
Materials and supplies 2,353,834 2,353,834 2,575,145 (221,311)
Administrative expenses 3,778,287 3,778,287 2,854,518 923,769
Total Operating Expenses before
Depreciation and Amortization
49,931,626 49,931,626 46,340,021 3,591,605
Depreciation and amortization 30,000,000 30,000,000 25,079,112 4,920,888
Total Operating Expenses 79,931,626 79,931,626 71,419,133 8,512,493
Operating Income (Loss) (31,850,402) (31,850,402) (13,353,952) 18,496,450
Non-operating revenues (expenses):
Interest income 708,000 708,000 (1,491,248) (2,199,248)
Passenger facility charge revenue 5,653,900 5,653,900 8,502,997 2,849,097
Customer facility charge revenue
5,693,000 5,693,000 6,350,891 657,891
Jet fuel tax revenue 213,700 213,700 294,018 80,318
Gain (loss) on sale of capital assets - - 15,080 15,080
Federal grant revenue 11,745,950 11,745,950 14,483,077 2,737,127
Interest expense (285,450) (285,450) (399,857) (114,407)
Total Non-Operating Revenues
(Expenses) 23,729,100 23,729,100 27,754,958 4,025,858
Income (Loss) Before Capital Contribution (8,121,302)$ (8,121,302)$ 14,401,006$ 22,522,308$
69

Statistical
Section

STATISTICAL SECTION EXPLANATIONS
This part of the RTAA’s comprehensive annual financial report presents detailed
information as a context for understanding what the information in the financial statements,
note disclosures, and required supplementary information says about the Authority’s
overall financial health.
Contents
Financial Trends
These schedules contain trend information to help the reader understand
how the Authority’s financial performance and well-being have changed
over time.
Revenue Capacity
These schedules contain information to assist the reader in understanding
and assessing the factors affecting the Authority’s ability to generate
revenues.
Debt Capacity
These schedules present information to help the reader assess the
affordability of the Authority’s current levels of outstanding debt and the
Authority’s ability to issue additional debt in the future.
Demographic and Economic Information
These schedules offer demographic and economic indicators to help the
reader understand the environment within which the Authority’s financial
activities take place.
Operation Information
These schedules contain service data to help the reader understand how the
information in the Authority’s financial report relates to the services the
Authority provides and the activities it performs.
Sources: Unless otherwise noted, the information in these schedules is derived from the
comprehensive annual financial report for the relevant year.
70

2013 2014 2015 2016 2017
Operating revenues
Landing fees $7,380,804 $7,440,496 $7,916,995 $8,071,097 $8,285,922
Concession revenue 10,478,433 10,301,098 10,344,733 10,861,366 11,798,086
Parking and ground transportation 8,914,030 8,983,926 9,515,946 10,519,785 11,316,885
Rentals 11,967,776 13,282,322 13,456,901 13,599,106 13,688,849
Reimbursements for services 2,579,738 2,632,002 2,647,105 2,419,689 2,531,223
Other revenue 92,093 34,596 106,844 42,873 168,024
Total operating revenues 41,412,874 42,674,440 43,988,524 45,513,916 47,788,989
Nonoperating revenues
Interest income 76,298 195,296 289,755 716,702 577,434
Gain (Loss) on value of investments (8,517) 93,985 (3,274) (21,981) (271,937)
Passenger facility charge revenue 6,453,403 6,601,269 6,332,093 6,740,165 7,480,732
Customer facility charge revenue 1,088,981 1,263,517 1,252,480 1,385,061 1,481,004
Jet fuel tax income 276,338 264,586 246,059 268,287 298,124
Gain on sale of capital assets 32,003 5,631 29,533 105,471 13,298
Misc. Revenue - - - - -
Total nonoperating revenues 7,918,506 8,424,284 8,146,646 9,193,705 9,578,655
Total revenues 49,331,380 51,098,724 52,135,170 54,707,621 57,367,644
Operating expense
Employee wages and benefits 23,255,693 24,301,598 24,638,525 25,007,616 26,672,375
Utilities and communications 2,559,355 2,774,328
2,757,835
2,540,504 2,337,577
Purchase of services 4,588,047 4,770,478 4,763,544 4,803,679 4,595,802
Materials and supplies 1,850,565 1,749,084 1,582,278 1,821,369 1,753,352
Administrative expenses 2,273,581 2,563,199 2,113,887 2,443,771 2,579,040
34,527,241 36,158,687 35,856,069 36,616,939
37,938,146
Depreciation and amortization 33,189,676 35,816,772 34,958,476 34,613,731 34,462,715
Total operating expenses 67,716,917 71,975,459 70,814,545 71,230,670 72,400,861
Nonoperating expenses
Non-operating expense - - - 140,952 7,814
Interest expens
e
1,460,898 1,545,697 1,376,012 1,284,053 616,855
Total nonoperating expenses 1,460,898 1,545,697 1,376,012 1,425,005 624,669
Total expenses 69,177,815 73,521,156 72,190,557 72,655,675 73,025,530
Capital contributions 14,651,900 12,210,737 4,867,414 10,010,497 2,517,123
Change in Net Position ($5,194,535) ($10,211,695) ($15,187,973) ($7,937,557) ($13,140,763)
Net Position at Year-End
Net Investment in capital assets
$412,444,732 $395,050,506 $382,231,061 $367,749,013 $345,904,676
Restricted 14,720,733 22,897,188 22,459,489 20,371,555 23,692,496
Unrestricted 38,426,126 37,432,202 2,670,101 11,302,526 16,685,159
Total Net Position $465,591,591 $455,379,896 $407,360,651 $399,423,094 $386,282,331
Continued
RENO-TAHOE AIRPORT AUTHORITY
NET POSITION AND CHANGES IN NET POSITION
FOR THE YEARS ENDED JUNE 30, 2013 - 2022
(unaudited)
71

2018 2019 2020 2021 2022
Operating revenues
Landing fees $9,397,172 $9,719,482 $10,077,732 $8,948,847 $10,584,517
Concession revenue 12,802,725 13,086,886 11,301,837 9,628,195 15,257,011
Parking and ground transportation 12,009,701 12,817,675 10,012,455 7,361,177 14,004,587
Rentals 13,838,446 14,078,153 16,534,688 15,715,644 15,073,157
Reimbursements for services 2,416,793 2,671,073 2,397,717 1,823,280 3,000,059
Other revenue 190,432 176,468 345,296 185,773 145,174
Total operating revenues 50,655,269 52,549,737 50,669,725 43,662,916 58,064,505
Nonoperating revenues
Interest income 835,868 1,301,531 1,588,183 886,650 1,247,655
Gain (Loss) on value of investments (374,498) 867,298 736,237 (935,537) (2,737,875)
Passenger facility charge revenue 7,587,771 8,443,673 7,607,924 4,514,399 8,502,997
Customer facility charge revenue 1,692,038 4,613,478 4,891,406 4,954,128 6,350,891
Jet fuel tax income 310,500 306,035 263,135 203,765 294,018
Gain on sale of capital assets 169,208 25,070 28,196 41,838 15,080
Misc Revenue - - 617,197 7,059,146 14,483,077
Total nonoperating revenues 10,220,887 15,557,085 15,732,278 16,724,389 28,155,843
Total revenues 60,876,156 68,106,822 66,402,003 60,387,305 86,220,348
Operating expense
Employee wages and benefits 31,878,959 29,334,325 32,120,112 30,923,994 30,348,607
Utilities and communications 2,709,495 2,772,620
2,881,068
2,454,099 3,156,581
Purchase of services 4,866,467 5,521,530 5,418,705 4,887,352 7,405,170
Materials and supplies 2,050,694 2,045,295 2,340,685 2,259,926 2,575,145
Administrative expenses 2,224,655 2,646,733 2,431,355 2,086,926 2,854,518
43,730,270 42,320,503 45,191,925 42,612,297
46,340,021
Depreciation and amortization 31,094,092 27,801,203 27,608,618 26,827,690 25,079,112
Total operating expenses 74,824,362 70,121,706 72,800,543 69,439,987 71,419,133
Nonoperating expenses
Non-operating expense - - - - -
Interest expens
e
487,308 438,892 389,125 337,975 399,857
Total nonoperating expenses 487,308 438,892 389,125 337,975 399,857
Total expenses 75,311,670 70,560,598 73,189,668 69,777,962 71,818,990
Capital contributions 9,200,524 14,057,725 16,868,554 25,193,485 27,686,032
Change in Net Position ($5,234,990) $11,603,949 $10,080,889 $15,802,828 $42,087,390
Net Position at Year-End
Net Investment in capital assets
$334,863,315 $336,079,326 $348,801,466 $361,855,033 $388,632,933
Restricted 26,448,099 32,997,130 28,598,653 25,980,476 28,495,282
Unrestricted 18,238,659 22,077,566 23,834,792 29,202,230 41,996,914
Total Net Position $379,550,073 $391,154,022 $401,234,911 $417,037,739 $459,125,129
NET POSITION AND CHANGES IN NET POSITION
RENO-TAHOE AIRPORT AUTHORITY
FOR THE YEARS ENDED JUNE 30, 2013 - 2022
(unaudited)
72

2013 2014 2015 2016 2017
Operating Revenues $41,412,874 $42,674,440 $43,988,524 $45,513,916 $47,788,989
Operating Expenses (34,527,241) (36,158,687) (35,856,069) (36,616,939) (37,938,146)
Operating Income before
Depreciation and Amortization 6,885,633 6,515,753 8,132,455 8,896,977 9,850,843
Depreciation and Amortization (33,189,676) (35,816,772) (34,958,476) (34,613,731) (34,462,715)
Operating Income (Loss) (26,304,043) (29,301,019) (26,826,021) (25,716,754) (24,611,872)
Nonoperating Revenues and
(Expenses):
Interest Income 76,298 195,296 289,755 716,702 577,434
Gain (Loss) on value of Investments (8,517) 93,985 (3,274) (21,981) (271,937)
PFC Revenue 6,453,403 6,601,269 6,332,093 6,740,165 7,480,732
CFC Revenue 1,088,981 1,263,517 1,252,480 1,385,061 1,481,004
Jet Fuel Tax Revenue 276,338 264,586 246,059 268,287 298,124
Interest Expense (1,460,898) (1,545,697) (1,376,012) (1,284,053) (616,855)
Gain (Loss) on Sale of Capital Asset
s
32,003 5,631 29,533 105,471 13,298
Non-operating expenses
- - - (140,952) (7,814)
6,457,608 6,878,587 6,770,634 7,768,700 8,953,986
Income (Loss) Before
Capital Contributions ($19,846,435) ($22,422,432) ($20,055,387) ($17,948,054) ($15,657,886)
Continued
Note: Years
p
rior to 2015 have not been ad
j
usted for GASB 68 to 75
RENO-TAHOE AIRPORT AUTHORITY
SUMMARY OF OPERATING RESULTS
FOR THE YEARS ENDED JUNE 30, 2013 - 2022
(unaudited)
73

2018 2019 2020 2021 2022
Operating Revenues $50,655,269 $52,549,737 $50,669,725 $43,662,916 $58,064,505
Operating Expenses (43,730,270) (42,320,503) (45,191,925) (42,612,297) (46,340,021)
Operating Income before
Depreciation and Amortization 6,924,999 10,229,234 5,477,800 1,050,619 11,724,484
Depreciation and Amortization (31,094,092) (27,801,203) (27,608,618) (26,827,690) (25,079,112)
Operating Income (Loss) (24,169,093) (17,571,969) (22,130,818) (25,777,071) (13,354,628)
Nonoperating Revenues and
(Expenses):
Interest Income 835,868 1,301,531 1,588,183 886,650 1,247,655
Gain (Loss) on value of Investments (374,498) 867,298 736,237 (935,537) (2,737,875)
PFC Revenue 7,587,771 8,443,673 7,607,924 4,514,399 8,502,997
CFC Revenue 1,692,038 4,613,478 4,891,406 4,954,128 6,350,891
Jet Fuel Tax Revenue 310,500 306,035 263,135 203,765 294,018
Interest Expense (487,308) (438,892) (389,125) (337,975) (399,857)
Gain (Loss) on Sale of Capital Asset
s
169,208 25,070 28,196 41,838 15,080
Non-operating expenses
- - 617,197 7,059,146
14,483,077
9,733,579 15,118,193 15,343,153 16,386,414 27,755,986
Income (Loss) Before
Capital Contributions ($14,435,514) ($2,453,776) ($6,787,665) ($9,390,657) $14,401,358
Note: Years
p
rior to 2015 have not been ad
j
usted for GASB 68 to 75
RENO-TAHOE AIRPORT AUTHORITY
SUMMARY OF OPERATING RESULTS
FOR THE YEARS ENDED JUNE 30, 2013 - 2022
(unaudited)
74

2013 2014 2015 2016 2017
Airlines - Landing Fees Only
Alaska/Horizon 290,576$ 341,556$ 580,120$ 623,357$ 642,969$
American Airlines 533,388 592,839 715,170 1,308,569 1,125,206
Delta 416,790 406,794 455,739 426,813 433,298
Fed Ex 585,585 782,244 888,324 968,838 932,842
Jet Blue - - 11,198 13,515 238,725
Southwest 3,068,489 2,751,016 2,642,052 2,576,418 2,699,800
United 613,229 657,735 720,757 724,254 701,646
UPS 440,067 451,188 518,289 660,717 654,977
US Airways 475,990 542,374 608,778 - -
Total: 6,424,114$ 6,525,746$ 7,140,427$ 7,302,481$ 7,429,463$
Rental Cars - Concession Leases Only
Advantage 252,957$ 229,167$ -$ -$ -$
Avis/Budget 1,518,405 1,493,707 1,482,869 1,620,958 1,777,825
Alamo/ National 923,862 1,026,907 1,269,575 1,411,955 1,554,676
Dollar/Thrifty 881,351 840,070 805,775 757,453 750,745
Enterprise 929,817 879,344 806,729 978,067 1,183,386
Payless - 20,833 320,499 314,189 317,940
Hertz 1,455,966 1,421,777 1,375,025 1,506,355 1,606,381
Total: 5,962,358$ 5,911,805$ 6,060,472$ 6,588,977$ 7,190,953$
Other Concession Leases
IGT 1,697,814$ 1,322,752$ 1,266,307$ 1,071,402$ 974,166$
Paradies Gift Shops 705,250 901,000 901,000 944,071 1,016,968
SSP America, Inc. 835,653 929,240 887,963 992,984 1,221,761
Vino Volo - - - - -
Younger Agency Advertising 757,754 670,850 - - -
Clear Channel - - 640,403 564,210 663,436
Lamar Advertising - - - - -
Forever Heather 41,865 65,531 43,819 34,855 29,462
Total: 4,038,336$ 3,889,373$ 3,739,492$ 3,607,522$ 3,905,792$
Parking and Ground Transportation 8,914,030$ 8,983,926$ 9,515,946$ 10,519,785$ 11,316,885$
Total: 25,338,838$ 25,310,850$ 26,456,337$ 28,018,765$ 29,843,093$
Continued
Note: Each year the RTAA reports the largest tennent revenue payors.
RENO-TAHOE AIRPORT AUTHORITY
PRINCIPAL REVENUE PAYERS
FOR THE YEARS ENDED JUNE 30, 2013-2022
(unaudited)
75

2018 2019 2020 2021 2022
Airlines - Landing Fees Only
Alaska/Horizon 638,296$ 745,193$ 711,620$ 553,909$ 691,885$
American Airlines 1,253,063 1,313,727 1,331,551 1,079,312 1,275,569
Delta 507,079 566,983 534,997 779,290 775,125
Fed Ex 716,310 878,731 882,829 918,027 931,954
Jet Blue 281,464 281,296 226,627 107,869 259,437
Southwest 3,188,270 3,305,577 2,854,752 2,023,722 2,847,213
United 919,786 1,111,373 1,026,505 779,167 1,022,320
UPS 707,324 903,450 1,023,053 1,012,983 958,933
US Airways - - - - -
Total: 8,211,592$ 9,106,330$ 8,591,934$ 7,254,279$ 8,762,436$
Rental Cars - Concession Leases Only
Advantage -$ -$ -$ -$ -$
Avis/Budget 1,993,895 2,061,629 1,951,327 1,594,094 3,220,871
Alamo/ National 1,720,779 1,840,898 1,826,983 1,394,229 1,968,634
Dollar/Thrifty 920,885 1,038,332 1,055,493 725,000 1,038,391
Enterprise 1,360,048 1,448,153 1,430,990 1,427,003 1,951,129
Payless 286,503 340,580 301,284 250,000 250,000
Hertz 1,781,205 1,859,856 1,817,455 1,364,100 1,726,818
Total: 8,063,315$ 8,589,448$ 8,383,532$ 6,754,426$ 10,155,843$
Other Concession Leases
IGT 1,102,412$ 1,149,390$ 851,669$ 666,127$ 1,256,202$
Paradies Gift Shops 1,014,199 1,138,086 1,091,785 553,978 859,653
SSP America, Inc. 1,484,628 1,527,992 1,161,992 558,358 1,065,958
Vino Volo - 105,361 152,716 204,730 291,232
Younger Agency Advertising - - - - -
Clear Channel 699,857 768,828 828,974 647,686 458,599
Lamar Advertising - - - - 251,931
Forever Heather 35,958 - - - -
Total: 4,337,054$ 4,689,657$ 4,087,136$ 2,630,879$ 4,183,575$
Parking and Ground Transportation 12,009,701$ 12,817,675$ 10,012,455$ 7,361,177$ 14,004,586$
Total: 32,621,662$ 35,203,110$ 31,075,057$ 24,000,761$ 37,106,440$
(unaudited)
RENO-TAHOE AIRPORT AUTHORITY
PRINCIPAL REVENUE PAYERS
FOR THE YEARS ENDED JUNE 30, 2013-2022
76

2013 2014 2015 2016 2017
Landing fees 7,380,804$ 7,440,496$ 7,916,995$ 8,071,097$ 8,285,922$
Concession revenue 10,478,433 10,301,098 10,344,733 10,861,366 11,798,086
Parking and ground
transportation
8,914,030 8,983,926 9,515,946 10,519,785 11,316,885
Rentals 11,967,776 13,282,322 13,456,901 13,599,106 13,688,849
Reimbrusement for
Services
2,579,738 2,632,003 2,647,105 2,419,689 2,531,223
Toal Operating
Revenue
41,320,781 42,639,845 43,881,680 45,471,043 47,620,965
Interest Income 67,781 289,281 286,481 694,721 305,497
Total 41,388,562$ 42,929,126$ 44,168,161$ 46,165,764$ 47,926,462$
Continued
Note: Top revenue sources per the Statements of Revenues, Expenses and changes in net Position for the current
year including interest income and excluding other revenue.
RENO-TAHOE AIRPORT AUTHORITY
PRINCIPAL OPERATING REVENUE SOURCES
FOR THE YEARS ENDED JUNE 30, 2013-2022
(unaudited)
77

2018 2019 2020 2021 2022
Landing fees 9,397,172$ 9,719,482$ 10,077,732$ 8,948,847$ 10,584,517$
Concession revenue 12,802,725 13,086,886 11,301,837 9,628,195 15,257,011
Parking and ground
transportation
12,009,701 12,817,675 10,012,455 7,361,177 14,004,587
Rentals 13,838,446 14,078,153 16,534,688 15,715,644 15,073,157
Reimbrusement for
Services
2,416,793 2,671,073 2,397,717 1,823,280 3,000,059
Toal Operating
Revenue
50,464,837 52,373,269 50,324,429 43,477,143 57,919,331
Interest Income 461,370 2,168,829 2,324,420 (48,887)$ (1,490,220)$
Total 50,926,207$ 54,542,098$ 52,648,849$ 43,428,256$ 56,429,111$
FOR THE YEARS ENDED JUNE 30, 2013-2022
(unaudited)
RENO-TAHOE AIRPORT AUTHORITY
PRINCIPAL OPERATING REVENUE SOURCES
78

Year Signatory
Non-
Signatory
2022 3.04 3.04 73.00 73.00 40.66 6.21
2021 3.23 3.23 85.00 85.00 45.74 9.17
2020 3.23 3.23 78.00 78.00 55.31 8.46
2019 3.14 3.14 77.00 77.00 38.49 5.57
2018 2.95 2.99 77.00 77.00 35.14 5.63
2017 2.62 2.79 73.00 73.00 40.48 5.85
2016 2.78 2.94 70.00 70.00 46.72 6.56
2015 2.97 3.06 60.00 60.00 49.43 7.21
2014 2.80 2.78 55.00 (b) 55.00 (b) 53.24 7.31
2013 2.64 2.81 0.37 0.62 45.42 6.38
(a) Assessed per thousand pounds of FAA maximum certificated landed weight
(b) For fiscal year 2014, the Ramp Over Night fee changed to a flat fee amount per occurance.
Non-Signatory and Ramp Over Night Fees are charged at the budgeted amount.
Notes: The RTAA and certain airlines negotiated an Airline Use and Lease Agreement effective July 1, 1996
which remained in effect through June 20 2010. Starting on July 1, 2010, the RTAA and the airlines executed
a series of two five-year airline agreements effective through June 30, 2020, followed by an extension through June 30,
Signatory
RON (Ramp Over Night) (a)
Non-
Signatory
RENO-TAHOE AIRPORT AUTHORITY
REVENUE RATES AND COST PER ENPLANEMENTS
FOR THE YEARS ENDED JUNE 30, 2013-2022
(unaudited)
Landing Fee (a)
Signatory
Cost per
Enplanement
Signatory
Terminal
Rental Rate
Average
79

YEAR 2022 2021 2020 2019 2018
2017 2016 2015 2014 2013
Gross Pledged Revenues
(1)
63,234,274$ 44,522,461$ 52,909,801$ 54,064,139$ 53,645,091$ 50,148,794$ 47,661,886$ 45,766,095$ 44,371,827$ 43,026,765$
Transfers- CFC Expenses
713,649 447,935 417,741 642,557 - - - - - -
G/L on Sale of Assets
(15,080) (41,838) (28,196) (25,070) (169,208) (13,298) (105,471) (29,533) (5,631) -
Airline Revenue Sharing
5,202,856 2,797,784 2,452,933 4,214,022 4,352,412 3,176,955 2,347,074 1,494,648 1,213,722 1,587,800
35% Gaming Revenue
(439,671) (221,413) (286,561) (390,756) (374,379) (341,751) (374,991) (443,208) (462,963) (550,386)
Direct Operating Expense
(2)
(46,340,021) (42,205,572) (44,037,667) (42,552,009) (40,306,317) (38,112,913) (37,603,816) (35,856,069) (36,158,687) (34,527,241)
Net Pledged Revenue (Available for
Debt and Obligation Payments)
22,356,007$ 5,299,357$ 11,428,051$ 15,952,883$ 17,147,599$ 14,857,787$ 11,924,682$ 10,931,933$ 8,958,268$ 9,536,938$
Debt Service (Senior Lien Debt
Service)
2,250,450 2,247,975 2,249,125 2,248,900 2,247,300 2,249,463 2,310,285 2,521,300 2,516,500 2,523,900
Debt Service Coverage Ratio - Senior
Lien Debt Service
9.93 2.36 5.08 7.09 7.63 6.61 5.16 4.34 3.56 3.78
Net Pledged Revenue (Available for
Subordinate Notes)
20,105,557$ 3,051,382$ 9,178,926$ 13,703,983$ 14,900,299$ 12,608,324$ 9,614,397$ 8,410,633$ 6,441,768$ 7,013,038$
Pledged PFC Revenue
----1,812,790 1,813,919 1,808,804 2,079,176 1,491,202
Pledged Revenue (Available for
Subordinate Notes)
20,105,557 3,051,382 9,178,926 13,703,983 14,900,299 14,421,114 11,428,316 10,219,437 8,520,944 8,504,240
Debt Service (Subordinate Lien Debt
Service) - - - - -
3,139,393 3,140,055 3,134,943 4,150,028 2,777,586
Debt Service - Coverage Ratio -
Subordinate Lien Debt Service - - - - - 4.59 3.64 3.26 2.05 3.06
1) Gross Revenue includes operating revenue, investment income, CFC revenues, jet fuel tax, insurance reimbursements and gain (loss) on sale of capital assets
2) Direct operating expense excludes depreciation and reclamation expense.
RENO-TAHOE AIRPORT AUTHORITY
SCHEDULE OF DEBT AND OBLIGATION COVERAGES
FOR THE YEARS ENDED JUNE 30, 2013-2022
(unaudited)
Notes: Years Prior to 2015 have not been adjusted for GASB 68 to 71
80

2013 2014 2015 2016 2017
Operating Revenues $42,863,935 $44,208,178 $45,512,494 $47,294,719 $49,616,816
Trust Fund Investment
Interest Income 162,830 163,649 253,601 367,167 531,978
Gross Pledged Revenues 43,026,765 44,371,827 45,766,095 47,661,886 50,148,794
Transfers - General Purpose Fund
for LOI Bond Debt Service - - - - -
Transfers- Customer Facility
Charges for Operating Expenses
- - - - -
Operating Expenses (34,527,241) (36,158,687) (35,856,069) (37,603,816) (38,112,913)
G/L on Sale of Capital Assets - (5,631) (29,533) (105,471) (13,298)
Airline Revenue Share Prior Year 1,587,800 1,213,722 1,494,648 2,347,074 3,176,955
35% of Gaming Revenues (550,386) (462,963) (443,208) (374,991) (341,751)
Net Pledged Revenues - Senior
Lien Bonds $9,536,938 $8,958,268 $10,931,933 $11,924,682 $14,857,787
125% of Senior Lien Revenue
Bond Debt Service $3,154,875 $3,145,625 $3,151,625 $2,887,856 $2,811,829
Senior Lien Debt Service $2,523,900 $2,516,500 $2,521,300 $2,310,285 $2,249,463
Net Pledged Revenues - Subordinate
Lien Notes $7,016,041 $6,441,768 $8,410,633 $9,614,397 $12,608,324
Pledged Passenger Facility Charges 1,491,202 2,079,176 1,808,804 1,813,919 1,812,790
Pledged Revenues - Subordinate
Lien Notes $8,507,243 $8,520,944 $10,219,437 $11,428,316 $14,421,114
110% of Subordinate Lien
Debt Service $3,055,345 $4,559,531 $3,448,437 $3,454,061 $3,453,332
Subordinate Lien Debt Service $2,777,586 $4,145,028 $3,134,943 $3,140,055 $3,139,393
Rate Maintenance Minimum
Revenues $6,210,220 $7,705,156 $6,600,062 $6,341,917 $6,265,161
Continued
RENO-TAHOE AIRPORT AUTHORITY
RATE MAINTENANCE COVENANT PERFORMANCE
FOR THE YEARS ENDED JUNE 30, 2013 - 2022
(unaudited)
81

2018 2019 2020 2021 2022
Operating Revenues $52,809,309 $52,880,841 $50,669,726 $43,662,916 $58,064,505
Trust Fund Investment
Interest Income 835,781 1,183,298 2,240,075 1,018,347 1,247,655
Gross Pledged Revenues 53,645,090 54,064,139 52,909,801 44,681,263 59,312,160
Transfers - General Purpose Fund
for LOI Bond Debt Service -
Transfers- Customer Facility
Charges for Operating Expenses
- 642,557 417,741 447,935 713,649
Operating Expenses (40,306,317) (42,552,009) (44,037,667) (42,205,572) (46,340,021)
G/L on Sale of Capital Assets (169,208) (25,070) (28,196) (41,838) (15,080)
Airline Revenue Share Prior Year 4,352,412 4,214,000 2,452,933 2,797,784 5,202,856
35% of Gaming Revenues (374,379) (390,756) (286,561) (221,413) (439,671)
Net Pledged Revenues - Senior
Lien Bonds $17,147,598 $15,952,861 $11,428,051 $5,458,159 $18,433,893
125% of Senior Lien Revenue
Bond Debt Service $2,809,125 $2,811,125 $2,811,406 $2,809,969 $2,813,063
Senior Lien Debt Service $2,247,300 $2,248,900 $2,249,125 $2,247,975 $2,250,450
Net Pledged Revenues - Subordinate
Lien Notes $14,900,298 $13,703,961 $9,178,926 $3,210,184 $16,183,443
Pledged Passenger Facility Charges -----
Pledged Revenues - Subordinate
Lien Notes $14,900,298 $13,703,961 $9,178,926 $3,210,184 $16,183,443
110% of Subordinate Lien
Debt Service $ - $ - $ - $ - $ -
Subordinate Lien Debt Service $ - $ - $ - $ - $ -
Rate Maintenance Minimum
Revenues $2,809,125 $2,811,125 $2,811,406 $2,809,969 $2,813,063
RENO-TAHOE AIRPORT AUTHORITY
RATE MAINTENANCE COVENANT PERFORMANCE
FOR THE YEARS ENDED JUNE 30, 2013 - 2022
(unaudited)
82

2013 2014 2015 2016 2017
Outstanding Debt
Revenue bonds 25,025,000$ 23,715,000$ 22,360,000$ 20,690,000$ 19,435,000$
Unamortized premium 969,422 894,851 820,280 - -
Notes payable 18,015,000 15,615,000 8,937,000 6,037,000 3,057,000
Total outstanding debt 42,522,998$ 40,224,851$ 32,117,280$ 26,727,000$ 22,492,000$
Enplaned Passengers 1,756,471 1,658,187 1,656,293 1,778,611 1,909,187
Outstanding debt per
enplaned passenger 24$ 24$ 19$ 15$ 12$
Debt Service
Principal 3,710,000$ 5,125,000$ 4,320,000$ 4,235,000$ 4,772,000$
Interest 1,591,486 1,541,528 1,336,243 588,367 616,855
Total debt service 5,301,486$ 6,666,528$ 5,656,243$ 4,823,367$ 5,388,855$
Total Expenses 69,177,815 73,521,156 72,190,557 72,514,723 73,017,716
Ratio of debt service
to total expenses 7.66% 9.07% 7.84% 6.65% 7.38%
Continued
Note 1: No debt-to-personal-income ratio is shown because personal income information is not available for the
RTAA trade area. See schedule of Operational Statistical Summary for enplanements.
Note 2: Debt Service for 2013 reflects a reduced by $217,400 for capitalized interest funded from note proceeds
associated with the Series A, 2011 Subordinate Notes, Fixed Rate
Note 3: Debt Service for 2022 reflects minimum debt service requirements for the year. RTAA used federal
stimulus funds under the CARES act and paid off the full principal amount.
RENO-TAHOE AIRPORT AUTHORITY
RATIOS OF OUTSTANDING DEBT AND DEBT SERVICE
FOR THE YEARS ENDED JUNE 30, 2013 - 2022
(unaudited)
83

2018 2019 2020 2021 2022
Outstanding Debt
Revenue bonds 17,720,000$ 15,960,000$ 14,150,000$ 12,290,000$ -$
Unamortized premium - - - - -
Notes payable - - - - -
Total outstanding debt 17,720,000$ 15,960,000$ 14,150,000$ 12,290,000$ -$
Enplaned Passengers 2,064,968 2,149,759
1,690,171 1,231,616 2,079,807
Outstanding debt per
enplaned passenger 9$ 7$ 8$ 10$ -$
Debt Service
Principal 1,760,000$ 1,810,000$ 1,860,000$ 1,910,000$ 1,965,000$
Interest 487,308 438,900 389,125 337,975 285,450
Total debt service 2,247,308$ 2,248,900$ 2,249,125$ 2,247,975$ 2,250,450$
Total Expenses 75,311,669 70,560,599 73,189,668 69,777,962 71,818,990
Ratio of debt service
to total expenses 2.98% 3.19% 3.07% 3.22% 3.13%
Note 1: No debt-to-personal-income ratio is shown because personal income information is not available for the
RTAA trade area. See schedule of Operational Statistical Summary for enplanements.
Note 2: Debt Service for 2013 reflects a reduced by $217,400 for capitalized interest funded from note proceeds
associated with the Series A, 2011 Subordinate Notes, Fixed Rate
Note 3: Debt Service for 2022 reflects minimum debt service requirements for the year. RTAA used federal
stimulus funds under the CARES act and paid off the full principal amount.
RENO-TAHOE AIRPORT AUTHORITY
RATIOS OF OUTSTANDING DEBT AND DEBT SERVICE
FOR THE YEARS ENDED JUNE 30, 2013 - 2022
(unaudited)
84

2012 2013 2014 2015 2016 2017 2018 2019 2020 2021
Nevada
County
Churchill 24,375 24,063 23,989 24,200 24,198 24,230 24,440 24,909 25,516 25,723
Douglas 46,996 47,118 47,536 47,710 48,020 48,309 48,467 48,905 49,488 49,870
Humboldt 17,048 17,363 17,279 17,019 16,842 16,826 16,786 16,831 17,285 17,648
Lyon 51,327 51,557 51,789 52,585 53,179 54,122 55,808 57,510 59,235 60,903
Pershing 6,749 6,877 6,698 6,634 6,560 6,508 6,666 6,725 6,650 6,741
Storey 3,935 3,942 3,912 3,987 4,051 4,006 4,029 4,123 4,104 4,143
Washoe 429,908 433,731 440,078 446,903 453,616 460,587 465,735 471,519 486,492 493,392
Carson City 54,838 54,080 54,522 54,521 54,742 54,745 55,414 55,916 58,639 58,993
Subtotal 635,176 638,731 645,803 653,559 661,208 669,333 677,345 686,438 707,409 717,413
California
County
Alpine 1,129 1,159 1,116 1,110 1,071 1,120 1,101 1,129 1,204 1,235
El Dorado 180,561 181,737 183,087 184,452 185,625 188,987 190,678 192,843 191,185 193,221
Lassen 33,658 32,163 31,749 31,345 30,870 31,163 30,802 30,573 32,730 33,159
Mono 14,348 14,074 13,997 13,909 13,981 14,168 14,250 14,444 13,195 13,247
Nevada 98,292 98,200 98,893 98,877 99,107 99,814 99,696 99,755 102,241 103,487
Placer 361,682 367,309 371,694 375,391 380,531 386,166 393,149 398,329 404,739 412,300
Plumas 19,399 18,859 18,606 18,409 18,627 18,742 18,804 18,807 19,790 19,915
Sierra 3,086 3,047 3,003 2,967 2,947 2,999 2,987 3,005 3,236 3,283
Subtotal 712,155 716,548 722,145 726,460 732,759 743,159 751,467 758,885 768,320 779,847
Total 1,347,331 1,355,279 1,367,948 1,380,019 1,393,967 1,412,492 1,428,812 1,445,323 1,475,729 1,497,260
Percentage
increase
0.47% 0.59% 0.93% 0.88% 1.01% 1.33% 1.16% 1.16% 2.10% 1.46%
Unemployment rate
Washoe County
11.0% 9.4% 7.6% 6.3% 5.0% 3.5% 2.3% 3.2% 4.9% 3.1%
Source: US Census Bureau - Quickfacts
Nevada Department of Employment, Training, and Rehabilitation
http://www.census.gov/quickfacts/table/PST045215/
http://nevadaworkforce.com/CES
RENO-TAHOE AIRPORT AUTHORITY
POPULATION IN AIR TRADE AREA
FOR THE CALENDAR YEARS 2012-2021
(unaudited)
85

Employer Rank Employees Rank Employees
Renown Regional Medical Center 1 1,000-4,999 4 2,500-2,999
Peppermill Hotel Casino-Reno 2 1,000-4,999 5 2,000-2,499
Nugget Casino Resort 3 1,000-4,999 16 1,000-1,499
Grand Sierra Resort & Casino 4 1,000-4,999 13 1,000-1,499
Saint Mary's Regional Medical Center 5 1,000-4,999 10 1,500-1,999
Eldorado Resort Casino 6 1,000-4,999 11 1,000-1,499
Silver Legacy Resort Casino 7 1,000-4,999 8 1,500-1,999
University of Nevada-Reno 8 1,000-4,999 2 4,000-4,499
International Game Technology 9 1,000-4,999 7 2,000-2,499
AMERCO 10 1,000-4,999 - -
Nevada Revised Statute Chapter 612 stipulates that actual employment for individual employers may not be published.
Source: Nevada Workforce & the Department of Employment, Training, and Rehabilitation, 2021 second half.
Calendar year 2021 Calendar year 2011
RENO-TAHOE AIRPORT AUTHORITY
PRINCIPAL EMPLOYERS WITHIN AIR TRADE AREA
FOR THE CALENDAR YEARS ENDED 2021 AND 2011
(unaudited)
86

Year
Board of
Trustees*
Airfield
Operations
Terminal
Building
Maintenance
Police/
Security Parking
Aircraft
Rescue and
Firefighting Administration Total
2022 9.0 56.0 64.5 44.5 15.0 22.0 64.5 275.5
2021 9.0 56.0 67.5 44.5 16.0 20.0 76.5 280.5
2020 9.0 55.0 67.5 44.5 16.0 20.0 77.5 280.5
2019 9.0 55.0 67.5 44.0 16.0 20.0 75.0 277.5
2018 9.0 54.0 68.0 44.0 16.0 20.0 75.5 277.5
2017 9.0 52.0 68.0 43.0 15.0 20.0 74.5 272.5
2016 9.0 52.0 68.0 42.0 15.0 20.0 73.5 270.5
2015 9.0 52.0 68.0 42.0 15.0 20.0 73.5 270.5
2014 9.0 52.0 68.0 42.0 15.0 20.0 71.5 268.5
2013 9.0 50.0 69.0 43.0 15.0 20.0 70.5 267.5
* Board of Trustees Department comprises a nine-member Board of Trustees appointed by the City of Reno, City of Sparks,
Washoe County and the Reno-Sparks Convention & Visitors Authority, amd are not included in the total personnel complement
.
Notes: A full-time employee is scheduled to work 2,080 hours per year (including vacation and sick leave).
Full-time equivalent employment is calculated by dividing total labor hours by 2,080. The amounts above
show the budgeted personnel complement for each fiscal year.
(unaudited)
as of Fiscal Year-End
RENO-TAHOE AIRPORT AUTHORITY
EMPLOYEES
FOR THE YEARS ENDED JUNE 30, 2013-2022
Full-time Equivalent Budgeted Employees
87

Year
Enplanements
Airport
Growth Landed Weights
Airport
Growth
Air Carrier
Operations
Airport
Growth
2022
2,079,807
68.9%
3,077,335
28.0%
44,896
24.8%
2021
1,231,616
-27.1%
2,403,819
-13.8%
35,962
-14.0%
2020
1,690,171
-21.4%
2,789,987
-8.2%
41,797
-12.9%
2019
2,149,759
4.1%
3,039,273
6.3%
47,970
-0.7%
2018
2,064,968
8.2%
2,859,499
1.8%
48,303
11.4%
2017
1,909,187
7.3%
2,808,680
8.0%
43,347
9.5%
2016
1,778,611
7.4%
2,599,963
8.8%
39,579
9.6%
2015
1,656,293
-0.1%
2,390,031
0.1%
36,122
4.1%
2014
1,658,187
-5.6%
2,388,387
-5.3%
34,687
-5.7%
2013
1,756,471
-1.4%
2,522,804
-5.6%
36,800
-8.3%
RENO-TAHOE AIRPORT AUTHORIT
Y
OPERATIONAL STATISTICAL SUMMARY
FOR THE YEARS ENDED JUNE 30, 2013 - 2022
(unaudited)
88

Scheduled Airline Enplanements Share
Percent
Change Enplanements Share
Percent
Change Enplanements Share
Percent
Change Enplanements Share
Percent
Change
Alaska / Horizon Air 113,819 6% 45% 124,581 8% 9% 178,579 11% 43% 204,286 11% 14%
Allegiant Air 7,590 0% 282% 21,578 1% 184% 20,061 1% -7% 19,047 1% -5%
American 201,472 11% 8% 208,919 13% 4% 221,434 13% 6% 385,363 22% 74%
Continental - 0% -100% - 0% n.a - 0% n.a - 0% n.a
Delta 133,014 8% -20% 126,904 8% -5% 119,649 7% -6% 128,189 7% 7%
Frontier 271 0% n.a - 0% -100% - 0% n.a 165 0% n.a
JetBlue Airways 272 0% n.a - 0% -100% 3,346 0% n.a 41,143 2% 1130%
Mesa - 0% n.a - 0% n.a - 0% n.a - 0% n.a
Skywest - 0% n.a - 0% n.a - 0% n.a - 0% n.a
Southwest 945,143 54% -2% 815,160 49% -14% 734,786 44% -10% 763,006 43% 4%
United 210,530 12% -5% 214,531 13% 2% 214,864 13% 0% 216,996 12% 1%
US Airways (America West
)
143,559 8% 1% 144,760 9% 1% 154,331 9% 7% - 0% -100%
Volaris - 0% n.a - 0% n.a 6,959 0% n.a 17,070 1% 145%
Other 1,073 0% 5% 1,754 0% 63% 2,284 0% 30% 3,346 0% 46%
1,756,743 100% -1% 1,658,187 100% -6% 1,656,293 100% 0% 1,778,611 100% 7%
Rounding errors may occur. Continued
20162014
RENO-TAHOE AIRPORT AUTHORITY
RENO-TAHOE INTERNATIONAL AIRPORT
ENPLANEMENTS AND MARKET SHARE BY SCHEDULED AIRLINE
FOR THE YEARS ENDED JUNE 30, 2013-2022
2013 2015
89

Scheduled Airline Enplanements Share
Percent
Change Enplanements Share
Percent
Change Enplanements Share
Percent
Change
Alaska / Horizon Air 226,117 12% 11% 212,427 10% -6% 208,312 10% -2%
Allegiant Air 31,504 2% 65% 30,663 1% -3% 41,681 2% 36%
American 370,451 19% -4% 383,996 19% 4% 384,766 18% 0%
Continental - 0% n.a - 0% n.a - 0% n.a
Delta 136,418 7% 6% 152,435 7% 12% 165,441 8% 9%
Frontier - 0% -100% 18,271 1% n.a 26,709 1% 46%
JetBlue Airways 77,686 4% 89% 80,494 4% 4% 78,164 4% -3%
Mesa - 0% n.a - 0% n.a - 0% n.a
Skywest - 0% n.a - 0% n.a - 0% n.a
Southwest 816,323 43% 7% 901,470 44% 10% 909,515 42% 1%
United 226,272 12% 4% 265,271 13% 17% 311,716 15% 18%
US Airways (America West
)
- 0% n.a - 0% n.a - 0% n.a
Volaris 20,966 1% 23% 17,234 1% -18% 19,819 1% 15%
Other 3,450 0% 3% 2,707 0% -22% 3,636 0% 34%
1,909,187 100% 7% 2,064,968 100% 8% 2,149,759 100% 4%
Continued
2018 20192017
RENO-TAHOE AIRPORT AUTHORITY
RENO-TAHOE INTERNATIONAL AIRPORT
ENPLANEMENTS AND MARKET SHARE BY SCHEDULED AIRLINE
FOR THE YEARS ENDED JUNE 30, 2013-2022
90
Scheduled Airline Enplanements Share
Percent
Change Enplanements Share
Percent
Change Enplanements Share
Percent
Change
Alaska / Horizon Air 172,563 10% -17% 120,292 10% -30% 198,399 10% 65%
Allegiant Air 35,224 2% -15% 29,316 2% -17% 33,008 2% 13%
American 347,656 21% -10% 246,791 20% -29% 362,636 17% 47%
Continental - 0% n.a - 0% n.a - 0% n.a
Delta 128,574 8% -22% 131,351 11% 2% 214,794 10% 64%
Frontier 19,390 1% -27% 24,976 2% 29% 33,071 2% 32%
JetBlue Airways 52,825 3% -32% 16,084 1% -70% 55,472 3% 245%
Mesa - 0% n.a - 0% n.a - 0% n.a
Skywest - 0% n.a - 0% n.a - 0% n.a
Southwest 658,668 39% -28% 460,904 37% -30% 833,339 40% 81%
United 253,093 15% -19% 175,966 14% -30% 294,366 14% 67%
US Airways (America West
)
- 0% n.a - 0% n.a - 0% n.a
Volaris 19,937 1% 1% 18,207 1% -9% 26,785 1% 47%
Other 2,241 0% -38% 7,729 1% 245% 27,948 1% 262%
1,690,171 100% -21% 1,231,616 100% -27% 2,079,818 100% 69%
20222020 2021
RENO-TAHOE AIRPORT AUTHORITY
RENO-TAHOE INTERNATIONAL AIRPORT
ENPLANEMENTS AND MARKET SHARE BY SCHEDULED AIRLINE
FOR THE YEARS ENDED JUNE 30, 2013-2022
91

Scheduled Airline
Landed
Weights
(000) lbs Share
Percent
Change
Landed
Weights
(000) lbs Share
Percent
Change
Landed
Weights
(000) lbs Share
Percent
Change
Alaska / Horizon Ai
r
112,694 4% 49% 122,862 5% 62% 189,675 8% 68%
Allegiant Ai
r
7,650 0% n.a 24,413 1% n.a 23,003 1% 201%
America
n
206,613 8% 5% 213,251 9% 9% 233,599 10% 13%
Continental - 0% -100% - 0% -100% - 0% n.a
Delta 161,684 6% -21% 146,329 6% -29% 148,955 6% -8%
Frontie
r
- 0% n.a - 0% n.a - 0% n.a
JetBlue Airways - 0% n.a - 0% n.a 3,555 0% n.a
Southwes
t
1,190,140 47% -12% 989,574 41% -27% 864,660 36% -27%
United 237,421 9% -9% 236,595 10% -10% 235,831 10% -1%
US Airways (America West) 184,243 7% -1% 195,099 8% 5% 199,824 8% 8%
Volaris - 0% n.a - 0% n.a 8,141 0% n.a
Federal Express 226,398 9% 0% 281,383 12% 24% 290,218 12% 28%
United Parcel Service 170,193 7% 22% 162,298 7% 17% 168,878 7% -1%
Othe
r
25,768 1% 205% 16,584 1% 96% 23,692 1% -8%
n.a
2,522,804 100% -6% 2,388,388 100% -11% 2,390,031 100% -5%
Continued
Rounding errors may occur.
RENO-TAHOE AIRPORT AUTHORITY
RENO-TAHOE INTERNATIONAL AIRPORT
LANDED WEIGHTS AND MARKET SHARE BY SCHEDULED AIRLINE
FOR THE YEARS ENDED JUNE 30, 2013-2022
(unaudited)
2013 2014 2015
92

Scheduled Airline
Landed
Weights
(000) lbs Share
Percent
Change
Landed
Weights
(000) lbs Share
Percent
Change
Landed
Weights
(000) lbs Share
Percent
Change
Alaska / Horizon Ai
r
212,173 8% 12% 234,218 8% 10% 213,477 7% -9%
Allegiant Ai
r
21,866 1% -5% 36,073 1% 65% 32,959 1% -9%
America
n
441,718 17% 89% 409,575 15% -7% 419,085 15% 2%
Continental - 0% n.a - 0% n.a - 0% n.a
Delta 144,923 6% -3% 157,875 6% 9% 168,798 6% 7%
Frontie
r
145 0% n.a - 0% -100% 19,339 1% n.a
JetBlue Airways 46,072 2% 1196% 87,084 3% 89% 94,135 3% 8%
Southwes
t
873,884 34% 1% 983,684 35% 13% 1,066,311 37% 8%
United 245,891 9% 4% 255,760 9% 4% 307,621 11% 20%
US Airways (America West) - 0% -100% - 0% n.a - 0% n.a
Volaris 19,612 1% 141% 23,234 1% 18% 17,752 1% -24%
Federal Express 329,884 13% 14% 339,683 12% 3% 239,569 8% -29%
United Parcel Service 225,495 9% 34% 238,302 8% 6% 236,563 8% -1%
Othe
r
38,300 1% 62% 43,193 2% 13% 43,890 2% 2%
2,599,963 100% 9% 2,808,680 100% 8% 2,859,499 100% 2%
Continued
RENO-TAHOE AIRPORT AUTHORITY
RENO-TAHOE INTERNATIONAL AIRPORT
LANDED WEIGHTS AND MARKET SHARE BY SCHEDULED AIRLINE
FOR THE YEARS ENDED JUNE 30, 2013-2022
(unaudited)
2016 2017 2018
93

Scheduled Airline
Landed
Weights
(000) lbs Share
Percent
Change
Landed
Weights
(000) lbs Share
Percent
Change
Landed
Weights
(000) lbs Share
Percent
Change
Landed
Weights
(000) lbs Share
Percent
Change
Alaska / Horizon Ai
r
237,323 8% 11% 220,316 8% -7% 171,489 7% -22% 226,813 7% 32%
Allegiant Ai
r
43,831 1% 33% 40,800 1% -7% 45,311 2% 11% 41,859 1% -8%
America
n
418,385 14% 0% 412,245 15% -1% 334,152 14% -19% 413,665 13% 24%
Continental - 0% n.a - 0% n.a - 0% n.a - 0% n.a
Delta 180,568 6% 7% 166,235 6% -8% 241,266 10% 45% 252,886 8% 5%
Frontie
r
25,565 1% 32% 20,019 1% -22% 30,273 1% 51% 34,922 1% 15%
JetBlue Airways 89,585 3% -5% 70,163 3% -22% 33,396 1% -52% 80,321 3% 141%
Southwes
t
1,052,732 35% -1% 883,824 32% -16% 626,539 26% -29% 936,363 30% 49%
United 353,941 12% 15% 317,803 11% -10% 241,228 10% -24% 336,502 11% 39%
US Airways (America West) - 0% n.a - 0% n.a - 0% n.a - 0% n.a
Volaris 20,807 1% 17% 21,948 1% 5% 22,392 1% 2% 30,993 1% 38%
Federal Express 279,851 9% 17% 273,322 10% -2% 284,219 12% 4% 305,799 10% 8%
United Parcel Service 287,723 9% 22% 316,735 11% 10% 313,617 13% -1% 314,538 10% 0%
Othe
r
48,965 2% 12% 46,578 2% -5% 59,737 2% 28% 102,676 3% 72%
3,039,273 100% 6% 2,789,988 100% -8% 2,403,619 100% -14% 3,077,337 100% 28%
2021 2022
RENO-TAHOE AIRPORT AUTHORITY
RENO-TAHOE INTERNATIONAL AIRPORT
LANDED WEIGHTS AND MARKET SHARE BY SCHEDULED AIRLINE
FOR THE YEARS ENDED JUNE 30, 2013-2022
(unaudited)
2019 2020
94

Reno-Tahoe International Airport
Location: 2001 East Plumb Lane
4 miles southeast of Downtown Reno
Airport Code: RNO
Elevation: 4,415 ft
Area: 1,450 acres
Runways and Facilities:
Runway 16R/34L 11,001 x 150 ft
Runway 16L/34R 9,000 x 150 ft
Runway 7/25 6,102 x 150 ft
FAA staffs and operates one 24-hour Air Traffic Control Tower
Reno Stead Airport
Location: 11 miles northwest of Downtown Reno
Elevation: 5,050 ft
Area: 5,000 acres
Runways and Facilities:
Runway 08/26 7,608 x 150 ft
Runway 14/32 9,000 x 150 ft
Created in 1977 by State Legislature
Nine-member Board
RENO-TAHOE AIRPORT AUTHORITY
CAPITAL ASSET INFORMATION
AS OF JUNE 30, 2022
(unaudited)
95

2022 2021 2020 2019 2018 (c) 2017 (b) 2016 (a) 2015 2014 2013
Terminal Space - square feet
Airlines 176,742 176,871 176,871 176,871 169,230 175,985 175,221 175,221 175,221 175,221
Ground Transportation 2,883 2,883 2,883 2,883 2,883 2,883 2,883 2,883 2,883 2,883
Concession Space
37,604 37,604 37,604 37,604 37,604 37,167 37,167 37,167 37,167 37,167
Public Areas 196,189 196,189 196,189 196,189 196,189 196,959 197,723 197,723 197,723 197,723
RTAA 44,885 44,885 44,885 44,885 52,397 45,309 45,309 45,309 45,309 45,309
Unfinished Areas - - - - - - - - - -
458,303 458,432 458,432 458,432 458,303 458,303 458,303 458,303 458,303 458,303
Passenger Boarding Gates 22 22 23 23 23 23 23 23 23 23
Parking - Number of Spaces
Short -Term (b) 296 296 295 295 296 300 300 450 450 450
Long-Term 1,630 1,630 1,630 1,630 1,630 1,650 1,650 1,650 1,650
1,650
Surface Lot 1,462 1,462 1,469 1,462 1,462 1,532 1,532 1,532 1,532
1,532
3,388 3,388 3,394 3,387 3,388 3,482 3,482 3,632 3,632 3,632
Cargo - square feet
Building 67,500 67,500 67,500 67,500 67,500 67,500 67,500 67,500 67,500 67,500
Landside 150,000 150,000 150,000 150,000 150,000 150,000 150,000 150,000 150,000 150,000
Airside 591,250 591,250 591,250 591,250 591,250 591,250 591,250 591,250 591,250 591,250
808,750 808,750 808,750 808,750 808,750 808,750 808,750 808,750 808,750 808,750
(a) In 2016, the decrease in short-term parking spaces reflect the expansion of the rental car return area in the parking garage to accommodate increasing rental car activity.
(b) In 2017, the increase in airline square footage reflects the installation of kiosks in the public queuing area.
(c) In 2018, the decrease in parking spaces reflects a reconfiguration of the parking areas to maximize efficiency.
Source: Terminal Square Footage - Financial Scenario Model FY 2022 Settlement -Terminal Rent Tab
RENO-TAHOE AIRPORT AUTHORITY
CAPITAL ASSET INFORMATION
AS OF JUNE 30, 2013-2022
(unaudited)
96

Compliance
Section
FEDERAL AWARDS

97
INDEPENDENT AUDITOR’S REPORT ON INTERNAL CONTROL OVER FINANCIAL
REPORTING AND ON COMPLIANCE AND OTHER MATTERS
BASED ON AN AUDIT OF FINANCIAL STATEMENTS PERFORMED IN
ACCORDANCE WITH GOVERNMENT AUDITING STANDARDS
Board of Trustees
Reno-Tahoe Airport Authority
Reno, Nevada
We have audited, in accordance with the auditing standards generally accepted in the United States of
America and the standards applicable to financial audits contained in Government Auditing Standards
issued by the Comptroller General of the United States, the financial statements of the business-type
activities of the Reno-Tahoe Airport Authority (the “Authority”) as of and for the year ended June 30, 2022,
and the related notes to the financial statements, which collectively comprise the Authority’s basic financial
statements, and have issued our report thereon dated November 30, 2022.
Report on Internal Control Over Financial Reporting
In planning and performing our audit of the financial statements, we considered the Authority's internal
control over financial reporting (internal control) as a basis for designing audit procedures that are
appropriate in the circumstances for the purpose of expressing our opinions on the financial statements,
but not for the purpose of expressing an opinion on the effectiveness of the Authority’s internal control.
Accordingly, we do not express an opinion on the effectiveness of the Authority’s internal control.
A deficiency in internal control exists when the design or operation of a control does not allow management
or employees, in the normal course of performing their assigned functions, to prevent, or detect and correct,
misstatements on a timely basis. A material weakness is a deficiency, or a combination of deficiencies, in
internal control, such that there is a reasonable possibility that a material misstatement of the entity’s
financial statements will not be prevented, or detected and corrected on a timely basis. A significant
deficiency is a deficiency, or a combination of deficiencies, in internal control that is less severe than a
material weakness, yet important enough to merit attention by those charged with governance.
Our consideration of internal control was for the limited purpose described in the first paragraph of this
section and was not designed to identify all deficiencies in internal control that might be material
weaknesses or significant deficiencies. Given these limitations, during our audit we did not identify any
deficiencies in internal control that we consider to be material weaknesses. However, material weaknesses
or significant deficiencies may exist that have not been identified.
Report on Compliance and Other Matters
As part of obtaining reasonable assurance about whether the Authority's financial statements are free from
material misstatement, we performed tests of its compliance with certain provisions of laws, regulations,
contracts, and grant agreements, noncompliance with which could have a direct and material effect on the
financial statements. However, providing an opinion on compliance with those provisions was not an
objective of our audit, and accordingly, we do not express such an opinion. The results of our tests disclosed
no instances of noncompliance or other matters that are required to be reported under Government Auditing
Standards.

98
Purpose of this Report
The purpose of this report is solely to describe the scope of our testing of internal control and compliance
and the results of that testing, and not to provide an opinion on the effectiveness of the entity’s internal
control or on compliance. This report is an integral part of an audit performed in accordance with
Government Auditing Standards in considering the entity’s internal control and compliance. Accordingly,
this communication is not suitable for any other purpose.
Crowe LLP
Indianapolis, Indiana
November 30, 2022

99
INDEPENDENT AUDITOR’S REPORT ON COMPLIANCE FOR EACH
MAJOR FEDERAL PROGRAM AND REPORT ON INTERNAL CONTROL OVER COMPLIANCE
Board of Trustees
Reno-Tahoe Airport Authority
Reno, Nevada
Report on Compliance for Each Major Federal Program
Opinion on Major Federal Program
We have audited the Reno-Tahoe Airport Authority’s (the “Authority”) compliance with the types of
compliance requirements described in the OMB Compliance Supplement that could have a direct and
material effect on the Authority’s major federal program for the year ended June 30, 2022. The Authority’s
major federal program is identified in the summary of auditor’s results section of the accompanying
schedule of findings and questioned costs.
In our opinion, the Authority complied, in all material respects, with the compliance requirements referred
to above that could have a direct and material effect on its major federal program for the year ended June
30, 2022.
Basis for Opinion on Major Federal Program
We conducted our audit of compliance in accordance with auditing standards generally accepted in the
United States of America (GAAS); the standards applicable to financial audits contained in Government
Auditing Standards issued by the Comptroller General of the United States (Government Auditing
Standards); and the audit requirements of Title 2 U.S. Code of Federal Regulations Part 200, Uniform
Administrative Requirements, Cost Principles, and Audit Requirements for Federal Awards (Uniform
Guidance). Our responsibilities under those standards and the Uniform Guidance are further described in
the Auditor’s Responsibilities for the Audit of Compliance section of our report.
We are required to be independent of the Authority and to meet our other ethical responsibilities, in
accordance with relevant ethical requirements relating to our audit. We believe that the audit evidence we
have obtained is sufficient and appropriate to provide a basis for our opinion on compliance for the major
federal program. Our audit does not provide a legal determination of the Authority’s compliance with the
compliance requirements referred to above.
Responsibilities of Management for Compliance
Management is responsible for compliance with federal statutes, regulations, and the terms and conditions
of its federal awards applicable to its federal programs.
100
Auditor’s Responsibilities for the Audit of Compliance
Our objectives are to obtain reasonable assurance about whether material noncompliance with the
compliance requirements referred to above occurred, whether due to fraud or error, and express an opinion
on the Authority’s compliance based on our audit. Reasonable assurance is a high level of assurance but
is not absolute assurance and therefore is not a guarantee that an audit conducted in accordance with
GAAS, Government Auditing Standards, and the Uniform Guidance will always detect material
noncompliance when it exists. The risk of not detecting material noncompliance resulting from fraud is
higher than for that resulting from error, as fraud may involve collusion, forgery, intentional omissions,
misrepresentations, or the override of internal control. Noncompliance with the compliance requirements
referred to above is considered material, if there is a substantial likelihood that, individually or in the
aggregate, it would influence the judgment made by a reasonable user of the report on compliance about
the Authority’s compliance with the requirements of the major federal program as a whole.
In performing an audit in accordance with GAAS, Government Auditing Standards, and the Uniform
Guidance, we
x exercise professional judgment and maintain professional skepticism throughout the audit.
x identify and assess the risks of material noncompliance, whether due to fraud or error, and design
and perform audit procedures responsive to those risks. Such procedures include examining, on a
test basis, evidence regarding the Authority’s compliance with the compliance requirements
referred to above and performing such other procedures as we considered necessary in the
circumstances.
x obtain an understanding of the Authority’s internal control over compliance relevant to the audit in
order to design audit procedures that are appropriate in the circumstances and to test and report
on internal control over compliance in accordance with the Uniform Guidance, but not for the
purpose of expressing an opinion on the effectiveness of the Authority’s internal control over
compliance. Accordingly, no such opinion is expressed.
We are required to communicate with those charged with governance regarding, among other matters, the
planned scope and timing of the audit and any significant deficiencies and material weaknesses in internal
control over compliance that we identified during the audit.
Report on Internal Control Over Compliance
A deficiency in internal control over compliance exists when the design or operation of a control over
compliance does not allow management or employees, in the normal course of performing their assigned
functions, to prevent, or detect and correct, noncompliance with a type of compliance requirement of a
federal program on a timely basis. A material weakness in internal control over compliance is a deficiency,
or combination of deficiencies, in internal control over compliance, such that there is a reasonable possibility
that material noncompliance with a type of compliance requirement of a federal program will not be
prevented, or detected and corrected, on a timely basis. A significant deficiency in internal control over
compliance is a deficiency, or a combination of deficiencies, in internal control over compliance with a type
of compliance requirement of a federal program that is less severe than a material weakness in internal
control over compliance, yet important enough to merit attention by those charged with governance.
Our consideration of internal control over compliance was for the limited purpose described in the Auditor’s
Responsibilities for the Audit of Compliance section above and was not designed to identify all deficiencies
in internal control over compliance that might be material weaknesses or significant deficiencies in internal
control over compliance. Given these limitations, during our audit we did not identify any deficiencies in
internal control over compliance that we consider to be material weaknesses, as defined above. However,
material weaknesses or significant deficiencies in internal control over compliance may exist that were not
identified.
Our audit was not designed for the purpose of expressing an opinion on the effectiveness of internal control
over compliance. Accordingly, no such opinion is expressed.

101
The purpose of this report on internal control over compliance is solely to describe the scope of our testing
of internal control over compliance and the results of that testing based on the requirements of the Uniform
Guidance. Accordingly, this report is not suitable for any other purpose.
Crowe LLP
Indianapolis, Indiana
November 30, 2022

RENO-TAHOE AIRPORT AUTHORITY
SCHEDULE OF EXPENDITURES OF FEDERAL
AWARDS FOR THE YEAR ENDED JUNE 30, 2022
ASSISTANCE FEDERAL REIMBURSEMENTS RECEIVED
PERCENT OF LISTING PROJECT GRANT July 1, 2021 to Cumulative July 1, 2021 to Cumulative
DESCRIPTION OF PROJECT PARTICIPATION NUMBER NUMBER AMOUNT June 30, 2022 Thru June 30, 2022 June 30, 2022 Thru June 30, 2022
United States Department of Transportation
Federal Aviation Administration
Airport Improvement Program
Construction
Reno Runway 16R-34L Reconstruction Phase 2 93.75% 20.106 3-32-0017-105 9,590,838 5,830,850 9,590,838 5,830,850 9,590,838
Reno Runway 16R-34L Reconstruction Phase 2 100.00% 20.106 3-32-0017-106 31,705,245 16,214,413 30,494,263 16,235,539 30,515,451
VALE eGSE Installation 100.00% 20.106 3-32-0017-108 1,239,000 77,739
1,234,421 50,212
1,234,421
Reno CARES Act Grant 100.00% 20.106 3-32-0017-107 30,957,866 1,841,025 9,502,368 3,125,025 9,512,368
Taxiway B & C Design 100.00% 20.106 3-32-0017-109 455,032
400,269
400,269
435,804
435,804
Reno CRRSA 100.00% 20.106 3-32-0017-110 6,146,847 6,146,847 6,146,847 6,146,847 6,146,847
Reno CRRSA Concessions 100.00% 20.106 3-32-0017-111 463,098
463,098
463,098
463,098
463,098
Reno ARP
A Act 100.00% 20.106 3-32-0017-112 16,653,997 4,508,985 4,508,985 4,518,985 4,518,985
Reno ARPA Consessions 100.00% 20.106 3-32-0017-114 1,852,390 -
-
132,122
132,122
Reconst
ruct Apron - Design 93.75% 20.106 3-32-0018-038 1,031,773 19,124
1,031,773 400
1,031,773
Taxiway A and Apron Phase 1 100.00% 20.106 3-32-0018-039 4,838,133 735,669 4,727,778 413,831 4,727,778
Stead CARES Act Grant 100.00% 20.106 3-32-0018-040 30,000
15,000
30,000
15,000
30,000
Apron and T
axiway A Phase 3 100.00% 20.106 3-32-0018-041 3,659,228 3,588,930 3,588,930 3,588,930 3,588,930
Stead CRRSA 100.00% 20.106 3-32-0018-043 23,000
23,000
23,000
23,000
23,000
S
tead Reconstruction Apron 100.00% 20.106 3-32-0018-044 1,173,333 1,125,308 1,125,308 1,125,308 1,125,308
Stead ARPA Act 100.00% 20.106 3-32-0018-045 59,000 59,000 59,000 59,000 59,000
109,878,780
41,049,257 72,926,878 42,163,951 73,135,723
Unite
d States Department of Homeland Secur
ity
Transportation Security Administration
Aviation and Transportation Security Act
Security
National Explosives Detection Canine Team Program Fixed 97.072 HSTS02-15-H-NCP471 1,047,875 151,500 1,132,594 151,500 1,132,594
Law Enforcement Officer Reimbursement Agreement Program Fixed 97.090 HSTS02-16-H-SLR658 1,672,573 284,530
1,730,110 284,530
1,730,110
2,720,448 436,030
2,862,704 436,030
2,862,704
Department of Justice
Criminal Division
Department of Justice Asset Forfeiture Program
Equitable Sharing
Direct Payments for Specified Use Fixed 16.922 15-5042-0-2-752 33,085 1,411 34,496 1,411 32,279
112,632,313
$ 41,486,698$ 75,824,078$ 42,601,392$ 76,030,706$
S
ee accompanying notes to Supplementary Schedule of Expenditures of Federal Awards
REIMBURSEABLE EXPENSES
102

RENO-TAHOE AIRPORT AUTHORITY
NOTES TO FINANCIAL STATEMENTS
JUNE 30, 2022
1.
Basis of Presentation:
The accompanying schedule of expenditures of federal awards (the Schedule) includes the federal award
activity of the Authority under programs of the federal government for the year ended June 30, 2022.
The information in this Schedule is presented in accordance with the requirements of Title 2 U.S. Code
of Federal Regulations Part 200, Uniform Administrative Requirements, Cost Principles, and Audit
Requirements for Federal Awards (Uniform Guidance). Because the Schedule presents only a selected
portion of the operations of the Authority, it is not intended to and does not present the financial position,
changes in net position, or cash flows of the Authority.
2.
Summary of Significant Accounting Policies:
Expenditures reported on the Schedule are reported on the accrual basis of accounting. Such
expenditures are recognized following the cost principles contained in the Uniform Guidance, wherein
certain types of expenditures are not allowable or are limited as to reimbursement.
3.
Indirect Cost Rate:
The Authority has elected not to use the 10 percent de minimis indirect cost rate allowed under the
Uniform Guidance.
4.
Special Tests and Provisions:
Special tests and provisions for the Airport Improvement Program (AIP) include review of the
Authority's policy for using airport revenue to determine whether all airport revenue is accounted for
and used for the capital or operating costs of the airport.
5.
Subrecipients:
The Authority did not have any federal awards that were passed through to subrecipients for the year
ended June 30, 2022.
103

104
RENO-TAHOE AIRPORT AUTHORITY
SCHEDULE OF FINDINGS AND QUESTIONED COSTS
Year ended June 30, 2022
Section 1 – Summary of Auditor’s Results
Financial Statements
Type of auditor’s report issued: Unmodified
Internal control over financial reporting:
Material weakness(es) identified? Yes X No
Significant deficiencies identified not
considered to be material weaknesses? Yes X None Reported
Noncompliance material to financial statements noted? Yes X No
Federal Awards
Internal Control over major programs:
Material weakness(es) identified? Yes X No
Significant deficiency(ies) identified not
considered to be material weaknesses?
Yes X None Reported
Type of auditor’s report issued on compliance for
major programs: Unmodified
Any audit findings disclosed that are required to be
reported in accordance with 2 CFR 200.516(a)? Yes X No
Identification of major programs:
Assistance Listing Number(s) Name of Federal Program or Cluster
20.106 U.S. Department of Transportation: Federal Aviation Administration:
Airport Improvement Program (including COVID-19 funding)
Dollar threshold used to distinguish between Type A and Type B programs: $ 1,278,042
Auditee qualified as low-risk auditee? X Yes No
Section II – Financial Statement Findings
None reported.
Section III – Federal Award Findings and Questioned Costs
None reported.
PASSENGER FACILITY
CHARGES

105
INDEPENDENT AUDITOR’S REPORT ON COMPLIANCE WITH
REQUIREMENTS APPLICABLE TO THE PASSENGER FACILITY
CHARGE (PFC) PROGRAM AND ON INTERNAL CONTROL OVER
COMPLIANCE AND THE SCHEDULE OF PASSENGER
FACILITY CHARGES COLLECTED AND EXPENDED
Board of Trustees
Reno-Tahoe Airport Authority
Reno, Nevada
Report on Compliance of Passenger Facility Charges
Opinion on Passenger Facility Charge Program
We have audited the Reno-Tahoe Airport Authority’s (the “Authority”) compliance with the compliance
requirements described in the Passenger Facility Charge Audit Guide for Public Agencies, issued by the
Federal Aviation Administration (“Guide”), that could have a direct and material effect on its passenger
facility charge program for the year ended June 30, 2022.
In our opinion, the Authority complied, in all material respects, with the compliance requirements referred
to above that could have a direct and material effect on its passenger facility charge program for the year
ended June 30, 2022.
Basis for Opinion on Passenger Facility Charge Program
We conducted our audit of compliance in accordance with auditing standards generally accepted in the
United States of America (GAAS); the standards applicable to financial audits contained in Government
Auditing Standards issued by the Comptroller General of the United States (Government Auditing
Standards); and the audit requirements of the Guide. Our responsibilities under those standards and the
Guide are further described in the Auditor’s Responsibilities for the Audit of Compliance section of our
report.
We are required to be independent of the Authority and to meet our other ethical responsibilities, in
accordance with relevant ethical requirements relating to our audit. We believe that the audit evidence we
have obtained is sufficient and appropriate to provide a basis for our opinion on compliance for the
passenger facility charge program. Our audit does not provide a legal determination of the Authority’s
compliance with the Guide referred to above.
Responsibilities of Management for Compliance
Management is responsible for compliance with the requirements referred to above and for the design,
implementation, and maintenance of effective internal control over compliance with the requirements of
laws, statutes, regulations, rules and provisions of contracts or grant agreements applicable to the
Authority’s passenger facility charge program.
106
Auditor’s Responsibilities for the Audit of Compliance
Our objectives are to obtain reasonable assurance about whether material noncompliance with the
compliance requirements referred to above occurred, whether due to fraud or error, and express an opinion
on the Authority’s compliance based on our audit. Reasonable assurance is a high level of assurance but
is not absolute assurance and therefore is not a guarantee that an audit conducted in accordance with
GAAS, Government Auditing Standards, and the Guide will always detect material noncompliance when it
exists. The risk of not detecting material noncompliance resulting from fraud is higher than for that resulting
from error, as fraud may involve collusion, forgery, intentional omissions, misrepresentations, or the
override of internal control. Noncompliance with the compliance requirements referred to above is
considered material, if there is a substantial likelihood that, individually or in the aggregate, it would
influence the judgment made by a reasonable user of the report on compliance about the Authority’s
compliance with the requirements of the passenger facility charge program as a whole.
In performing an audit in accordance with GAAS, Government Auditing Standards, and the Guide, we
x exercise professional judgment and maintain professional skepticism throughout the audit.
x identify and assess the risks of material noncompliance, whether due to fraud or error, and
design and perform audit procedures responsive to those risks. Such procedures include
examining, on a test basis, evidence regarding the Authority’s compliance with the compliance
requirements referred to above and performing such other procedures as we considered
necessary in the circumstances.
x obtain an understanding of the Authority’s internal control over compliance relevant to the
audit in order to design audit procedures that are appropriate in the circumstances and to test
and report on internal control over compliance in accordance with the Guide, but not for the
purpose of expressing an opinion on the effectiveness of the Authority’s internal control over
compliance. Accordingly, no such opinion is expressed.
We are required to communicate with those charged with governance regarding, among other matters, the
planned scope and timing of the audit and any significant deficiencies and material weaknesses in internal
control over compliance that we identified during the audit.
Report on Internal Control Over Compliance
A deficiency in internal control over compliance exists when the design or operation of a control over
compliance does not allow management or employees, in the normal course of performing their assigned
functions, to prevent, or detect and correct, noncompliance with a type of compliance requirement of a
federal program on a timely basis. A material weakness in internal control over compliance is a deficiency,
or combination of deficiencies, in internal control over compliance, such that there is a reasonable possibility
that material noncompliance with a type of compliance requirement of a federal program will not be
prevented, or detected and corrected, on a timely basis. A significant deficiency in internal control over
compliance is a deficiency, or a combination of deficiencies, in internal control over compliance with a type
of compliance requirement of a federal program that is less severe than a material weakness in internal
control over compliance, yet important enough to merit attention by those charged with governance.
Our consideration of internal control over compliance was for the limited purpose described in the Auditor’s
Responsibilities for the Audit of Compliance section above and was not designed to identify all deficiencies
in internal control over compliance that might be material weaknesses or significant deficiencies in internal
control over compliance. Given these limitations, during our audit we did not identify any deficiencies in
internal control over compliance that we consider to be material weaknesses, as defined above. However,
material weaknesses or significant deficiencies in internal control over compliance may exist that were not
identified.
Our audit was not designed for the purpose of expressing an opinion on the effectiveness of internal control
over compliance. Accordingly, no such opinion is expressed.
The purpose of this report on internal control over compliance is solely to describe the scope of our testing
of internal control over compliance and the results of that testing based on the requirements of Passenger
Facility Charge Audit Guide for Public Agencies
, issued by the Federal Aviation Administration.
Accordingly, this report is not suitable for any other purpose.

107
Report on Schedule of Expenditures of Passenger Facility Charges
We have audited the financial statements of the Authority as of and for the year ended June 30, 2022, and
the related notes to the financial statements, which collectively comprise the Authority’s basic financial
statements. We issued our report thereon dated November 30, 2022, which contained an unmodified
opinion on those financial statements. Our audit was conducted for the purpose of forming an opinion on
the financial statements that collectively comprise the basic financial statements. The accompanying
supplemental schedule of passenger facility charges collected and expended is presented for purposes of
additional analysis as specified in the Guide and is not a required part of the basic financial statements.
Such information is the responsibility of management and was derived from and relates directly to the
underlying accounting and other records used to prepare the basic financial statements. The information
has been subjected to the auditing procedures applied in the audit of the basic financial statements and
certain additional procedures including comparing and reconciling such information directly to the
underlying accounting and other records used to prepare the basic financial statements or to the basic
financial statements themselves, and other additional procedures in accordance with auditing standards
generally accepted in the United States of America. In our opinion, the supplemental schedule of
passenger facility charges collected and expended is fairly stated in all material respects, in relation to the
basic financial statements as a whole.
Crowe LLP
Indianapolis, Indiana
November 30, 2022

15,402,598$
8,364,288
132,289
(2,855,799)$
Balance July 1, 2021
Collection of Passenger Facility Charges, July 1, 2021
through June 30, 2022
Interest earnings
Proceeds expended for Passenger Facility Charge Projects
July 1, 2021 through June 30, 2022
Balance June 30, 2022
21,043,376$
SUPPLEMENTARY SCHEDULE OF PASSENGER FACILITY CHARGES
COLLECTED AND EXPENDED
FOR THE YEAR ENDED JUNE 30, 2022
RENO-TAHOE AIRPORT AUTHORITY
108

RENO-TAHOE AIRPORT AUTHORITY
SCHEDULE OF PASSENGER FACILITY CHARGES FINDINGS AND QUESTIONED COSTS
Year ended June 30, 2022
109
Summary of Auditor's Results
We have issued an unmodified opinion, dated November 30, 2022 on the financial statements of the Reno-
Tahoe Airport Authority as of and for the year ended June 30, 2022.
Our audit disclosed no material weaknesses or significant deficiencies that are considered to be material
weaknesses in relation to internal control over financial reporting or internal control over the passenger
facility charge program.
Our audit disclosed no instances of non-compliance which are material to the Reno-Tahoe Airport
Authority’s financial statements.
We have issued an unmodified opinion, dated November 30, 2022 on the Reno-Tahoe Airport Authority’s
compliance for the passenger facility charge program.
Our audit disclosed no findings required to be reported under the provisions of the Passenger Facility
Charge Audit Guide for Public Agencies.
Findings Relating to the Financial Statements
Our audit disclosed no findings which are required to be reported in accordance with the Passenger Facility
Charge Audit Guide for Public Agencies.
Findings and Questioned Costs for the Passenger Facility Charge Program
Our audit disclosed no findings or questioned costs for passenger facility charge program as defined by
the Passenger Facility Charge Audit Guide for Public Agencies.
SCHEDULE OF PRIOR AUDIT PASSENGER FACILITY CHARGES
FINDINGS AND THEIR RESOLUTION
The prior year’s audit disclosed no findings required to be reported in accordance with the provisions of
the Passenger Facility Charge Audit Guide for Public Agencies.

Reno-Tahoe Airport Authority
P.O.Box 12490
Reno, NV 89510-2490
