
SOUTHWEST
BORDER SECURITY
Additional Actions
Needed to Better
Assess Fencing's
Contributions to
Operations and
Provide Guidance for
Identifying Capability
Gaps
Report to Congressional Requesters
February 2017
GAO-17-331
United States Government Accountability Office
United States Government Accountability Office
Highlights of GAO-17-331, a report to
congressional requesters
February 2017
SOUTHWEST BORDER SECURITY
Additional Actions Needed to Better
Assess
Fencing's Contributions to Operations and Provide
Guidance for Identifying Capability Gaps
What GAO Found
Border fencing is intended to benefit border security operations in various ways,
according to officials from the U.S. Border Patrol (Border Patrol), which is within
the Department of Homeland Security’s (DHS) U.S. Customs and Border
Protection (CBP). For example, according to officials, border fencing supports
Border Patrol agents’ ability to execute essential tasks, such as identifying illicit-
cross border activities. CBP collects data that could help provide insight into how
border fencing contributes to border security operations, including the location of
illegal entries. However, CBP has not developed metrics that systematically use
these, among other data it collects, to assess the contributions of border fencing
to its mission. For example, CBP could potentially use these data to determine
the extent to which border fencing diverts illegal entrants into more rural and
remote environments, and border fencing’s impact, if any, on apprehension rates
over time. Developing metrics to assess the contributions of fencing to border
security operations could better position CBP to make resource allocation
decisions with the best information available to inform competing mission
priorities and investments.
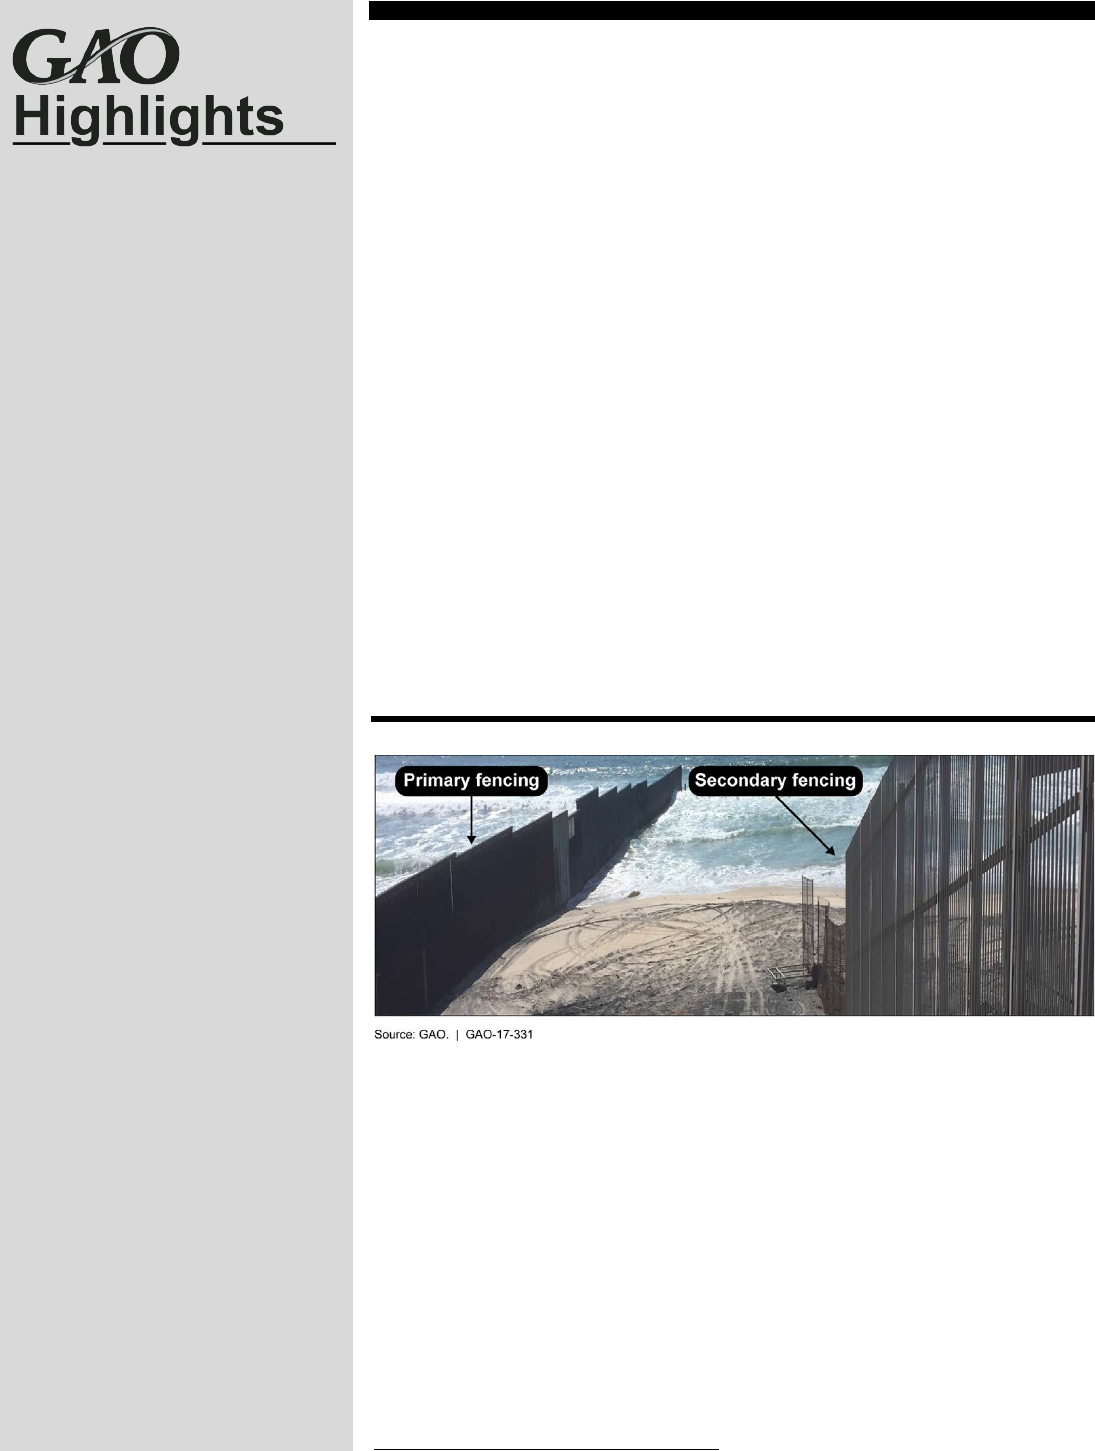
Pedestrian Fencing in San Diego, California, April 2016
CBP is taking a number of steps to sustain tactical infrastructure (TI) along the
southwest border; however, it continues to face certain challenges in maintaining
this infrastructure, such as addressing maintenance of roads owned or operated
by other public and private entities. In 2014, according to Border Patrol officials,
Border Patrol began implementing the Requirements Management Process that
is designed to facilitate planning for funding and deploying TI and other
requirements. Border Patrol headquarters and sector officials told GAO that
Border Patrol lacks adequate guidance for identifying, funding, and deploying TI
needs as part of this process. In addition, officials reported experiencing some
confusion about their roles and responsibilities in this process. Developing
guidance on this process would be consistent with federal internal control
standards and would provide more reasonable assurance that the process is
consistently followed across Border Patrol. This is a public version of a For
Official Use Only—Law Enforcement Sensitive report that GAO issued in
December 2016. Information DHS deemed For Official Use Only—Law
Enforcement Sensitive has been redacted.
View GA O-17-331. For more information,
contact Rebecca Gambler at (202) 512-8777
Why GAO Did This Study
In fiscal years 2013 through 2015,
Border Patrol recorded a total of 2.1
million estimated known illegal entries
between ports of entry along the
southwest border. In an effort to secure
the border between ports of entry, CBP
spent approximately $2.4 billion
between fiscal years 2007 and 2015 to
deploy TI — fencing, gates, roads,
bridges, lighting, and drainage
infrastructure—along the nearly 2,000
mile southwest border.
GAO was asked to review the use of
border fencing along the southwest
border. In this report, GAO examines
(1) border fencing’s intended
contributions to border security
operations and the extent to which
CBP has assessed these contributions
and (2) the extent that CBP has
processes in place to ensure
sustainment and deployment of TI
along the southwest border and
challenges in doing so. GAO reviewed
CBP documentation and data and
interviewed officials in headquarters
and three southwest border locations.
These locations were selected based
on CBP’s extensive investments in TI
in such areas.
What GAO Recommends
GAO recommends that Border Patrol
develop metrics to assess the
contributions of pedestrian and vehicle
fencing to border security along the
southwest border and develop
guidance for its process for identifying,
funding, and deploying TI assets for
border security operations. DHS
concurred with the recommendations.

Page i GAO-17-331 Tactical Infrastructure
Letter 1
Background 7
Fencing Is Intended to Assist Agents in Performing Their Duties,
but Its Contributions to Border Security Operations Have Not
Been Assessed 20
CBP Manages TI Sustainment but Border Patrol Has Not Provided
Guidance on its Process for Identifying and Deploying TI 27
Conclusion 36
Recommendations for Executive Action 37
Agency Comments and Our Evaluation 37
Appendix I Descriptive Analysis of Selected Tactical Infrastructure (TI) and
Estimated Known Illegal Entries in Southwest Border Zones from
Fiscal Years 2013 Through 2015 40
Appendix II Objectives, Scope and Methodology 57
Appendix III Comments from the Department of Homeland Security 65
Appendix IV GAO Contact and Staff Acknowledgments 69
Tables
Table 1: Border Patrol Mission Essential Tasks 15
Table 2: Border Patrol Foundational Operational Capabilities
(FOC) 15
Table 3: Average Cost per Mile of Completed Southwest Border
Fence Replacement Projects, Fiscal Years 2011-2016 34
Figures
Figure 1: Total Miles of Primary Fencing on the Southwest Border,
Fiscal Years 2005 to 2015 9
Figure 2: Selected Designs of Pedestrian Fencing on the
Southwest Border 11
Contents

Page ii GAO-17-331 Tactical Infrastructure
Figure 3: Selected Designs of Vehicle Fencing and Other Tactical
Infrastructure on the Southwest Border 12
Figure 4: Border Patrol Sectors along the Southwest Border and
Border Stations and Zones in the Tucson Sector 14
Figure 5: U.S. Border Patrol’s Requirements Management
Process 17
Figure 6: U.S. Border Patrol’s Capability Gap Analysis Process 19
Figure 7: Select Methods used by Illegal Entrants to Defeat Border
Fencing on the Southwest Border 24
Figure 8: Fence Breach Due To Drive-Through Entry and
Subsequent Repair 30
Figure 9: Legacy Pedestrian Fencing in Sunland Park, New
Mexico, March 2016 31
Figure 10: Legacy Pedestrian Fencing in Sunland Park, New
Mexico, March 2016 32

Page iii GAO-17-331 Tactical Infrastructure
Abbreviations
BPETS Border Patrol Enforcement Tracking System
CBP U.S. Customs and Border Protection
CGAP Capability Gap Analysis Process
CTIMR Comprehensive Tactical Infrastructure Maintenance and
Repair
DHS Department of Homeland Security
EID Enforcement Integrated Database
FM&E Facilities Management and Engineering
FOCs Foundational Operational Capabilities
GPRA Government Performance and Results Act of 1993
IIRIRA Illegal Immigration Reform and Immigrant Responsibility
Act of 1996
METs Mission Essential Tasks
ORMD Operational Requirements Management Division
SPA Strategic Planning and Analysis Directorate
TI Tactical Infrastructure
W MS Work Management System
This is a work of the U.S. government and is not subject to copyright protection in the
United States. The published product may be reproduced and distributed in its entirety
without further permission from GAO. However, because this work may contain
copyrighted images or other material, permission from the copyright holder may be
necessary if you wish to reproduce this material separately.House of Representatives

Page 1 GAO-17-331 Tactical Infrastructure
441 G St. N.W.
Washington, DC 20548
February 16, 2017
Congressional Requesters
In fiscal years 2013 through 2015, U.S. Border Patrol (Border Patrol),
within the Department of Homeland Security’s (DHS) U.S. Customs and
Border Protection (CBP), recorded a total of 2.1 million estimated known
illegal entries
1
between ports of entry along the southwest border.
2
As the
agency responsible for securing U.S. borders to prevent acts of terrorism
and the unlawful movement of people, illegal drugs, and other contraband
across U.S. borders, CBP spent approximately $2.4 billion between fiscal
years 2007 and 2015 to deploy tactical infrastructure (TI)—fencing, gates,
roads, bridges, lighting, and drainage infrastructure—along the nearly
2,000 mile southwest border.
3
CBP now has the responsibility of
sustaining border TI over its lifetime—including 654 miles of primary
pedestrian and vehicular fencing and approximately 5,000 miles of
roads.
4
In 2009, CBP estimated that it would need to spend more than
$3.5 billion over the next 20 years on TI operations and maintenance to
1
Border Patrol defines estimated illegal entries as the total number of removable aliens
who were apprehended, in addition to the number of entrants who illegally crossed the
border but were not apprehended. We defined these illegal entries as estimated “known”
illegal entries to clarify that the estimates do not include illegal entrants for which Border
Patrol does not have reasonable indications of cross-border illegal activity.
2
Ports of entry are facilities that provide for the controlled entry into or departure from the
United States. Specifically, a port of entry is any officially designated location (seaport,
airport, or land border location) where DHS officers or employees are assigned to clear
passengers and merchandise, collect duties, and enforce customs laws, and where DHS
officers inspect persons entering or applying for admission into, or departing the United
States pursuant to U.S. immigration law.
3
See 6 U.S.C. § 211(a) (establishing CBP within DHS), (c) (enumerating CBP’s duties).
4
Pedestrian fencing is primarily intended to slow down and deter pedestrians from
crossing the border. Vehicle fencing, which is intended to resist vehicles engaged in drug
trafficking and alien smuggling operations, is typically used in rural or isolated locations
that have a low occurrence of illegal pedestrian traffic. In March 2016 we reported that 652
miles of fencing were deployed on the southwest border. See GAO, Southwest Border
Security: Additional Actions Needed to Assess Resource Deployment and Progress,
GAO-16-465T (Washington, D.C.: Mar. 1, 2016). CBP has conducted an in depth review
of geospatial data on fencing and adjusted its estimate of deployed primary border fencing
to 654 miles.
Letter

Page 2 GAO-17-331 Tactical Infrastructure
sustain these investments and to ensure TI continues to support Border
Patrol’s mission.
5
Our prior work on TI highlighted DHS’s increased investment in TI and the
challenges associated with increased construction and deployment of
fencing on the southwest border. In September 2009, we found that CBP
had not assessed TI’s impact on border security operations or mission
goals and had not measured the effectiveness of TI.
6
Specifically, we
found that CBP had not accounted for the impact of its investment in
border fencing and infrastructure on border security. We recommended
that CBP conduct an evaluation of the impact of TI on effective control of
the border.
7
You requested that we review the use of border fencing along the
southwest border. In this report, we examine (1) border fencing’s intended
contributions to border security operations and the extent to which CBP
has assessed these contributions and (2) the extent that CBP has
processes in place to ensure sustainment
8
and deployment of TI along
the southwest border and challenges in doing so. In addition, in Appendix
5
Cost information is based on CBP’s 2009 Life Cycle Cost Estimate (LCCE) for all TI,
which includes border fencing, roads, lighting, drainage, and vegetation control from 2009
to 2026. CBP officials stated that CPB is currently updating the LCCE and expects to
complete it by the end of fiscal year 2017.
6
GAO, Secure Border Initiative: Technology Deployment Delays Persist and the Impact of
Border Fencing Has Not Been Assessed, GAO-09-896 (Washington, D.C.: Sept. 9, 2009).
In response to our recommendation that CBP conduct an evaluation of the im pact of TI,
CBP developed interim metrics, and we closed the recommendation as implemented.
However, in November 2015, CBP reported that it had not completed or implemented
these interim metrics due to funding challenges. We discuss CBP’s efforts to develop
performance measures later in this report.
7
Prior to 2011, DHS used the number of border miles under “operational control”—also
referred to as effective control—as its goal and outcome measure for border security and
to assess resource needs to accomplish this goal. In 2012, Border Patrol transitioned to
achieving a “low risk border” as its goal and uses a variety of data to assess risk,
including: threats of cross-border terrorism, drug smuggling, illegal migration across
locations; integrating border security operations with those of other law enforcement
partners’ and developing rapid response capabilities to deploy the resources appropriate
to changes in threat.
8
For the purposes of this report, sustainment refers to the maintenance, repair, and new
construction of TI.

Page 3 GAO-17-331 Tactical Infrastructure
I we provide analyses of border fencing and total estimated known illegal
entries in each southwest border sector.
9
This report is a public version of the prior sensitive report that we
provided to you in December 2016.
10
DHS deemed some of the
information in the prior report as For Official Use Only—Law Enforcement
Sensitive, which must be protected from public disclosure. Therefore, this
report omits sensitive information on sustainment of TI and our analysis of
Border Patrol data on fencing and enforcement activities. Although the
information in this report is more limited in scope, it addresses the same
questions as the sensitive report. Also, the overall methodology used for
both reports is the same.
11
To examine border fencing’s intended contributions to border security
operations and the extent to which CBP has assessed these
contributions, we analyzed relevant documentation, including Border
Patrol’s State of the Border Risk Methodology, which Border Patrol uses
to assess risk across the southwest border, and documents identifying
CBP mission goals and objectives and related performance measures.
We also reviewed relevant acquisition documents that CBP developed
during the construction of TI across the southwest border. We interviewed
officials from Border Patrol’s Strategic Planning and Analysis (SPA)
Directorate, which is responsible for identifying risk along the southwest
border and the Operational Requirements Management Division (ORMD)
which is responsible for deploying operational requirements, including TI,
to mitigate these risks. During these interviews we focused on the
intended and actual contributions of border fencing in providing Border
Patrol agents with Foundational Operational Capabilities (FOC) and
assisting Border Patrol agents in executing their Mission Essential Tasks
9
Border Patrol divides responsibility for border security operations geographically among
nine sectors, each with its own headquarters. Each sector is further divided into varying
numbers of stations.
10
GAO, Southwest Border Security: Additional Actions Needed to Assess Fencing’s
Contributions to Operations and Provide Guidance for Identifying Capability Gaps,
GAO-17-167SU (Washington D.C.: Dec. 22, 2016).
11
This work was conducted prior to the issuance of the Executive Order related to border
security and immigration enforcement, which the President signed on January 25, 2017.
See Border Security and Immigration Enforcement Improvements, Exec. Order No.
13767, 82 Fed.Reg. 8793 (Jan. 30, 2017).

Page 4 GAO-17-331 Tactical Infrastructure
(MET).
12
For this objective, we also analyzed fence breaches by fence
design. To do this analysis, we obtained pedestrian fence breach data
from Border Patrol Facilities and Tactical Infrastructure (BPFTI) for fiscal
years 2010 through 2015. To assess the reliability of these data, we
reviewed how CBP collects and maintains breach data and found that the
data were sufficiently reliable for the purposes of our report. We then
analyzed the occurrences of breaches in modern compared to legacy
pedestrian fence designs.
13
We also discussed the limitations associated
with border fencing, including the methods employed by illegal entrants in
defeating border fencing, including breaches.
During our meetings with ORMD and SPA, we also focused on CBP’s
efforts to assess border fencing’s contributions to border security
operations, and the perceived challenges involved in conducting such an
assessment. We compared these efforts against criteria established in
our prior work on leading practices for performance management.
14
To
identify border fencing’s intended contributions to border security
operations at the sector level, we visited the El Paso, San Diego, and
Tucson Sectors. We selected these sectors for site visits due to CBP’s
extensive investments in TI in each sector over the years. Combined,
these sectors contain approximately 52 percent of all miles of primary
pedestrian fencing and 80 percent of all miles of vehicle fencing along the
southwest border. During these site visits, we interviewed Border Patrol
sector officials, agents selected by sector officials, and agents assigned
12
Border Patrol defines FOCs as the essential combinations of resources (personnel,
training, equipment, technology, and infrastructure) that provide Border Patrol agents with
the fundamental operational means by which to conduct their Mission Essential Tasks
(METs). Border Patrol defines the METs as a sequential set of discreet or unique tasks in
which Border Patrol agents must be proficient to execute their duties in the furtherance of
border security operations.
13
For the purposes of this report, we refer to any fencing designs used prior to CBP
implementing requirements of the Secure Fence Act of 2006 (Pub. L. No. 109-367, 120
Stat.2638) as “legacy” fencing and any fencing deployed subsequently as “modern”
fencing designs. In addition, all “landing mat” fencing—constructed of army surplus carbon
steel landing mats which were used to create landing s trips during the Vietnam War—is
considered “legacy” fencing design, regardless of when it was constructed.
14
GAO, Managing for Results: Enhancing Agency Use of Performance Information for
Management Decision Making, GAO-05-927 (Washington, D.C.: September 2009).

Page 5 GAO-17-331 Tactical Infrastructure
to various stations and zones within each sector.
15
Our interviews in each
sector focused on agents’ perspectives on border fencing’s specific
contributions to border security within each sector as well as the extent to
which border fencing has provided Border Patrol agents with the
capabilities border fencing was intended to provide, and the extent to
which border fencing assists Border Patrol agents in executing their
METs. We also collected information on other perceived benefits of
border fencing, including agent safety, as well as perceived limitations of
border fencing. While the information we obtained from our site visits
cannot be generalized to all Border Patrol sectors, it provided us with
insights about border fencing’s contribution to border security operations.
To determine the extent that CBP has processes in place to ensure
sustainment and deployment of TI along the southwest border and
challenges in doing so, we reviewed relevant documentation and
interviewed headquarters officials from CBP. Documents we reviewed
included contracts, which CBP uses to maintain and repair all TI assets
across the southwest border. To assess how CBP manages the
deployment of TI across the southwest border, we reviewed relevant
documentation from ORMD, which is responsible for executing Border
Patrol’s requirements management process and deploying TI, among
other assets, along the southwest border. These documents included
Border Patrol’s Capability Gap Analysis Process (CGAP) and the various
outputs of this process. We compared these documents against criteria
outlined in Standards for Internal Control in the Federal Government.
16
We also interviewed officials from BPFTI, which is responsible for
sustaining TI along the southwest border, and ORMD. Our interviews with
BPFTI officials focused on the program’s contracts and work plans,
oversight of contractors, the system that BPFTI uses to track and oversee
all TI related maintenance and repair work, and any challenges BPFTI or
contractors may face in sustaining TI along the southwest border. Our
interview with ORMD focused on Border Patrol’s process for identifying TI
requirements in each sector, prioritizing TI requirements across all nine
southwest border sectors, and allocating resources and deploying TI
15
Border Patrol has divided the southwest border into nine sectors. Each southwest
border sector is divided into varying numbers of stations, with agents assigned to patrol
defined geographic areas, or zones, within each station. Of these, zones that touch the
international border are known as border zones, while zones that do not touch the
international border are known as interior zones.
16
GAO, Standards for Internal Control in the Federal Government, GAO-14-704G
(Washington, D.C.: Sept. 2014).

Page 6 GAO-17-331 Tactical Infrastructure
solutions. During our site visits, we interviewed relevant BPFTI and
Border Patrol officials responsible for overseeing the sustainment of TI in
the sector. In these meetings, we discussed past and ongoing TI
projects–-including fence replacement projects and other major repairs-–
as well as any challenges the sectors face in sustaining the TI deployed
there. We also toured each sector’s TI inventory, which include
pedestrian and vehicle fencing, gates, roads, bridges, grates, and lighting.
In the El Paso and Tucson sectors, we visited segments of legacy
pedestrian fencing slated for replacement with more modern pedestrian
fencing.
To analyze the location of estimated illegal entries in conjunction with
border fencing, we obtained Border Patrol data on estimated known
illegal entries in border zones within each of the nine sectors along the
southwest border for fiscal years 2013 through 2015.
17
We also obtained
data on the location of CBP’s 654 miles of primary border fencing, by
fencing type, and design in each sector, and combined these two data
sets. Through this analysis, we were able to identify the (1) total
estimated known illegal entries, (2) estimated turn backs and got aways,
(3) estimated drive throughs and (4) apprehension rates for estimated
illegal entries in southwest border zones with border fencing, by fence
type, design, and zone coverage,
18
and in southwest border zones
without border fencing. We then used these data to create data tables for
each sector that visually display the results of our analysis. We assessed
the reliability of these data by interviewing knowledgeable CBP officials
on the limitations of these data and digital testing of these data. To
17
We obtained apprehension data for fiscal years 2013 through 2015 from the
Enforcement Integrated Database —a DHS-shared common database repository for
several DHS law enforcement and homeland security applications. We obtained data on
entrants who illegally crossed the border but were not apprehended either because they
crossed back to Mexico—”turn backs”—or continued traveling to the U.S. interior and
Border Patrol was no longer actively pursuing them—”got aways”—from the Border Patrol
Enforcement Tracking System. We obtained data on border crossings by motor vehicles—
”drive throughs” —from the same database. (The individuals involved in a “drive through”
are counted among apprehensions, turn backs, or got aways if agents are able to
ascertain the number of individuals in the vehicle.) Apprehension, turn back, and got away
data for fiscal years 2013 through 2015 were queried (i.e., obtained from relevant
databases) as of February 2016. We selected these data for fiscal years 2013 through
2015 because beginning fiscal year 2013, Border Patrol standardized how it collects and
records got aways and turn backs, which improved the reliability of these data.
18
For the purposes of this document, the term “zone coverage” refers to the extent to
which the border miles of a border zone are fenced. In our analysis, we classified border
zone coverage as follows: complete (100 percent) border fence coverage, partial border
fence coverage, or no border fence coverage.

Page 7 GAO-17-331 Tactical Infrastructure
assess the reliability of the sector fence data we collected, we reviewed
the data for any inconsistencies in fence mileage in each sector, by type
and design. As a result of our data reliability assessment, we determined
that both CBP’s estimated known illegal entry data and sector fence data
were sufficiently reliable for our intended use. For more information on
our scope and methodology for the sector data tables, see Appendix I.
Appendix II provides further details on our scope and methodology.
We conducted this performance audit from October 2015 to February
2017 in accordance with generally accepted government auditing
standards. Those standards require that we plan and perform the audit to
obtain sufficient, appropriate evidence to provide a reasonable basis for
our findings and conclusions based on our audit objectives. We believe
that the evidence obtained provides a reasonable basis for our findings
and conclusions based on our audit objectives.
The Illegal Immigration Reform and Immigrant Responsibility Act (IIRIRA)
of 1996, as amended, states that the Secretary of Homeland Security
shall take actions, as necessary, to install physical barriers and roads in
the vicinity of the border to deter illegal crossings in areas of high illegal
entry.
19
As originally enacted, IIRIRA also required the completion of a
triple-layer fence and road improvements along 14 miles of border near
San Diego, where Border Patrol had begun installing fence in the
1990s.
20
The Secure Fence Act of 2006 amended IIRIRA to require DHS
to construct at least two layers of reinforced fencing as well as physical
barriers, roads, lighting, cameras, and sensors on certain segments of the
southwest border in California, Arizona, New Mexico, and Texas.
21
Subsequently, the DHS Appropriations Act, 2008, rewrote the border
19
Illegal Immigration Reform and Immigrant Responsibility Act (IIRIRA) of 1996. Pub. L.
No. 104-208, div. C, tit. I, subtit. A, § 102(a), 110 Stat. 3009, 3009-554 (classified, as
amended at 8 U.S.C. § 1103 note).
20
IIRIRA § 102(b), 110 Stat. at 3009-554 to -555.
21
See Pub. L. No. 109-367, § 3, 120 Stat. 2638, 2638-2639. Under the Secure Fence Act
of 2006, the Secretary of Homeland Security is to achieve and maintain operational
control over the borders of the United States through surveillance activities and physical
infrastructure enhancements to prevent unlawful entry by aliens and facilitate CBP’s
access to the borders. See id. § 2, 120 Stat. at 2638 (classified at 8 U.S.C. § 1701 note).
Background
TI along the Southwest
Border

Page 8 GAO-17-331 Tactical Infrastructure
fencing requirements section of IIRIRA to require that DHS construct not
less than 700 miles of reinforced fencing along the southwest border
where fencing would be most practical and effective, and to provide for
the installation of additional physical barriers, roads, lighting, cameras,
and sensors to gain operational control of the southwest border.
22
GAO
has ongoing work on roads used by Border Patrol and plans to complete
this work in 2017.
From fiscal years 2005 through 2015, CBP increased the total miles of
primary border fencing on the southwest border from 119 miles to 654
miles—including 354 miles of primary pedestrian fencing and 300 miles of
primary vehicle fencing. With 654 miles of primary fencing currently
deployed, CBP officials have stated that CBP is in compliance with its
legal requirements for the construction of southwest border fencing based
on the substantial discretion provided to the Secretary of Homeland
Security to determine the appropriate placement of fencing.
23
Figure 1
shows the increase in the total miles of primary fencing on the southwest
border from fiscal years 2005 to 2015.
22
IIRIRA § 102(b), 110 Stat. at 3009-554 to -555, as amended by Pub. L. No. 110-161,
div. E, tit. V, § 564(a)(2)(B)(ii), 121 Stat. 1844, 2090-91 (2007) (classified at 8 U.S.C. §
1103 note). IIRIRA § 102(b), as amended, also gives the Secretary of Homeland Security
discretion to install TI in particular locations along the border, as deemed appropriate. Id.
23
See 8 U.S.C. § 1103 note (notwithstanding fencing requirements, DHS is not required to
install fencing or other resources in a particular location along the border, if the Secretary
of Homeland Security determines that the use or placement of such resources is not the
most appropriate means to achieve and maintain operational control over the border at
that location). See also United States v. Arizona, No. 2:10-cv-10-01413-SRB, Order
Granting Government’s Motion to Dismiss Counterclaims (D. Ariz. Oct. 21, 2011).

Page 9 GAO-17-331 Tactical Infrastructure
Figure 1: Total Miles of Primary Fencing on the Southwest Border, Fiscal Years
2005 to 2015
CBP used various fencing designs to construct the 654 miles of primary
pedestrian and vehicle border fencing including, for example, bollard, wire
mesh, and chain link style fencing designs. Border fencing designs have
developed over time from legacy designs used prior to CBP implementing
requirements of the Secure Fence Act of 2006, to subsequent modern
designs. In addition to the 654 miles of primary fencing, CBP has also
deployed additional layers of pedestrian fencing behind the primary
border fencing, including 37 miles of secondary fencing and 14 miles of
tertiary fencing.
24
CBP has also deployed other types of TI along the
southwest border with various purposes. For example, lighting along the
border is designed to further deter illegal activities. Roads and bridges
provide Border Patrol agents access to the border to interdict and
24
The first layer of fencing, the primary fence, may include both pedestrian and vehicle
fencing and is the first fence encountered when moving north from the border; the
secondary fence, located behind the primary fence, consists solely of pedestrian fencing;
and the third layer, or tertiary fence, is primarily used to delineate property lines rather
than deter illegal entries.

Page 10 GAO-17-331 Tactical Infrastructure
apprehend illegal entrants as well as supporting the maintenance and
construction of TI. Drainage systems and grates facilitate the
maintenance of roads and fences and can provide additional border
security. See figures 2 and 3 for examples of selected fencing types and
designs as well as other types of TI deployed at the border.
Page 11 GAO-17-331 Tactical Infrastructure
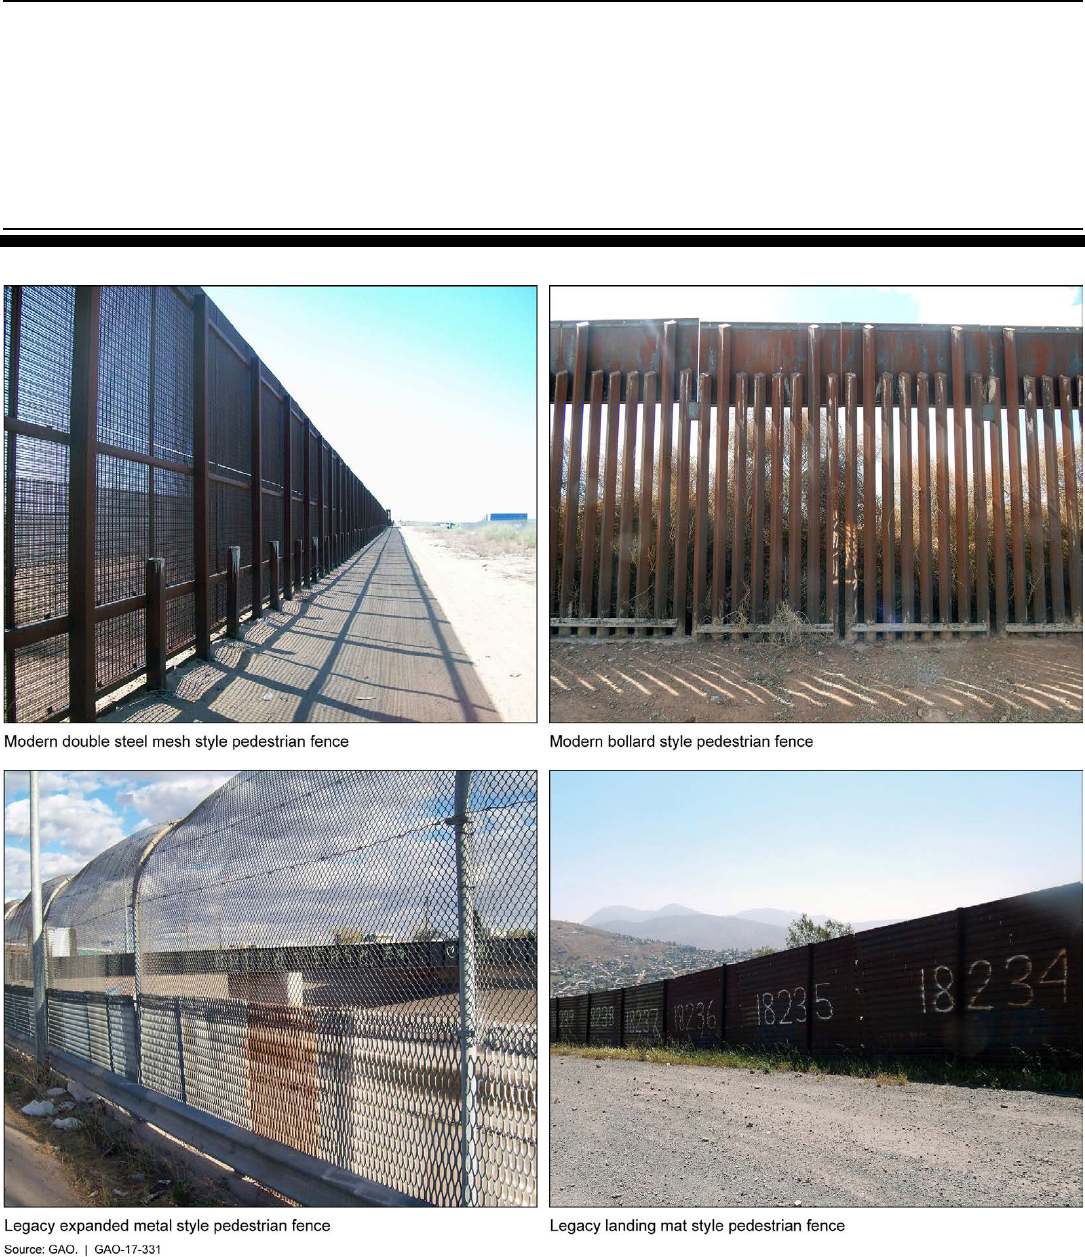
Figure 2: Selected Designs of Pedestrian Fencing on the Southwest Border
Note: For the purposes of this report, w e refer to any fencing constructed prior to Customs and
Border Protection implementing requirements of the Secure Fence Act of 2006 as “legacy” fencing
designs and any fencing deployed subsequently as having “modern” fencing designs. In addition, all
“landing mat” fencing—constructed of army surplus carbon steel landing mats w hich w ere used to

Page 12 GAO-17-331 Tactical Infrastructure
create landing strips during the Vietnam War—is considered “legacy” fencing, regardless of w hen it
w as constructed.
Figure 3: Selected Designs of Vehicle Fencing and Other Tactical Infrastructure on the Southwest Border

Page 13 GAO-17-331 Tactical Infrastructure
Note: For the purposes of this report, w e refer to any fencing constructed prior to Customs and
Border Protection implementing requirements of the Secure Fence Act of 2006 as “legacy” fencing
designs and any fencing deployed subsequently as having “modern” fencing designs.
Border Patrol, within CBP, is the federal agency with primary
responsibility for securing the national borders by detecting, interdicting,
and disrupting illegal cross-border activities between the designated U.S.
land border ports of entry.
25
To secure the nearly 2,000 mile southwest
border, Border Patrol divides responsibility for border security operations
geographically among nine sectors, as shown in figure 4. Each sector has
its own headquarters and is further divided into varying numbers of
stations, with agents assigned to patrol defined geographic areas, or
zones, within each station. According to Border Patrol officials, zones
allow sectors to more effectively analyze border conditions, including
terrain, when planning how to deploy agents. Zone dimensions are largely
determined by geography and topographical features, and zone size can
vary significantly.
25
See 6 U.S.C. § 211(e) (establishing and listing duties of U.S. Border Patrol within CBP).
Border Patrol Operations
along the Southwest
Border

Page 14 GAO-17-331 Tactical Infrastructure
Figure 4: Border Patrol Sectors along the Southwest Border and Border Stations and Zones in the Tucson Sector
Within each sector, station, and zone, Border Patrol agents’ primary
mission is to prevent terrorists and terrorist weapons from entering the
United States, and to detect, interdict, and apprehend those who attempt
to enter illegally or smuggle any person or contraband across the nation’s
borders. To accomplish this mission, Border Patrol agents must be
proficient in a sequential set of “Mission Essential Tasks” (METs) in order
to execute their duties in the furtherance of border security operations
(see table 1).

Page 15 GAO-17-331 Tactical Infrastructure
Table 1: Border Patrol Mission Essential Tasks
Predict
To anticipate and target illegal traffic actions prior to illegal entry
Detect
To discover the presence of a possible item of interest or suspected contraband
Identify
To determine whether an item of interest is human, animal, conveyance, or unknown
Classify
To determine the level of threat, risk, and/or intent of item of interest
Track
To follow the progress or movements of an item of interest
Respond
To dispatch or employ law enforcement resources to address a potential incursion
Resolve
To take final action, whether legal, administrative, or otherwise; capture data, and process information
Source: U .S. Border Patrol. | GAO-17-331
To assist agents in executing their METs, Border Patrol deploys various
resources, including surveillance technology and TI, to sectors, stations,
and zones. Each of these resources provides agents with the essential
operational capabilities necessary to execute each MET. Border Patrol
defines these capabilities as “Foundational Operational Capabilities”
(FOC) (see table 2).
Table 2: Border Patrol Foundational Operational Capabilities (FOC)
Impedance and Denial
Capability to impede border incursions and deny the threat’s use of terrain to their advantage in
conducting illegal activities or acts of terrorism.
Operational Mobility
Capability to gain and maintain access to Border Patrol areas of responsibility and rapidly move
Border Patrol resources at any time.
Domain Awareness/ Persistent
Surveillance
Ability to continuously detect, identify, classify, and track all border incursions in targeted areas
at all times.
Logistics and Manpower/ Support
and Sustainment
Ability to maintain, mature, refine, and integrate various capabilities to meet Border Patrol
mission and statutory requirements.
Command, Control,
Communications, and Coordination
Capability to effectively use and coordinate Border Patrol resources during operations.
Intelligence and Counter-
intelligence
Capability to produce and disseminate timely, well-formulated, and actionable intelligence
concerning border security threats and prevent threat organizations from gathering intelligence
against Border Patrol.
Security Partnerships
Capability to harness the political, social, economic, information, infrastructure, and technology
assets of the border area to enhance national security.
Source: U .S. Border Patrol. | GAO-17-331
Note: FOCs are current as of May 2016. At the time of our review , Border Patrol of ficials told us they
w ere in the process of updating the FOCs.
According to Border Patrol officials, TI facilitates the capabilities for
“impedance and denial” and “operational mobility.” Border fencing,
including pedestrian and vehicle fencing, is intended to facilitate the
“impedance and denial” FOC by diverting and delaying illegal entries.

Page 16 GAO-17-331 Tactical Infrastructure
Patrol roads and bridges are intended to facilitate the “operational
mobility” FOC by enabling agents to efficiently traverse their areas of
responsibility. Other resources that Border Patrol deploys, including
surveillance technology, facilitate domain awareness, and do so by
providing persistent surveillance capabilities along the border. According
to Border Patrol officials, agents require the appropriate combination of
resources in each sector, station, and zone to facilitate each FOC and
ensure agents can successfully execute their METs. Due to variations in
terrain and local population density, among other factors, the appropriate
combination of these resources may vary across sectors, stations, and
zones.
To assess cross-border threats, Border Patrol collects and analyzes data
on the number and types of entrants who illegally cross the southwest
border between the land border ports of entry. These data include
estimates of the total number of directly or indirectly observed—or
“known”—illegal entries by sector, station, and zone. Estimated known
illegal entries consist of the total number of illegal entrants who were
apprehended, in addition to the number of entrants who illegally crossed
the border but were not apprehended—”turn backs” and “got aways.”
26
Border Patrol also collects data on the number of vehicles that illegally
cross the border, known as “drive throughs”.
From fiscal year 2007 to 2015, CBP spent approximately $2.4 billion on TI
on the southwestern border—about 95 percent, or $2.3 billion was spent
on constructing pedestrian and vehicle fencing.
27
In addition, CBP officials
reported that TI operations and maintenance requirements totaled
approximately $450 million during this same period. We reported in 2009
that the average cost per mile for primary pedestrian fencing was $6.5
million and $1.8 million per mile for vehicular fencing; according to CBP’s
26
Border Patrol began mandating the collection of longitude and latitude coordinates for all
apprehensions in May 2009, and in September 2012, Border Patrol standardized the
collection of turn back and got away data.
27
CBP officials stated CBP did not track funding for acquisition and sustainment for border
fencing prior to implementation of the Secure Fence Act of 2006.
Costs of Acquiring,
Constructing, and
Sustaining TI

Page 17 GAO-17-331 Tactical Infrastructure
2016 rough order of magnitude estimate, these averages remain the
same.
28
CBP estimates that the cost for secondary fencing is approximately $4.2
million per mile but CBP officials identified several limitations of this
estimate. First, due to their limited experience in constructing secondary
fencing, CBP officials noted that they have not constructed sufficient
secondary fencing to use historic costs to estimate an average cost per
mile of the fencing. Currently, around 37 miles, or six percent of the total
654 miles of primary fencing, are backed up by secondary pedestrian
fencing. In addition, CBP officials stated that constructing secondary
fencing in a location with existing primary fencing may result in additional
costs not accounted for in their estimates, such as land acquisition,
removing existing structures, and utility relocations.
According to Border Patrol officials, in 2014, Border Patrol began
implementing the Requirements Management Process. This new process
is designed to facilitate planning in order to fund and deploy TI and other
operational requirements, such as surveillance technology for border
security operations. The Requirements Management Process consists of
six steps as shown in figure 5.
Figure 5: U.S. Border Patrol’s Requirements Management Process
• The initial step requires Border Patrol to identify mission priorities and
goals by analyzing relevant strategic DHS, CBP, and Border Patrol
goals, missions, and objectives from applicable guidance and policies.
In this initial step, the state of the threat is also assessed.
28
GAO-09-896. Cost per mile estimates for primary and secondary fence construction
includes labor, construction and supply chain, planning/oversight, environmental planning,
design, and real estate planning, but does not include the cost of real estate acquisition
including litigation costs, environmental mitigation costs, unforeseen site conditions,
relocation of utilities, removal or retirement of existing structures, and market fluctuations
(e.g. increased fuel costs, labor, raw materials) as well as any other costs not explicitly
stated as included in the estimate.
Border Patrol’s
Requirements
Management Process

Page 18 GAO-17-331 Tactical Infrastructure
• The second step is Mission Analysis. This step is designed to assess
the delta between Border Patrol’s capabilities against currently known
and anticipated threats in order to determine capability gaps in Border
Patrol mission essential tasks. Border Patrol Agents are encouraged
to participate in this step by recommending potential solutions—such
as tactical infrastructure or technology—to mitigate capability gaps.
• The third step—Planning—involves, among other things, determining
potential requirements that may address the identified capability gaps
for funding consideration. To conduct this step, Border Patrol officials
examine the identified capability gaps in detail and determine courses
of action and initial capability requirements. These initial capability
requirements are documented in a sector-specific Initial Requirements
Document.
• The fourth step—Execution—involves Border Patrol executing
courses of action. Border Patrol officials stated that courses of action
are recommended options for Border Patrol commanders and
executives to select and implement. Once implemented, these options
are expected to resolve identified capability gaps in operations,
according to Border Patrol officials.
• The fifth and sixth steps of the process—Assessment and Lifecycle
Management—involve implementing and monitoring solutions to
determine the ability of the requirement to resolve capability gaps and
sectors providing feedback on how the solutions affect border security
operations.
The initial activity to complete step two of the Requirements Management
Process is the Capabilities Gap Analysis Process (CGAP). The CGAP is
intended to identify each station’s capability gaps by determining the
difference between a station’s baseline capabilities and a station’s
required set of capabilities needed to perform mission essential tasks.
The identified shortfall in required capability is a capability gap.
After identifying capability gaps, Border Patrol agents assigned to each
sector are to identify potential solutions to solve or mitigate each gap. For
example, in 2015, as part of the CGAP, agents identified additional
maintenance and repair as a solution where patrol roads were in poor
condition and negatively affected agents’ ability to respond and resolve
illicit activity. Other solutions to capability gaps may include adjustments
to the technologies or personnel deployed in a specific area. For fiscal
year 2015, Border Patrol conducted the CGAP and identified potential
solutions in all nine southwest sectors, according to Border Patrol
officials. Identified solutions and their corresponding capability gaps are to

Page 19 GAO-17-331 Tactical Infrastructure
be documented in Station Capability Gaps Analysis Reports. Figure 6
outlines the steps of the CGAP, and describes an example using the
steps of the CGAP to identify a capability gap and solution.
Figure 6: U.S. Border Patrol’s Capability Gap Analysis Process
Border Patrol officials stated that sectors may request additional TI and
other requirements for border security operations to address capability
gaps not included in the documented CGAP. Officials stated that
additional capability gaps may be identified by sectors or stations during
the course of border security operations that were not captured at the
time a station conducted the process. Border Patrol officials stated that
when stations identify these capability gaps and a need exists for a
requirement to address the capability gap, the station is required to
submit documentation to Border Patrol Headquarters in order for the
requirement to be approved, funded, and subsequently deployed.
According to Border Patrol officials, this documentation should include (1)
the identified capability gap and (2) the new or additional TI or other
requirement and how it addresses the identified capability gap.

Page 20 GAO-17-331 Tactical Infrastructure
According to CBP officials, pedestrian and vehicle fencing have benefited
border security operations in various ways as intended, by (1) supporting
Border Patrol agents’ ability to execute essential tasks; (2) improving
agent safety; and (3) reducing vehicle incursions.
Supporting Agents’ Ability to Execute Mission Essential Tasks.
According to Border Patrol officials, pedestrian fencing is intended to
divert illegal entrants–which include migrants and criminal organizations
that engage in illicit cross-border activities–to areas of the border where
agents can execute their METs and interdict illicit-cross border activities
more effectively.
29
Border Patrol officials told us that populated urban
environments offer an advantageous setting for illegal entrants because
they require only seconds to minutes to blend in with the local U.S.
community after crossing the border. By constructing pedestrian fencing
in more populated urban environments, Border Patrol officials stated that
DHS intended to divert illicit cross-border activities into more remote or
rural environments, where illegal entrants may require hours or days to
reach the nearest U.S. community. For example, Border Patrol officials in
the San Diego sector told us that from 1994 to present, pedestrian
fencing, along with investments in manpower and surveillance
technology, assisted in diverting a large share of illicit cross-border
activity away from the densely populated urban areas near San Diego
and into more rural and remote environments east of the city. Officials
told us that these rural and remote environments east of San Diego
provide an advantage to agents assigned there since they have more
29
For the purposes of this report, illicit cross-border activity refers to any activity in which
people or goods, such as narcotics, money, or weapons, illegally enter the United States.
Fencing Is Intended
to Assist Agents in
Performing Their
Duties, but Its
Contributions to
Border Security
Operations Have Not
Been Assessed
CBP Has Identified the
Intended Benefits of
Pedestrian and Vehicle
Fencing to Border Security
Operations

Page 21 GAO-17-331 Tactical Infrastructure
time to detect, identify, classify, track, respond and resolve the illicit
cross-border activities that occur there. Similarly, Border Patrol officials in
the Tucson sector told us that bollard pedestrian fencing in urban areas
has helped divert much of the illicit cross-border activities that occurred
there into more rural and remote environments where agents are better
able to interdict these activities.
Agents assigned to the Nogales station—within the Tucson sector—told
us that bollard pedestrian fencing has helped divert illicit cross-border
activities away from the City of Nogales and into more rural and remote
areas.
In addition to diverting illicit cross-border activities into more rural and
remote environments, pedestrian fencing is intended to serve as a
physical barrier that impedes and slows the progress of illegal entrants
who attempt to cross the border, and in doing so, provides Border Patrol
agents assigned to these areas additional time and opportunities to
execute their METs, which include detecting, responding, and resolving
illicit cross-border activities. Border Patrol agents in the El Paso sector
told us that pedestrian fencing deployed in the sector’s urban border
environments has assisted in improving agents’ ability to execute their
METs, resulting in higher apprehension rates in these areas. These
agents told us that urban border environments, such as the border
between downtown El Paso from Ciudad Juarez, offer an ideal crossing
point for illegal entrants because they can quickly blend in with the local
U.S population, reach a safe house, or obtain transportation after
crossing the border. However, these agents told us that the primary,
secondary, and tertiary pedestrian fencing that separate downtown El
Paso and Ciudad Juarez have been effective in slowing the progress of
illegal entrants who attempt to cross in this area and providing agents
with additional time to detect, respond, and resolve the illicit cross-border
activities that occur there.
Improving Agent Safety. Border Patrol officials we spoke with in the El
Paso, Tucson, and San Diego sectors stated that modern pedestrian
fencing, including bollard style fencing, improves agent safety during
operations. Specifically, San Diego sector officials told us that modern
style pedestrian fencing reduces illegal entrants’ ability to stage mass
crossings, which can overwhelm agents and jeopardize agents’ safety.
According to Border Patrol officials in the Tucson sector, bollard fencing
has helped reduce agent assaults because this fencing provides agents
with a clear line of sight into Mexico and makes it more difficult for illegal
entrants to ambush agents. These officials told us that older fence

Page 22 GAO-17-331 Tactical Infrastructure
designs, including landing mat fencing, obstruct agents’ line of sight into
Mexico and provided illegal entrants and other individuals in Mexico with
cover and the ability to conceal their location along the border. They
explained that individuals on the Mexican side of the border would
regularly use the landing mat fence to launch surprise assaults on agents
by hurling projectiles, including rocks, from behind it. Border Patrol
officials reported that after replacing legacy landing mat fencing with
bollard pedestrian fencing in the Nogales station, ambushes and assaults
declined. Specifically, Border Patrol officials told us they recorded 376
assaults on agents in the Nogales station in 2010 and 2011, two years
prior to constructing modern bollard pedestrian fencing. In 2012 and
2013, two years following construction, assaults on agents in the Nogales
station dropped to 71, a decline of 81 percent.
Reducing Illicit Vehicular Border Incursions. Vehicle fencing is
intended to serve as a physical barrier that slows and prevents vehicles
engaged in drug trafficking and human smuggling operations from
crossing the border, also known as drive throughs. Vehicle fencing is
typically deployed in more rural and remote environments where criminal
organizations engaged in trafficking and smuggling are more likely to use
vehicles to shorten the time they are at risk of being encountered by
Border Patrol agents. Border Patrol officials in the El Paso and Tucson
sectors told us that they experienced significant decreases in drive
throughs following the deployment of vehicle fencing. Officials in the
Tucson sector reported that vehicle fencing deployed improved Border
Patrol agents’ ability to impede and deny the entry of large amounts of
illegal narcotics transported by motorized vehicles. Officials reported that
rural land tracts within the sector provided criminal organizations with
large areas to traffic narcotics and engage in other illicit cross-border
activities. Border Patrol officials reported that after deploying vehicle
fencing in these areas, drive throughs dropped by an average of 73
percent. Although Tucson sector officials stated vehicle fencing has been
effective in slowing and prohibiting drive throughs, vehicle fencing is not
designed to slow or deter illegal entrants from entering or smuggling
contraband into the United States on foot.
In addition to citing the benefits of pedestrian and vehicle fencing, Border
Patrol officials and agents also identified the various methods used by
illegal entrants to exploit border fencing’s limitations in their attempts to
defeat it. Agents we spoke with in the El Paso and Tucson sectors
explained that one of the most common methods employed by illegal
entrants involves cutting openings, or breaches, in pedestrian and vehicle
Border Patrol Agents
Identified Various
Limitations with Border
Fencing

Page 23 GAO-17-331 Tactical Infrastructure
fencing. Once breached, illegal entrants can cross through the fence or
smuggle people and contraband into the United States. Between fiscal
years 2010 and 2015, CBP recorded a total of 9,287 breaches in
pedestrian fencing. According to our analysis of these data, illegal
entrants breached legacy pedestrian fencing at an average rate of 82
breaches per fence mile, compared to an average of 14 breaches per
fence mile of modern pedestrian fencing.
30
Agents we spoke with in the El Paso sector explained that creating
breaches in legacy pedestrian fencing requires less effort compared to
modern designs, and can be done using bolt or pipe cutters. In addition,
these agents also described observing illegal entrants cutting and
dragging sections of vehicle fencing off the border and illegally entering
the United States in vehicles. Agents we spoke with in the Tucson sector
also told us that while pedestrian fencing is generally easier to breach,
they have also observed breaches in more modern fence designs,
including bollard fence, which agents stated were cut using portable
power tools.
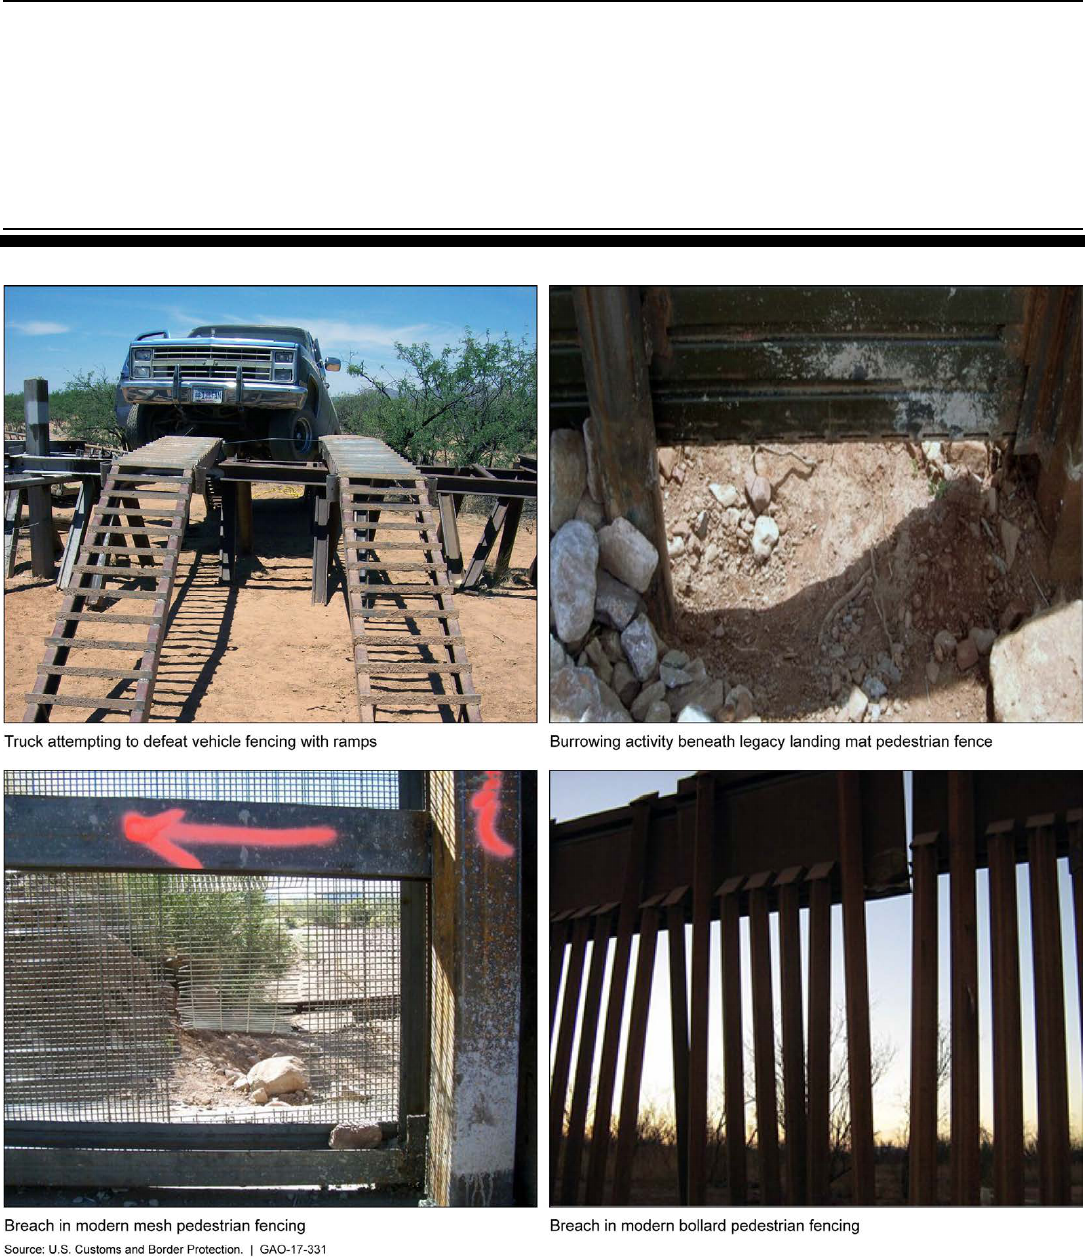
Agents we spoke with in these sectors also described witnessing illegal
entrants defeating border fencing through other methods. For example,
agents we spoke with in the Tucson sector told us they have witnessed
illegal entrants attempting to use ramps to drive vehicles up and over
vehicle fencing in the sector as well as burrowing under legacy pedestrian
fencing, as shown in figure 7. In addition, agents in the Tucson sector
stated that illegal entrants scale the taller pedestrian fencing designs,
such as bollard fencing. In contrast, agents we spoke with in the San
Diego sector stated that some segments of legacy fencing are low and
that they have witnessed illegal entrants jumping over the fence. Other
methods used to defeat border fencing described to us by Border Patrol
agents include using small aircraft to transport contraband over
pedestrian fencing and into the United States and building subterranean
tunnels from Mexico into the United States.
31
30
DHS deemed that specific details about the number of breaches for pedestrian fencing
to be sensitive; therefore, we did not include this information in this report.
31
We have ongoing work on selected smuggling threats along the southwest border,
which include subterranean, aerial, and maritime methods used to smuggle contraband
into the United States. We plan to report on the results of our work in 2017.
Page 24 GAO-17-331 Tactical Infrastructure
Figure 7: Select Methods used by Illegal Entrants to Defeat Border Fencing on the Southwest Border

Page 25 GAO-17-331 Tactical Infrastructure
CBP takes steps to identify intentional destruction or exploitation of
border fencing, including breaches, burrows, and tunnels, and addresses
them when they occur. For example, Border Patrol officials we met with in
the El Paso sector told us that agents regularly identify breaches in
border fencing during patrols. Once identified, agents notify the
appropriate Border Patrol officials at the station and sector level, who in
turn schedule the necessary repair work through one of CBP’s
maintenance and repair contracts, which we discuss later in this report.
CBP collects data that could be useful to assessing the contributions of
border fencing to border security operations at the sector level, but has
not conducted such an assessment. According to CBP, from fiscal year
2007 through 2015, it spent approximately $2.3 billion to deploy border
fencing along the southwest border, and CBP will need to spend a
substantial amount to sustain these investments over their lifetimes. CBP
did not provide a current life-cycle costs estimate to maintain pedestrian
and vehicle fencing, however, in 2009 CBP estimated that maintaining
fencing would cost more than $1 billion over 20 years.
32
Despite these
investments, CBP cannot measure the contribution of fencing to border
security operations along the southwest border because it has not
developed metrics for this assessment. According to CBP officials, CBP
suspended its efforts to measure the contributions of border fencing to
border security in 2013 due to sequestration related funding shortfalls.
CBP officials also stated that border fencing is a part of a system of
capabilities, including Border Patrol agents, surveillance technology, and
other TI, and as a result, developing metrics for a single element of this
system is challenging.
Although CBP does not have metrics to assess the contributions of
border fencing, it does collect data on the location of illegal entries that
can provide insight into where these illegal activities occurred in relation
to the various designs of pedestrian and vehicle fencing at the zone level.
For example, CBP collects data on apprehensions, turn backs, got
aways, and drive throughs, and border fencing, by type and design. CBP
could potentially use these data to develop metrics that compare
estimated known illegal entries before and after fence construction. CBP
could also use these data to help determine the extent to which border
32
CBP’s 2009 Life Cycle Cost Estimate (LCCE) estimated operations and maintenance
costs for fencing would be approximately $1.4 billion from 2009 to 2029.
CBP Has Not Assessed
Pedestrian or Vehicle
Fencing’s Contributions to
Border Security
Operations Along the
Southwest Border

Page 26 GAO-17-331 Tactical Infrastructure
fencing contributes to diverting illegal entrants into more rural and remote
environments as well as border fencing’s impact on apprehension rates
over time However, CBP has not developed metrics that systematically
use these data, or other available information, to assess the contributions
of border fencing to border security operations along the southwest
border. We used these data to conduct a descriptive analysis on (1) the
total estimated known illegal entries, (2) estimated drive throughs, (3)
estimated turn backs and got aways, and (4) apprehension rates of
estimated illegal entries in southwest border zones with border fencing,
by fence type, design, and zone coverage, and in southwest border zones
without border fencing. See Appendix I for more detailed information on
our analysis.
These data, in combination with information on other factors that affect
the location of illegal entries and agents’ ability to predict, detect, identify,
classify, and resolve illicit cross-border activities, could help CBP gain
insight into the contributions of pedestrian and vehicle fencing to border
security operations. For example, the locations of apprehensions, turn
backs, got aways, and drive throughs with the various types and designs
of fencing at the sector and zone level in conjunction with information on
geography, demographics, staffing, technology, and other TI, could help
CBP assess the contributions of border fencing to border security
operations as well as current and future fencing deployments and
replacement projects in light of other resource allocation priorities.
Past GAO reports on leading practices for performance management
have noted that agencies can use performance information to make
decisions that affect future strategies, planning and budgeting, identifying
priorities, and allocating resources.
33
These leading practices also note
that outcome-based performance information should be used for the
allocation of resources and in deciding among competing priorities in a
results oriented management system. We have also found that linking
cost with performance information infuses performance concerns into
planning and budgetary deliberations, prompting agencies to reassess
their performance goals and strategies to more clearly understand the
cost of performance. Performance information also allows program
managers to compare results with goals and thus determine where to
target resources to improve performance.
33
GAO, Managing for Results: Enhancing Agency Use of Performance Information for
Management Decision Making, GAO-05-927 (Washington, D.C.: September 2009).

Page 27 GAO-17-331 Tactical Infrastructure
Developing metrics that can help CBP measure the contributions of
fencing to border security operations along the southwest border, could
better position CBP to make these and other resource allocation
decisions without the best available information to inform competing
mission priorities and investments, such as additional manpower and
surveillance technologies. An assessment of border fencing’s
contributions to border security operations could help position CBP to
identify the cost effectiveness of border fencing compared to other assets
the agency deploys, including Border Patrol agents and various
surveillance technologies. This information would also help position CBP
to justify continued investments in border fencing and, if needed, help
CBP identify future investment priorities, and more effectively target
public resources.
CBP contracts with private contractors who provide sustainment
services— maintenance, repair, and new construction—for TI in the nine
southwest border sectors, which are subdivided into four maintenance
and repair work areas. In providing these sustainment services,
contractors are tasked with identifying and performing routine TI
maintenance and repair requirements, which are classified in five general
categories – (1) fences and gates, (2) roads and bridges, (3) drainage
and grates, (4) lighting and electrical, and (5) vegetation control and
debris removal. Contractors record these requirements in work plans and
submit them to Border Patrol for approval. Once Border Patrol approves
the work plan, the contractors complete the approved TI maintenance and
repair requirements, such as blading a degraded road or clearing and
removing vegetation.
CBP and contractors are to classify maintenance and repair requirements
in each category as urgent or routine. Routine maintenance and repair
CBP Manages TI
Sustainment but
Border Patrol Has Not
Provided Guidance
on its Process for
Identifying and
Deploying TI
CBP Manages the
Sustainment of TI and Has
Taken Steps to Mitigate
Challenges

Page 28 GAO-17-331 Tactical Infrastructure
includes work that is required due to normal wear and tear, deterioration
due to age, and other damage to TI assets not caused by severe weather
events or intentional sabotage. For example, TI contractors may
reposition and upgrade lighting used to illuminate operational areas along
the southwest border. In addition, contractors are to perform routine
maintenance on patrol roads that erode and degrade over time due to
weather and wear and tear caused by the Border Patrol agents who use
them. However, Border Patrol agents from sectors we visited identified
several challenges in sustaining TI, including:
Addressing Maintenance and Repair of Roads on Other Public or
Private Lands. Border Patrol has authority to use public roads owned or
operated by federal, state or local, and tribal entities, as well as certain
privately owned roads, for border security operations.
34
However, sector
officials stated that they face challenges in addressing maintenance and
repair of these roads. Specifically, sector officials in two sectors we visited
told us that it may take time to secure an agreement providing for
maintenance of some roads needed to conduct border security
operations. In addition, sector officials stated that in instances where
portions of a single road have different owners, CBP must enter into
separate agreements with each owner. Officials in one sector stated that
these challenges may hinder CBP’s ability to address maintenance of
roads in a timely manner for use in border security operations.
Funding for TI Sustainment Requirements. CBP has funding allocated
for addressing TI sustainment requirements; however, CBP must
prioritize its requirements to make best use of available funding, and it
can take time to address all requirements. For example, officials in one
sector we visited stated that an increase in its inventory of surveillance
technology has been accompanied by the construction of new roads,
which adds to the sector’s TI inventory. In order to address this increase
in TI inventory, CBP and sector officials stated that they prioritize
maintenance and repair of roads and other requirements in each work
plan based on funding availability and how these requirements affect
border security operations. CBP officials told us that the contractor and
34
See 23 U.S.C. § 101(a)(22), which defines a “public road” as any road or street under
the jurisdiction of and maintained by a public authority and open to public travel. In
addition, Border Patrol is statutorily authorized to, without a warrant, access private lands
(but not dwellings) within 25 miles of the border, for the purpose of patrolling the border to
prevent illegal entry of aliens (see 8 U.S.C. § 1357(a)(3)); and CBP may seek to establish
agreements with private landowners to use, and in certain instances address maintenance
and repair of, their property in furtherance of border security operations.

Page 29 GAO-17-331 Tactical Infrastructure
CBP develop and communicate the work plan to sector officials. Sector
officials then review the work plan and prioritize maintenance and repair
that are critical to border security operations and communicate these
updates to CBP officials for execution. Sector officials in one sector stated
that in general, roads that are critical to border security operations are
prioritized over roads that are less used by agents. Sector officials in this
sector also stated that continually prioritizing the maintenance and repair
of certain roads over others can result in degraded roads in the sector.
Officials in this sector also stated that the use of degraded roads in border
security operations increases the wear and tear on patrol vehicles and
increases the cost of maintaining these vehicles.
While CBP and Border Patrol officials stated they prioritize routine
maintenance requirements that are most critical to border security
operations, contractors are also required to address urgent repair
requirements. Urgent repair requirements are typically the result of severe
weather events or intentional damage to TI assets. CBP requires
contractors to address these requirements within a 24-hour period to
mitigate any negative effects on border security operations. For example,
CBP classifies breaches to fencing, grates, or gates as urgent and
requires immediate repair because, according to Border Patrol officials,
breaches increase illegal entrants’ ability to enter the country unimpeded.
According to Border Patrol officials, the majority of urgent TI repairs on
the southwest border are fence breaches. From fiscal year 2010 through
fiscal year 2015 CBP recorded a total of 9,287 breaches in pedestrian
fencing at an average cost of $784 per breach to repair. Figure 8 shows
an example of a fence breach and subsequent repair.

Page 30 GAO-17-331 Tactical Infrastructure
Figure 8: Fence Breach Due To Drive-Through Entry and Subsequent Repair
While contractors provide routine maintenance and address urgent
repairs on TI, certain TI assets used by Border Patrol become degraded
beyond repair and must be replaced. For example, in the Yuma sector,
Border Patrol officials identified portions of primary legacy pedestrian
fencing that had become so degraded by illegal entrants digging
underneath the fencing and land erosion in the area that it required
additional support to remain erect. In addition, Border Patrol officials in
the El Paso sector stated that while CBP provides routine maintenance
and repair services to the primary legacy pedestrian fencing in Sunland
Park, New Mexico, significant weather events have eroded the foundation
of the fencing. In addition, the erosion in the area has caused damage to
nearby roads used by agents to conduct border security operations.
Sector officials identified, and we observed, primary legacy pedestrian
fencing that leans toward Mexican territory and that required additional
support to prevent the fencing from collapsing. Sector officials noted that
that due to the erosion and terrain in the area, they have been limited in
their repair efforts. See figure 9.

Page 31 GAO-17-331 Tactical Infrastructure
Figure 9: Legacy Pedestrian Fencing in Sunland Park, New Mexico, March 2016
In addition, sector officials identified, and we observed, other primary
legacy pedestrian fencing in Sunland Park, New Mexico, where debris
had accumulated on the Mexican side of the border, reducing the overall
height of the fencing to approximately two feet in certain areas. Officials
told us that the fencing is located three feet from the official U.S. border
and that conducting maintenance on the fencing would require debris
removal machinery that would encroach into Mexican territory. See
figure 10.

Page 32 GAO-17-331 Tactical Infrastructure
Figure 10: Legacy Pedestrian Fencing in Sunland Park, New Mexico, March 2016
Sector officials stated that the condition of the fencing in Sunland Park,
New Mexico, negatively affects border security operations due to its
proximity to populated urban areas on both sides of the border, among
other factors. Border Patrol officials in the El Paso sector stated that the
degraded fencing is located approximately one quarter of a mile from an
urban area on the U.S. side of the border where illegal entrants can
quickly obtain transportation and blend in with the local U.S. population.
While in general, agents stated they have seconds to minutes to interdict
illegal entrants in urban areas, sector officials and agents stated that the
condition of the fencing reduces the time agents have to interdict illicit
cross-border activity because the degraded fencing does not slow down
the progress of illegal entrants. As a result, sector officials stated the
sector deploys additional manpower in the area in order to conduct
effective border security operations.

Page 33 GAO-17-331 Tactical Infrastructure
In addition, sector officials stated that modern pedestrian fencing in
downtown El Paso, Texas, had diverted illegal entrant activity to Sunland
Park, New Mexico, where the primary legacy pedestrian fencing is
compromised. El Paso sector officials stated that while the Sunland Park,
New Mexico, area of operations has the greatest amount of illegal activity
in the El Paso sector, the condition of the primary legacy pedestrian
fencing does not achieve its intended purpose of slowing the progress of
illegal entrants. In addition to the fencing in Sunland Park, Border Patrol
has identified other degraded primary legacy fencing along the southwest
border, such as the Yuma and Tucson sectors.
To address degraded legacy pedestrian fencing, CBP is replacing this
fencing with more modern, bollard style fencing. For example, in fiscal
year 2015, CBP began the process of replacing 1.4 miles of existing
primary pedestrian fencing in Sunland Park, New Mexico—within the El
Paso sector—with new bollard style pedestrian fencing. The fence
replacement project also entails constructing a widened and elevated
patrol road adjacent to the fence and the installation of culverts designed
to mitigate the effects of severe weather events in the area. CBP
estimates the fence replacement project will cost approximately $13.41
million with a planned completion date in May 2017.
35
In addition, in fiscal
year 2016, CBP began removing and replacing an estimated 7.5 miles of
legacy primary pedestrian fencing with modern bollard style fencing in
Naco, Arizona, within the Tucson sector. CBP estimates this fence
replacement project will cost $44.7 million, at an estimated cost of
approximately $6 million per mile of replacement fencing.
In addition to the ongoing fence replacement projects, from fiscal years
2011 through 2016, CBP completed four fence replacement projects that
replaced 14.1 miles of primary pedestrian legacy fencing in the Tucson
and Yuma sectors with modern bollard style pedestrian fencing, at a total
cost of approximately $68.26 million and an average cost of $4.84 million
per mile of replacement fencing. See table 4.
35
CBP noted that the estimated completion date is tentative, due to a contract protest.

Page 34 GAO-17-331 Tactical Infrastructure
Table 3: Average Cost per Mile of Completed Southwest Border Fence Replacement Projects, Fiscal Years 2011-2016
Name of Fence
Replacement Project
Sector
a
Miles Replaced
Total Cost (millions)
Average Cost
Per Mile (millions)
Nogales
Tucson
2.8
$19.19
$6.85
Douglas I
Tucson
6.1
$25.41
$4.16
Douglas II
Tucson
3.4
$15.86
$4.61
San Luis
Yum a
1.8
$7.80
$4.33
Total
14.1
$68.26
$4.84
Source: U .S. Customs and Border Pr otection. | GAO-17-331
a
Border Patrol divides responsibility for border security operations geographically among nine sectors,
each w ith its ow n headquarters.
Prior to 2014, Border Patrol headquarters and sector officials stated that
Border Patrol’s process for identifying, funding, and deploying TI
requirements entailed Border Patrol stations and sectors identifying TI
requirements and providing written justification to Border Patrol
headquarters for review. Border Patrol Headquarters officials reviewed
the justification. If approved, the TI requirement was funded and deployed
by CBP. For example, El Paso sector officials stated that sector officials
provided Border Patrol headquarters written justification documenting the
need for a fence replacement project in the Sunland Park, New Mexico,
for seven years. Border Patrol approved the identified need and in fiscal
year 2015 CBP began implementing the Sunland Park fence replacement
project.
In 2014, Border Patrol began implementing the Requirements
Management Process that, among other things, is intended to identify
capability gaps in border security operations and identify solutions to
those capability gaps, including TI. In addition, the process also identifies
maintenance and repair solutions such as road improvements that may
improve Border Patrol’s operational mobility. Border Patrol has
documented the process, including the steps involved in the process.
However, Border Patrol has not developed written guidance on this
process, including how officials are to use the information and analyses
resulting from the process when requesting TI for deployment purposes.
For example, following the implementation of the Process in fiscal year
2015, Border Patrol provided the sectors with the Capability Gap Analysis
Report that contained the identified capability gaps in the sector and the
agent identified solutions for resource and planning purposes, according
to Border Patrol Headquarter officials.
Border Patrol Lacks
Documented Guidance on
the Requirements
Management Process

Page 35 GAO-17-331 Tactical Infrastructure
However, sector officials we visited varied in their understanding of the
process documentation, including how to use the documentation to inform
sector planning. For example, using the analyses recorded in the
Capability Gap Analysis Report, the Tucson sector identified a capability
gap in its operations—a seasonal river bed in the San Pedro River in
Naco, Arizona—that impeded Border Patrol’s capability to gain access to
the area after heavy rains. In addition, sector officials used the analyses
to identify solutions to the capability gap and began researching options
to improve agents’ access to the area. In contrast, Border Patrol officials
at another sector we visited were unaware of the analysis included in the
Capabilities Gap Analysis Report or how to use the analyses to inform
sector planning. Officials in another sector we visited noted that while
they received the Capabilities Gap Analysis Report and stated that
capability gaps identified in the report would help stations better
understand where limitations in border security operations exist, agents
need more guidance about how to use the analyses in the report for
resource allocation decisions. Further, officials in two sectors we visited
noted that guidance on the process would be helpful in terms of how to
use the capability gap documentation to identify TI requirements for
deployment purposes.
In addition to the confusion with the process cited by sector officials,
Border Patrol headquarters officials in the Law Enforcement Operations
Directorate—the office within Border Patrol responsible for making TI
resource decisions, according to Border Patrol officials—were not aware
of their roles and responsibilities in the process. Officials within the
Directorate told us that as of March 2016 they had not received
documentation of the process and cited the Operational Requirements
Based Budget Process, and not the Requirements Management Process,
as the current process for Border Patrol sectors and stations to use when
identifying TI and other requirements for funding and deployment
purposes.
36
According to the Standards for Internal Control in the Federal
Government, program managers should document responsibilities
36
The Operational Requirements Based Budget Process is Border Patrol’s standardized
national planning process that links sector- and station-level planning, operations, and
budgets. This process documents how sectors identify and justify their requests to achieve
effective control of the border in their area of responsibility, and enables Border Patrol to
determine how the deployment of resources, such as technology, infrastructure, and
personnel, can be used to secure the border.

Page 36 GAO-17-331 Tactical Infrastructure
through policies and procedures and communicate these policies and
procedures so that personnel can implement control activities for their
assigned responsibilities.
37
Border Patrol headquarters officials confirmed
that in 2014, when Border Patrol transitioned to the new Requirements
Management Process, they prioritized implementing the new process
ahead of developing relevant guidance on roles and responsibilities for
headquarters and sector staff responsible for executing each step in the
process. While Border Patrol officials noted that the process is new and
they plan to take steps to improve it, such as developing an online
module that will host policy and guidance on the process, one sector we
visited has already used the outputs of the process for decision making
and planning purposes. In addition, two of the three sectors we visited
noted that guidance would improve sector and station understanding of
the process as well as how to use the outputs for planning purposes. As
Border Patrol continues to take steps to implement its process for
identifying TI and other assets for border security operations, providing
guidance to the appropriate officials within Border Patrol would help
provide reasonable assurance that steps within the process are followed.
In addition, developing and implementing written guidance on the
remaining steps of the process reduces the risk of relevant agency
officials lacking the information to perform their appropriate role in the
process.
According to CBP, from fiscal year 2007 to 2015, CBP spent
approximately $2.3 billion to deploy border fencing along the southwest
border, and CBP will need to spend a substantial amount to sustain these
investments over their lifetimes. Given these costs, developing metrics
that measure the contributions of pedestrian and vehicular fencing to
border security operations as part of a system of capabilities along the
southwest border would provide Border Patrol with the best information
available to inform and justify future investments in these assets against
competing priorities and other investment opportunities. Further, as
Border Patrol continues to take steps to implement its requirements
management process for identifying TI and other operational
requirements for border security operations, providing guidance to the
appropriate officials within Border Patrol would help ensure that steps
within the requirements process are followed by Border Patrol officials,
37
GAO, Standards for Internal Control in the Federal Government, GAO-14-704G
(Washington, D.C.: September 2014).
Conclusion

Page 37 GAO-17-331 Tactical Infrastructure
and that they are clear about their roles and responsibilities in the
process.
To ensure Border Patrol has the best available information to inform
future investments in TI and resource allocation decisions among TI and
other assets Border Patrol deploys in the furtherance of border security
operations, and to ensure that key parties within Border Patrol’s
Requirements Management Process are aware of their roles and
responsibilities within the process, we recommend that the Chief of the
Border Patrol:
• Develop metrics to assess the contributions of pedestrian and vehicle
fencing to border security along the southwest border using the data
Border Patrol already collects and apply this information, as
appropriate, when making investment and resource allocation
decisions; and
• Develop and implement written guidance to include roles and
responsibilities for the steps within its requirements process for
identifying, funding, and deploying tactical infrastructure assets for
border security operations.
We provided a draft of this report to DHS for review and comment. In its
written comments, which are reproduced in full in appendix III, DHS
concurred with the two recommendations and described actions planned
to address them. DHS also provided technical comments that we
incorporated, as appropriate.
With regard to the first recommendation to develop metrics to assess the
contributions of pedestrian and vehicle fencing to border security along
the southwest border using the data Border Patrol already collects, DHS
concurred and stated that it planned to develop and incorporate metrics
into Border Patrol’s Requirements Management Process. According to
DHS, it plans to develop metrics by December 2017 and update the
Requirements Management Process to include these metrics by March
2018. With regard to the second recommendation to develop and
implement written guidance to include roles and responsibilities within the
Requirements Management Process, DHS concurred and stated that it
plans to update the Requirements Management Process and, as part of
that update, plans to add communication and training methods and tools
to better implement the Process. DHS plans to complete these efforts by
Recommendations for
Executive Action
Agency Comments
and Our Evaluation

Page 38 GAO-17-331 Tactical Infrastructure
September 2019. These actions, if implemented effectively, should
address the intent of our recommendations.
We are sending copies of this report to the appropriate congressional
committees, the Secretary of Homeland Security, and other interested
parties. In addition, the report is available at no charge on the GAO
website at http://www.gao.gov.
If you or your staff have any questions, please contact me at (202) 512-
8777 or gamblerr@gao.gov. Contact points for our Offices of
Congressional Relations and Public Affairs may be found on the last page
of this report. GAO staff who made significant contributions to this report
are listed in appendix IV.
Rebecca Gambler
Director, Homeland Security and Justice

Page 39 GAO-17-331 Tactical Infrastructure
List of Requesters
The Honorable Ron Johnson
Chairman
The Honorable Claire McCaskill
Ranking Member
Committee on Homeland Security and Governmental Affairs
United States Senate
The Honorable Thomas R. Carper
Ranking Member
Permanent Subcommittee on Investigations
Committee on Homeland Security and Governmental Affairs
United States Senate
The Honorable John Cornyn
United States Senate
The Honorable Michael T. McCaul
Chairman
The Honorable Bennie G. Thompson
Ranking Member
Committee on Homeland Security
House of Representatives
The Honorable Martha McSally
Chairwoman
Subcommittee on Border and Maritime Security
Committee on Homeland Security
House of Representatives

Appendix I: Descriptive Analysis of Selected
Tactical Infrastructure (TI) and Estimated
Known Illegal Entries in Southwest Border
Zones from Fiscal Years 2013 Through 2015
Page 40 GAO-17-331 Tactical Infrastructure
To provide a concise descriptive overview of border fencing and other
tactical infrastructure (TI) in each border sector, we developed a profile
for each sector along the southwest border and for the border as a whole.
These profiles contain information about TI in each sector with a focus on
border fencing as well as other data, such as geographic information and
an analysis of estimated known illegal entries in the sector from fiscal
years 2013 through 2015.
As part of its border security operations, U.S. Customs and Border
Protection (CBP) deploys border fencing across nine sectors along the
southwest border. Each border sector has its own headquarters and is
further divided into varying numbers of stations, with agents assigned to
patrol defined geographic areas, or zones, within each station. Of these,
zones that touch the international border are known as border zones,
while zones that do not touch the international border are known as
interior zones. Zone dimensions are largely determined by geography and
topographical features, and zone size can vary significantly.
Each border zone has a unique combination of border fencing types,
designs, and coverage. Border fencing types include pedestrian fencing,
which is primarily intended to slow down and deter pedestrians from
crossing the border, and vehicle fencing, which is intended to resist
vehicles engaged in drug trafficking and alien smuggling operations and
is typically used in rural or isolated locations that have a low occurrence
of illegal pedestrian traffic. For the purposes of this report, we refer to any
fencing designs used prior to CBP implementing requirements of the
Secure Fence Act of 2006 as “legacy” fencing designs and any fencing
designs deployed subsequently as “modern” fencing designs.
1
In addition,
all “landing mat” fencing—constructed of army surplus carbon steel
landing mats which were used to create landing strips during the Vietnam
War—is considered a “legacy” fencing design, regardless of when it was
constructed. Zone “coverage” refers to the presence and extent of border
fencing in a border zone. In our analysis, we classified border zone
coverage as follows: complete (100 percent) border fence coverage,
partial border fence coverage, or no border fence coverage.
Border Patrol collects data on the number of entrants who illegally cross
the southwest border between the land border ports of entry. These data
1
Pub. L. No. 109-367, 120 Stat. 2638.
Appendix I: Descriptive Analysis of Selected
Tactical Infrastructure (TI) and Estimated
Known Illegal Entries in Southwest Border
Zones from Fiscal Years 2013 Through 2015
Overview

Appendix I: Descriptive Analysis of Selected
Tactical Infrastructure (TI) and Estimated
Known Illegal Entries in Southwest Border
Zones from Fiscal Years 2013 Through 2015
Page 41 GAO-17-331 Tactical Infrastructure
include estimates on the total number of directly or indirectly observed—
or “known”—illegal entries by sector and zone.
2
Estimated known illegal
entries consist of the total number of illegal entrants who were
apprehended, in addition to the number of entrants who illegally crossed
the border but were not apprehended either because they crossed back
to Mexico—”turn backs”—or continued traveling to the U.S. interior and
Border Patrol was no longer actively pursuing them—”got aways.” Border
Patrol also collects data on the number of vehicles that illegally cross the
border, known as “drive throughs”.
3
To show each border zone’s unique
combination of border fencing in conjunction with estimated known illegal
entries, we analyzed Border Patrol data to determine, for each border
zone, the (1) total estimated known illegal entries, (2) total estimated drive
throughs, (3) estimated turn backs and got aways, and (4) apprehension
rates for estimated known illegal entries.
The following profiles of each southwest border sector and the southwest
border as a whole are meant to provide a concise descriptive overview of
border fencing and TI in each border sector. Each profile presents sector-
specific data on geography, border zones, miles of fencing and patrol
roads, staffing levels, spending on fencing operations and maintenance,
and relative number of estimated known illegal entries in border zones; a
map highlighting sector boundaries and urban areas; and a chart
illustrating fencing layers as of September 2016. Each profile includes a
table, based on CBP data, showing estimated known illegal entries, drive
throughs, turn backs and got aways, and apprehension rates for fiscal
years 2013 through 2015 by the type of primary fencing (pedestrian or
vehicle), design of primary fencing (legacy or modern), and coverage of
primary fencing (complete, partial, or none) in the border zone where
Border Patrol agents recorded the apprehension or observation. A brief
narrative describing the data in the table is also included.
The descriptive information in the following sector profiles was compiled
from a variety of CBP sources. We obtained information on the number of
agents assigned to each sector from the U.S. Border Patrol (Border
2
We defined these illegal entries as estimated “known” illegal entries to clarify that the
estimates do not include illegal entrants for which Border Patrol does not have reasonable
indications of cross-border illegal activity.
3
“Drive throughs” are border crossings by a motor vehicle, often carrying drugs. The
individuals involved in a “drive through” are counted among apprehensions, turn backs, or
got aways if agents are able to ascertain the number of individuals in the vehicle.
Methodology for
Developing Sector Profiles

Appendix I: Descriptive Analysis of Selected
Tactical Infrastructure (TI) and Estimated
Known Illegal Entries in Southwest Border
Zones from Fiscal Years 2013 Through 2015
Page 42 GAO-17-331 Tactical Infrastructure
Patrol) as of September 25, 2015. We obtained information on patrol
roads and on the extent of primary, secondary, and tertiary fencing in
each sector as of fiscal year 2016 from CBP’s Facilities Maintenance and
Engineering office (FM&E). To assess the reliability of CBP’s road and
fencing data, we reviewed how CBP collects and maintains these data
and found them sufficiently reliable for our intended use. Finally, we
obtained information on the number of sector zones and geographic
information included in sector maps from Border Patrol and located the
data geographically using Mapinfo.
To analyze estimated known illegal entries in border zones in relation to
border fencing, we obtained apprehension, turn back, got away, and drive
through data by sector and zone for fiscal years 2013 through 2015 from
DHS and Border Patrol databases—apprehension data came from the
Enforcement Integrated Database (EID) and turn back, got away, and
drive through data came from the Border Patrol Enforcement Tracking
System (BPETS).
4
In addition, we also obtained sector map data
identifying the border zones in each sector from Border Patrol and data
identifying the location of legacy and modern pedestrian and vehicle
fencing along the border from the Border Patrol Facilities and Tactical
Infrastructure (BPFTI) Office. Merging data on the location of border
zones in each sector and the location of fencing allowed us to categorize
each border zone according to the design, type, and coverage of fencing
in the border zone, including “mixed” categories for border zones where
CBP deployed a mixture of legacy and modern fencing or a mixture of
pedestrian and vehicle fencing. We then combined this border zone
fencing data with the estimated known illegal entry data for border zones
to determine the (1) total estimated number of known illegal entries, (2)
drive throughs, (3) turn-backs and got-aways in border zones, and (4)
apprehension rates in border zones with border fencing, by fence design,
type and zone coverage, and in border zones without border fencing. We
focus our analysis on border zones rather than interior zones. (For a more
detailed description of our scope and methodology, see Appendix II.)
4
EID is a Department of Homeland Security-shared common database repository for
several DHS law enforcement and homeland security applications. Data on
apprehensions are held in the EID; data on turn backs, got aways, drive throughs are held
in BPETS.

Ap
pendix I: Descriptive Analysis of Selected
Tactical Infrastructure (TI) and Estimated
Known Illegal Entries in Southwest Border
Zones from Fiscal Years 2013 Through 2015
Page 43 GAO-17-331 Tactical Infrastructure
The data in the tables included in the following profiles is descriptive and
do not establish or suggest causation between border fencing and the
total estimated known illegal entries, estimated drive throughs, estimated
turn backs and got aways, or apprehension rates of estimated illegal
entries. Conclusions regarding the contributions of fencing to Border
Patrol’s efforts to secure the border cannot be formed solely on the basis
of the location of apprehensions, turn backs, got aways, and drive
throughs relative to the location of various types and designs of fencing.
For example, at the sector level, the data displayed in the following
profiles show differences in estimated known illegal entries, turn backs
and got aways, and estimated apprehension rates for border zones with
the same types and design of fencing, indicating that other factors
affected the number of known illegal entries and apprehension rates
recorded in those zones. In fiscal years 2013 through 2015, for example,
agents in the Yuma sector had an apprehension rate of 81 percent in
border zones that were completely covered by modern pedestrian
fencing, while agents in the El Paso sector had an apprehension rate of
17 percent in border zones that were completely covered by modern
pedestrian fencing. Within the Tucson sector, agents recorded 169 known
drive throughs in border zones with vehicle fencing, whereas in the El
Centro sector, agents recorded 25 drive throughs in border zones with
vehicle fencing. Furthermore, despite no change in the miles of primary
pedestrian fencing on the southwest border between fiscal years 2011-
2015, total southwest border apprehensions ranged from approximately
328,000 to 479,000.
Other factors, including terrain, geography, demographics, Border Patrol
agent manpower, and surveillance technology along the southwest
border, may affect the location of illegal entries and agents’ ability to
predict, detect, identify, classify, track, respond, and resolve illicit cross-
border activities. For example, according to Border Patrol officials,
entrants in some border zones may be apprehended before reaching any
border fencing in zones where primary border fencing is not located on
the border. In the Rio Grande sector, for example, about 30 percent of all
primary border fencing miles in the sector are located more than half a
mile from the border. In other cases, entrants may make no attempt to
evade Border Patrol, choosing to turn themselves in to Border Patrol
agents, according to officials. For example, according to CBP officials,
while the Rio Grande Valley sector had an apprehension rate of 56
percent in fiscal years 2013 through 2015, in fiscal year 2014 the sector
experienced a spike in illegal entries consisting largely of unaccompanied
children and adults with children, many of whom turned themselves in to
Scope and Data
Limitations of Sector
Profiles

Appendix I: Descriptive Analysis of Selected
Tactical Infrastructure (TI) and Estimated
Known Illegal Entries in Southwest Border
Zones from Fiscal Years 2013 Through 2015
Page 44 GAO-17-331 Tactical Infrastructure
Border Patrol agents without attempting to evade security or defeat
fencing.
We determined that there were no significant data reliability issues with
CBP apprehension data that affect our use for the purposes of this report.
However, CBP has identified some potential limitations concerning drive
through, turn back, and got away data. To identify and report estimated
known illegal entries, Border Patrol agents use various sources of
information, including direct agent observation, referrals from credible
sources (such as local residents), camera monitoring, and detection of
physical evidence left by migrants (such as footprints). Border Patrol’s
estimate of illegal entries does not include estimates of illegal entries for
which Border Patrol does not have reasonable support, such as the
number of illegal entries conducted through illicit cross-border tunnels. As
a result, the estimated illegal entry data reported by Border Patrol for
fiscal years 2013 through 2015 may not represent all illegal entries across
the southwest border during that period. Furthermore, according to
Border Patrol officials, agents’ ability to obtain accurate or consistent data
using these identification sources depends on various factors, such as
terrain and weather. For example, data on turn backs and got aways may
be understated in areas with rugged mountains and steep canyons that
can hinder detection of illegal entries. In other cases, data may be over or
understated—for example, in cases where the same turn-back identified
by a camera is also identified by footprints.
We determined the data were sufficiently reliable for the purposes of our
descriptive analysis. Border Patrol uses these data, among other data, to
assign risk scores to each sector, which informs resource deployments.
Border Patrol also uses these data to calculate the “Interdiction
Effectiveness Rate,” which is a performance metric used by the agency to
evaluate progress toward meeting its border security goal(s) consistent
with the Government Performance and Results Act (GPRA) of 1993, as
updated by the GPRA Modernization Act of 2010.
5
Nonetheless, CBP
officials said that they did not consider the data sufficiently reliable to
5
GPRA, Pub. L. No. 103-62, 107 Stat. 285 (1993), was updated by the GPRA
Modernization Act of 2010, Pub. L. No. 111-352, 124 Stat. 3866 (2011). CBP reports the
“Interdiction Effectiveness Rate” as a GPRA measure, and calculates this figure by
dividing apprehensions + turn backs, by apprehensions + turn backs + got aways. While
GPRA is applicable to the department or agency level, performance goals and measures
are important management tools applicable to all levels of an agency, including the
program, project, or activity level, consistent with leading practices and internal controls
related to performance monitoring.

Appendix I: Descriptive Analysis of Selected
Tactical Infrastructure (TI) and Estimated
Known Illegal Entries in Southwest Border
Zones from Fiscal Years 2013 Through 2015
Page 45 GAO-17-331 Tactical Infrastructure
compare results from one sector to another due to various challenges in
estimating known entries such as differences in local demographics,
geography, staffing, and technology in each sector. However, according
to CPB, the data were sufficiently reliable to compare zones within each
sector, and to compare sectors against a border-wide summation of these
data.

Source: U.S. Customs and Border Protection; MapInfo (map). | GAO-17-331
United States
Mexico
Brownsville
Matamoros
McAllen
Reynosa
Nuevo Laredo
Laredo
Piedras Negras
Ciudad
Acuña
El Paso
Sunland Park
Ciudad
Juarez
Las Cruces
Nogales
Tucson
Nogales
Yuma
Mexicali
San Luis
Rio Colorado
San Diego
Tijuana
State line
Sector boundary
State name
Sector name
U.S.city
Mexican city
Border
California Nevada Arizona New Mexico
Texas
Oklahoma
San Diego
Yuma
Big Bend
El Paso
Tucson
El Centro
Del Rio
Laredo
Rio Grande Valley
Legend
Southwest Border
Land border / river border
Land area
Border zones / interior zones
Primary fencing
Patrol roads
Agents assigned
Funds obligated for tactical infrastructure
operations and maintenance (FY 2015)
Total estimated known illegal entries in
southwest border zones (FYs 2013-2015)
Border prole
696 / 1,295 miles
893,480 square miles
214 / 441
654 miles
4,904 miles
17,522
$43.4 million
1.3 million
Border overview
As of 2015, approximately one third (33 percent) of the
nearly 2,000 mile southwest border is covered by primary
pedestrian and vehicle fencing. Of the 354 miles of
primary pedestrian fencing currently deployed, 82 percent
(291 miles) have modern designs and 18 percent (63
miles) have legacy designs. Of the 300 miles of vehicle
fencing deployed, 75 percent (225 miles) have modern
designs and 25 percent (75 miles) have legacy designs.
About six percent of all primary fencing is backed up by
secondary fencing and about four percent of primary and
secondary fencing is backed up by tertiary fencing. The
approximately 37 miles of secondary fencing and 14
Tertiary layer
Secondary layer
Primary layer
Percentage covered
0 20 40 60 80 100
Source: GAO analysis of U.S. Customs and Border Protection data. | GAO-17-331
Legacy pedestrian
Modern pedestrian
Legacy vehicle
Modern vehicle
No fence
Percentage of sector border miles covered by fencing,
by layer, type, and design (September 2016)
Source: GAO. | GAO-17-331
Southwest border map
Note: FY: Fiscal Year. Zone counts are as of Sept. 2015; miles and
layers of fencing, Sept. 2016; patrol roads, Nov. 2015; agents assigned,
Sept. 2015 (includes sector and Special Operations Group staff).
Source: U.S. Customs and Border Protection. | GAO-17-331
Page 46
GAO-17-331 Tactical Infrastructure

Funds obligated for tactical infrastructure operations
and maintenance on the southwest border in scal
year 2015
Percent of total estimated known illegal entries
recorded in southwest border zones in scal years
2013-2015, by sector
Tucson
1%
Big Bend
Rio Grande
Valley
40%
1% Yuma
29%
9%
4% Del Rio
4% El Centro
5% El Paso
7% San Diego
Laredo
Source: GAO analysis of U.S. Customs and Border Protection data. | GAO-17-331
San Diego
1%
Big Bend
Tucson
28%
3% Laredo
15%
14%
4% Del Rio
El Centro
Rio Grande
Valley
El Paso
Yuma17%
9%
9%
Source: U.S. Customs and Border Protection data. | GAO-17-331
miles of tertiary fencing currently deployed are located
primarily in three border sectors: San Diego, El Paso,
and Yuma. All secondary and tertiary fencing is legacy
pedestrian fencing. Approximately 90 percent of primary
border fencing on the southwest border is located in the
ve western-most sectors, with the remaining 10 percent
of primary fencing located in the four eastern-most sectors
where the majority of the border is delineated by the Rio
Grande River.
Border Patrol uses approximately 4900 miles of
operational patrol roads, 29 percent of which are roads
owned by U.S. Customs and Border Protection (CBP)
or on federal land where CBP has obtained the right to
perform maintenance and repair work. The other two-thirds
of operational patrol roads are on non-federal lands that
CBP has the right to maintain or repair through a license or
permit.
Our analysis was conducted at the zone level. Of the 214
border zones across all nine sectors, about 73 percent
have at least some fencing. Approximately seven percent
of southwest border zones are completely covered by
pedestrian fencing and one southwest border zone is
completely covered by vehicle fencing.
In scal year 2015, CBP obligated an estimated
$43.3 million for tactical infrastructure operations and
maintenance on the southwest border. CBP obligated an
estimated 28 percent of these funds ($12.1 million) for
the Tucson sector, where 25 percent of southwest border
patrol roads and 30 percent of southwest border fencing
are located.
In scal years 2013 through 2015, CBP recorded
approximately 1.3 million estimated known illegal entries
in southwest border zones, with the Rio Grande Valley
(40 percent), Tucson (29 percent), and Laredo (9 percent)
sectors recording the most entries.
Page 47
GAO-17-331 Tactical Infrastructure

Fencing overview
San Diego, California
Total estimated known
illegal entries
Estimated known
drive throughs
Estimated known turn
backs and got aways
Apprehension rate
of estimated known
entrants
Primary fence type (2015)
(number and percent of border zones) Number Percentage Number Number Percentage Percentage
No fence (3, 8%) 7,905 8 0 1,792 6 77
Pedestrian fence (PF) total (32, 82%) 86,000 89 14 29,172 91 66
Modern PF complete coverage (1, 3%) 2,761 3 0 660 2 76
Modern PF partial coverage (4, 10%) 11,341 12 0 3,025 9 73
Legacy PF complete coverage (3, 8%) 6,669 7 0 4,793 15 28
Legacy PF partial coverage (15, 38%) 44,746 46 12 15,240 48 66
Mixed PF complete coverage (1, 3%) 1,561 2 0 598 2 62
Mixed PF partial coverage (8, 21%) 18,922 19 2 4,856 15 74
Mixed PF and vehicle fence (VF) total (4, 10%) 3,266 3 0 1,120 3 66
Mixed PF/VF complete coverage (2, 5%) 1,680 2 0 583 2 65
Mixed PF/VF partial coverage (2, 5%) 1,586 2 0 537 2 66
Total (39, 100%) 97,171 100 14 32,084 100 67
The San Diego sector is one of the most densely populated areas
in the United States including the cities of San Diego (1.3 million)
and Tijuana and Tecate, Mexico (combined population of 1.7
million). Sector terrain includes beaches, coastal plains, steep
canyons and ravines, high desert, mountains over 6,000 feet in
elevation, and sparsely populated remote and rural wilderness
areas.
United States
Mexico
Sunland Park
Nogales
Tucson
Nogales
Yuma
Mexicali
San Luis
Rio Colorado
San Diego
Tijuana
California
Nevada
Arizona
San Diego
Yuma
Tucson
El Centro
San Luis
Rio Colorado
Legend
State line
Sector boundary
State name
Sector name
U.S. city
Mexican city
Border
Source: U.S. Customs and Border Protection; MapInfo (map). | GAO-17-331
Land border
Land area
Border zones / interior zones
Primary fencing
Patrol roads
Agents assigned
Funds obligated for tactical infrastructure
operations and maintenance (FY 2015)
Percentage of total estimated known illegal
entries in southwest border zones recorded in
the San Diego sector (FYs 2013-2015)
60 miles
56,830 square miles
39 / 89
46 miles
309 miles
2,430
$6.5 million
7 percent
Sector prole Sector map
Approximately seven percent of all miles of primary border fencing
and 30 percent of the miles of all secondary and tertiary fencing
along the southwest border are located in the San Diego sector.
Approximately 14 percent of the sector’s 39 border zones are
completely covered with modern or legacy pedestrian fencing. In
scal years 2013-2015, Border Patrol agents in the sector recorded
the majority of estimated known illegal entries (93 percent) and
got aways and turn backs (95 percent) in border zones with at
least some pedestrian fencing. Agents had the highest estimated
apprehension rate in the sector (77 percent) in zones with no
fencing. In the 15 border zones partially covered by legacy
pedestrian fencing, agents had an apprehension rate of 66 percent.
Estimated known illegal entries in border zones, by fencing type, design, and coverage, scal years 2013-2015
Percentage covered
0 20 40 60 80 100
Tertiary layer
Secondary layer
Primary layer
Source: GAO analysis of U.S. Customs and Border Protection data. | GAO-17-331
Note: Due to rounding, percentages may not total 100.
Legacy pedestrian
Modern pedestrian
Legacy vehicle
Modern vehicle
No fence
Percentage of sector border miles covered by
fencing, by layer, type, and design (September 2016)
Source: GAO analysis of U.S. Customs and Border Protection data. | GAO-17-331
Note: FY: Fiscal Year. Zone counts are as of Sept. 2015; miles and layers of
fencing, Sept. 2016; patrol roads, Nov. 2015; agents assigned, Sept. 2015.
Note: “Mixed” fencing coverage refers to border zones with a mixture of legacy and modern fencing designs. Due to rounding, percentages may not total 100.
Source: U.S. Customs and Border Protection. | GAO-17-331
Page 48
GAO-17-331 Tactical Infrastructure

Percentage of sector border miles covered by
fencing, by layer, type, and design (September 2016)Fencing overview
El Centro, California
Total estimated known
illegal entries
Estimated known
drive throughs
Estimated known turn
backs and got aways
Apprehension rate
of estimated known
entrants
Primary fence type (2015)
(number and percent of border zones) Number Percentage Number Number Percentage Percentage
No fence (2, 10%) 6,147 12 9 1,814 11 70
Pedestrian fence (PF) total (11, 55%) 32,001 61 0 11,896 69 63
Modern PF complete coverage (2, 10%) 2,273 4 0 617 4 73
Modern PF partial coverage (5, 25%) 9,178 17 0 3,560 21 61
Legacy PF partial coverage (3, 15%) 15,426 29 0 6,177 36 60
Mixed PF complete coverage (1, 5%) 5,124 10 0 1,542 9 70
Mixed vehicle fence (VF) partial coverage
(4, 20%)
5,947 11 19 1,505 9 75
Mixed PF/VF complete coverage (3, 15%) 8,508 16 6 1,980 12 77
Total (20, 100%) 52,603 100 34 17,195 100 67
The geography of El Centro is largely desert, but also includes
rugged mountains, agricultural areas, a designated wilderness
area, and several military reservations. Cities near the border
include Mexicali, Mexico (population 900,000) and Calexico, CA
(population 40,000).
United States
Mexico
Sunland Park
Nogales
Tucson
Nogales
Yuma
Mexicali
San Luis
Rio Colorado
San Diego
Tijuana
California
Nevada
Arizona
San Diego
Yuma
Tucson
El Centro
San Luis
Rio Colorado
Legend
State line
Sector boundary
State name
Sector name
U.S. city
Mexican city
Border
Source: U.S. Customs and Border Protection; MapInfo (map). | GAO-17-331
Land border
Land area
Border zones / interior zones
Primary fencing
Patrol roads
Agents assigned
Funds obligated for tactical infrastructure
operations and maintenance (FY 2015)
Percentage of total estimated known illegal
entries in southwest border zones recorded in
the El Centro sector (FYs 2013-2015)
70 miles
107,750 square miles
20 / 30
59 miles
214 miles
1004
$3.7 million
4 percent
Sector prole Sector map
About nine percent of all miles of primary fencing along the
southwest border are located in the El Centro sector, where three of
the sector’s 20 border zones are completely covered by pedestrian
fencing and an additional 11 border zones are partially covered by
pedestrian fencing. Border Patrol agents recorded approximately
30 percent of estimated known illegal entries in the sector in scal
years 2013-2015 in the three border zones partially covered by
legacy pedestrian fencing, where agents had apprehension rates of
60 percent. Agents recorded 23 percent of estimated known illegal
entries in the six border zones without any pedestrian fencing and
apprehended 70 percent of illegal entrants in those zones. Border
Patrol agents in the sector had an estimated overall apprehension
rate of 67 percent, higher than the 56 percent apprehension rate for
the southwest border as a whole.
Estimated known illegal entries in border zones, by fencing type, design, and coverage, scal years 2013-2015
Percentage covered
0 20 40 60 80 100
Tertiary layer
Secondary layer
Primary layer
Source: GAO analysis of U.S. Customs and Border Protection data. | GAO-17-331
Note: Due to rounding, percentages may not total 100.
Legacy pedestrian
Modern pedestrian
Legacy vehicle
Modern vehicle
No fence
Source: GAO analysis of U.S. Customs and Border Protection data. | GAO-17-331
Note: FY: Fiscal Year. Zone counts are as of Sept. 2015; miles and layers of
fencing, Sept. 2016; patrol roads, Nov. 2015; agents assigned, Sept. 2015.
Note: “Mixed” fencing coverage refers to border zones with a mixture of legacy and modern fencing designs. Due to rounding, percentages may not total 100.
Source: U.S. Customs and Border Protection. | GAO-17-331
Page 49
GAO-17-331 Tactical Infrastructure

Fencing overview
Yuma, California and Arizona
Total estimated known
illegal entries
Estimated known
drive throughs
Estimated known turn
backs and got aways
Apprehension rate
of estimated known
entrants
Primary fence type (2015)
(number and percent of border zones) Number Percentage Number Number Percentage Percentage
Pedestrian fence (PF) total (7, 47%) 12,337 67 0 4,117 62 67
Modern PF complete coverage (2, 13%) 433 2 0 83 1 81
Modern PF partial coverage (1, 7%) 1,104 6 0 619 9 44
Legacy PF partial coverage (1, 7%) 1,520 8 0 722 11 53
Mixed PF complete coverage (1, 7%) 2,394 13 0 411 6 83
Mixed PF partial coverage (2, 13%) 6,886 37 0 2,282 34 67
Modern vehicle fence (VF) partial coverage
(5, 33%)
4,896 26 0 2,174 33 56
Mixed PF/VF partial coverage (3, 20%) 1,311 7 0 380 6 71
Total (15, 100%) 18,544 100 0 6,671 100 64
The Yuma sector contains desert terrain, mountain ranges (some
with elevations over 4,000 feet), agricultural areas, and the
Colorado River. Large portions of the sector fall within federal
land and military reservations. Approximately two miles of primary
fencing are located between a half mile and mile from the border.
Urban areas include Yuma, AZ (population 93,000) and San Luis
Rio Colorado, Mexico (population 180,000).
United States
Mexico
Sunland Park
Nogales
Tucson
Nogales
Yuma
Mexicali
San Luis
Rio Colorado
San Diego
Tijuana
California
Nevada
Arizona
San Diego
Yuma
Tucson
El Centro
San Luis
Rio Colorado
Legend
State line
Sector boundary
State name
Sector name
U.S. city
Mexican city
Border
Source: U.S. Customs and Border Protection; MapInfo (map). | GAO-17-331
Land border
Land area
Border zones / interior zones
Primary fencing
Patrol roads
Agents assigned
Funds obligated for tactical infrastructure
operations and maintenance (FY 2015)
Percentage of total estimated known illegal
entries in southwest border zones recorded in
the Yuma sector (FYs 2013-2015)
126 miles
181,670 square miles
15 / 26
107 miles
209 miles
804
$7.4 million
1 percent
Sector prole Sector map
Approximately 16 percent of all primary border fencing miles along
the southwest border are located in the Yuma Sector, including a
third of all secondary and tertiary fencing. While all 15 border zones
in the sector have some border fencing, only three border zones
are completely covered by pedestrian fencing. In zones with no
pedestrian fencing, agents recorded 26 percent of total estimated
known illegal entries and had an apprehension rate of 56 percent.
Yuma Border Patrol agents had the highest apprehension rate (83
percent) of all border zones on the southwest border in the one
border zone in the sector with complete coverage by a mixture of
legacy and modern pedestrian fencing.
Estimated known illegal entries in border zones, by fencing type, design, and coverage, scal years 2013-2015
Percentage covered
Legacy pedestrian
Modern pedestrian
Legacy vehicle
Modern vehicle
No fence
0 20 40 60 80 100
Tertiary layer
Secondary layer
Primary layer
Source: GAO analysis of U.S. Customs and Border Protection data. | GAO-17-331
Percentage of sector border miles covered by
fencing, by layer, type, and design (September 2016)
Source: GAO analysis of U.S. Customs and Border Protection data. | GAO-17-331
Note: “Mixed” fencing coverage refers to border zones with a mixture of legacy and modern fencing designs. Due to rounding, percentages may not total 100.
Note: FY: Fiscal Year. Zone counts are as of Sept. 2015; miles and layers of
fencing, Sept. 2016; patrol roads, Nov. 2015; agents assigned, Sept. 2015.
Source: U.S. Customs and Border Protection. | GAO-17-331
Page 50
GAO-17-331 Tactical Infrastructure

Fencing overview
Tucson, Arizona
Total estimated known
illegal entries
Estimated known
drive throughs
Estimated known turn
backs and got aways
Apprehension rate
of estimated known
entrants
Primary fence type (2015)
(number and percent of border zones) Number Percentage Number Number Percentage Percentage
Pedestrian fence (PF) total (7, 19%) 108,741 28 41 36,807 20 66
Modern PF complete coverage (1, 3%) 1,620 0 19 798 0 51
Modern PF partial coverage (1, 3%) 1,919 0 0 1,145 1 40
Mixed PF partial coverage (5, 14%) 105,202 27 22 34,864 19 67
Vehicle fence (VF) total (22, 59%) 192,391 49 104 107,927 60 44
Modern VF complete coverage (1, 3%) 13,342 3 1 6,241 3 53
Modern VF partial coverage (9, 24%) 54,199 14 37 26,400 15 51
Legacy VF partial coverage (7, 19%) 86,167 22 50 53,430 29 38
Mixed VF partial coverage (5, 14%) 38,683 10 16 21,856 12 43
Mixed PF/VF partial coverage (8, 22%) 92,149 23 65 36,655 20 60
Total (37, 100%) 393,281 100 210 181,389 100 54
The Tucson sector’s geography includes mountain ranges and
valleys, as well as several areas of protected federal land and two
American Indian reservations, one that includes 63 miles of border
with Mexico. Urban areas include Nogales, AZ (population 21,000)
and Nogales, Mexico (population 200,000).
Mexico
El Paso
Sunland Park
Ciudad
Juarez
Las Cruces
Nogales
Tucson
Nogales
San Luis
Rio Colorado
Arizona New Mexico
Texas
Big Bend
El Paso
Tucson
Del Rio
San Luis
Rio Colorado
United States
Legend
State line
Sector boundary
State name
Sector name
U.S. city
Mexican city
Border
Source: U.S. Customs and Border Protection; MapInfo (map). | GAO-17-331
Land border
Land area
Border zones / interior zones
Primary fencing
Patrol roads
Agents assigned
Funds obligated for tactical infrastructure
operations and maintenance (FY 2015)
Percentage of total estimated known illegal
entries in southwest border zones recorded in
the Tucson sector (FYs 2013-2015)
262 miles
90,500 square miles
37 / 26
211 miles
1256 miles
3,991
$12.1 million
29 percent
Sector prole Sector map
The Tucson sector has more primary fencing than any other sector
on the southwest border (32 percent of all border fencing) and
every border zone in the sector is either completely or partially
covered by some type and design of border fencing. One of the
sector’s 37 border zones is completely covered by pedestrian
fencing. Tucson Border Patrol agents recorded approximately
half (49 percent) of estimated known illegal entries in scal years
2013-2015 in border zones in the sector with no pedestrian fencing,
where agents had an estimated apprehension rate of 44 percent.
The sector has more border zones with vehicle fencing than any
other sector along the southwest border, with complete or partial
vehicle fencing covering about 80 percent of the sector’s border
zones. Tucson Border Patrol agents recorded about half (169) of all
known drive throughs on the southwest border in scal years 2013-
2015 in border zones with at least some vehicle fencing.
Estimated known illegal entries in border zones, by fencing type, design, and coverage, scal years 2013-2015
Percentage covered
0 20 40 60 80 100
Tertiary layer
Secondary layer
Primary layer
Source: GAO analysis of U.S. Customs and Border Protection data. | GAO-17-331
Legacy pedestrian
Modern pedestrian
Legacy vehicle
Modern vehicle
No fence
Percentage of sector border miles covered by
fencing, by layer, type, and design (September 2016)
Source: GAO analysis of U.S. Customs and Border Protection data. | GAO-17-331
Note: “Mixed” fencing coverage refers to border zones with a mixture of legacy and modern fencing designs. Due to rounding, percentages may not total 100.
Note: FY: Fiscal Year. Zone counts are as of Sept. 2015; miles and layers of
fencing, Sept. 2016; patrol roads, Nov. 2015; agents assigned, Sept. 2015.
Source: U.S. Customs and Border Protection. | GAO-17-331
Page 51
GAO-17-331 Tactical Infrastructure

Fencing overview
El Paso, New Mexico and Texas
Total estimated known
illegal entries
Estimated known
drive throughs
Estimated known turn
backs and got aways
Apprehension rate
of estimated known
entrants
Primary fence type (2015)
(number and percent of border zones) Number Percentage Number Number Percentage Percentage
No fence (7, 18%) 8,021 13 15 3,848 11 52
Pedestrian fence (PF) total (21, 54%) 41,066 68 1 27,667 78 33
Modern PF complete coverage (3, 8%) 2,661 4 0 2,203 6 17
Modern PF partial coverage (13, 33%) 18,534 30 1 12,474 35 33
Legacy PF partial coverage (2, 5%) 7,072 12 0 5,391 15 24
Mixed PF complete coverage (1, 3%) 2,273 4 0 1,689 5 26
Mixed PF partial coverage (2, 5%) 10,526 17 0 5,910 17 44
Vehicle fence (VF) total (9, 23%) 7,004 12 14 2,919 8 58
Modern VF partial coverage (7, 18%) 5,454 9 7 2,334 7 57
Legacy VF partial coverage (1, 3%) 703 1 6 406 1 42
Mixed VF partial coverage (1, 3%) 847 1 1 179 1 79
Mixed PF/VF partial coverage (2, 5%) 4,737 8 2 1,188 3 75
Total (39, 100%) 60,828 100 32 35,622 100 41
The sector includes mountains, deserts, irrigation canals, and
rivers and just over a half of the sector area consists of small
towns and isolated rural areas. The international border
separates the cities of Ciudad Juarez, Mexico (population 1.3
million) and El Paso, TX (population 670,000).
Mexico
El Paso
Sunland Park
Ciudad
Juarez
Las Cruces
Nogales
Tucson
Nogales
San Luis
Rio Colorado
Arizona New Mexico
Texas
Big Bend
El Paso
Tucson
Del Rio
San Luis
Rio Colorado
United States
Legend
State line
Sector boundary
State name
Sector name
U.S. city
Mexican city
Border
Source: U.S. Customs and Border Protection; MapInfo (map). | GAO-17-331
Land border / river border
Land area
Border zones / interior zones
Primary fencing
Patrol roads
Agents assigned
Funds obligated for tactical infrastructure
operations and maintenance (FY 2015)
Percentage of total estimated known illegal
entries in southwest border zones recorded in
the El Paso sector (FYs 2013-2015)
180 miles / 88 miles
125,000 square miles
39 / 41
166 miles
465 miles
2,364
$5.9 million
5 percent
Sector prole Sector map
Approximately 25 percent of all primary border fencing miles
along the southwest border are located in the El Paso sector, as
well as about a third of all secondary and tertiary fencing. Agents
recorded about 67 percent of estimated known illegal entries in
border zones partially covered with pedestrian fencing and eight
percent in zones with complete pedestrian fencing. Agents recorded
the lowest estimated zone apprehension rate on the southwest
border (17 percent) in the three border zones in the sector that are
completely covered by modern pedestrian fencing; four percent of
total estimated known illegal entries were recorded in these zones.
Agents recorded 25 percent of estimated known illegal entries in
the sector in border zones with no pedestrian fencing, where the
estimated apprehension rate ranged from 52 to 58 percent.
Estimated known illegal entries in border zones, by fencing type, design, and coverage, scal years 2013-2015
Percentage covered
0 20 40 60 80 100
Tertiary layer
Secondary layer
Primary layer
Source: GAO analysis of U.S. Customs and Border Protection data. | GAO-17-331
Legacy pedestrian
Modern pedestrian
Legacy vehicle
Modern vehicle
No fence
Percentage of sector border miles covered by
fencing, by layer, type, and design (September 2016)
Source: GAO analysis of U.S. Customs and Border Protection data. | GAO-17-331
Note: FY: Fiscal Year. Zone counts are as of Sept. 2015; miles and layers of
fencing, Sept. 2016; patrol roads, Nov. 2015; agents assigned, Sept. 2015.
Note: “Mixed” fencing coverage refers to border zones with a mixture of legacy and modern fencing designs. Due to rounding, percentages may not total 100.
Source: U.S. Customs and Border Protection. | GAO-17-331
Page 52
GAO-17-331 Tactical Infrastructure

Fencing overview
Big Bend, Texas
Total estimated known
illegal entries
Estimated known
drive throughs
Estimated known turn
backs and got aways
Apprehension rate
of estimated known
entrants
Primary fence type (2015)
(number and percent of border zones) Number Percentage Number Number Percentage Percentage
No fence (19, 95%) 8,276 94 15 2,878 96 65
Mixed pedestrian and vehicle partial
coverage (1, 5%)
505 6 0 122 4 76
Total (20, 100%) 8,781 100 15 3,000 100 66
The terrain of the Big Bend sector varies from dry sandy desert to
tree-covered hills and also includes remote and rugged mountains
reaching to elevations of 8,000 feet. The Rio Grande River is the
international boundary and includes areas of thick vegetation. The
sector contains the most border miles of all Border Patrol sectors
on the southwest border.
United States
Mexico
Piedras Negras
Ciudad
Acuña
El Paso
Sunland Park
Ciudad
Juarez
Las Cruces
Nogales
Tucson
Nogales
Arizona New Mexico
Texas
Oklahoma
Big Bend
El Paso
T
ucson
Del Rio
Lared
o
Legend
State line
Sector boundary
State name
Sector name
U.S. city
Mexican city
Border
Source: U.S. Customs and Border Protection; MapInfo (map). | GAO-17-331
River border
Land area
Border zones / interior zones
Primary fencing
Patrol roads
Agents assigned
Funds obligated for tactical infrastructure
operations and maintenance (FY 2015)
Percentage of total estimated known illegal
entries in southwest border zones recorded in
the Big Bend sector (FYs 2013-2015)
510 miles
165,150 square miles
20 / 62
5 miles
393 miles
549
$.4 million
1 percent
Sector prole Sector map
One zone in the Big Bend sector has fencing and is partially
covered with a mix of pedestrian and vehicle fencing. The
apprehension rate in the 19 zones without fencing was 65 percent
in scal years 2013-2015 while the estimated rate in the one zone
with partial fencing was 76 percent, both higher than the border-
wide average apprehension rate (56 percent). Border Patrol agents
recorded most (94 percent) of estimated known illegal entries in the
sector in the 19 zones with no fencing.
Estimated known illegal entries in border zones, by fencing type, design, and coverage, scal years 2013-2015
Percentage covered
0 20 40 60 80 100
Tertiary layer
Secondary layer
Primary layer
Source: GAO analysis of U.S. Customs and Border Protection data. | GAO-17-331
Legacy pedestrian
Modern pedestrian
Legacy vehicle
Modern vehicle
No fence
Percentage of sector border miles covered by
fencing, by layer, type, and design (September 2016)
Source: GAO analysis of U.S. Customs and Border Protection data. | GAO-17-331
Note: “Mixed” fencing coverage refers to border zones with a mixture of legacy and modern fencing designs.
Note: FY: Fiscal Year. Zone counts are as of Sept. 2015; miles and layers of
fencing, Sept. 2016; patrol roads, Nov. 2015; agents assigned, Sept. 2015.
Source: U.S. Customs and Border Protection. | GAO-17-331
Page 53
GAO-17-331 Tactical Infrastructure

Fencing overview
Del Rio, Texas
Total estimated known
illegal entries
Estimated known
drive throughs
Estimated known turn
backs and got aways
Apprehension
rate of estimated
known entrants
Primary fence type (2015)
(number and percent of border zones) Number Percentage Number Number Percentage Percentage
No fence (4, 57%) 21,923 43 0 9,399 44 57
Modern pedestrian partial coverage (3, 43%) 29,549 57 1 11,909 56 60
Total (7, 100%) 51,472 100 1 21,308 100 59
The geography of the Del Rio sector varies from rugged canyons
and steep hills to rolling hills and atland. The Rio Grande
River, which establishes the international boundary, is oriented
predominately north to south and cuts through deep canyons.
The river can be forded by individuals in many places, but not by
vehicles. Approximately one mile of the primary border fencing
deployed in the sector is located between half a mile and a mile
from the border. While the United States side of the border is
sparsely populated and consists mostly of farms and ranches, the
Mexican towns of Piedras Negras (population 150,000) and Ciudad
Acuña (population 140,000) are located just south of the border.
United States
Mexico
Nuevo Laredo
Laredo
Piedras Negras
Ciudad
Acuña
El Paso
Sunland Park
Ciudad
Juarez
Las Cruces
Nogales
Tucson
New Mexico Texas
Big Bend
El Paso
Del Rio
Laredo
Rio Gran
de Valley
Legend
State line
Sector boundary
State name
Sector name
U.S. city
Mexican city
Border
Source: U.S. Customs and Border Protection; MapInfo (map). | GAO-17-331
River border
Land area
Border zones / interior zones
Primary fencing
Patrol roads
Agents assigned
Funds obligated for tactical infrastructure
operations and maintenance (FY 2015)
Percentage of total estimated known illegal
entries in southwest border zones recorded in
theDel Rio sector (FYs 2013-2015)
210 miles
59,540 square miles
7 / 24
4 miles
1198 miles
1,536
$1.9 million
4 percent
Sector prole Sector map
Approximately one percent of all miles of primary border fencing
along the southwest border are located in the Del Rio sector. During
scal years 2013-2015, Border Patrol agents had an estimated
overall apprehension rate of 59 percent, higher than the 56 percent
apprehension rate for the southwest border as a whole. Estimated
apprehension rates were 60 percent in border zones that are
partially covered by modern pedestrian fencing compared with 57
percent in the four border zones without any fencing.
Estimated known illegal entries in border zones, by fencing type, design, and coverage, scal years 2013-2015
Percentage covered
0 20 40 60 80 100
Tertiary layer
Secondary layer
Primary layer
Source: GAO analysis of U.S. Customs and Border Protection data. | GAO-17-331
Legacy pedestrian
Modern pedestrian
Legacy vehicle
Modern vehicle
No fence
Percentage of sector border miles covered by
fencing, by layer, type, and design (September 2016)
Source: GAO analysis of U.S. Customs and Border Protection data. | GAO-17-331
Note: FY: Fiscal Year. Zone counts are as of Sept. 2015; miles and layers of
fencing, Sept. 2016; patrol roads, Nov. 2015; agents assigned, Sept. 2015.
Source: U.S. Customs and Border Protection. | GAO-17-331
Page 54
GAO-17-331 Tactical Infrastructure

Fencing overview
Laredo, Texas
Total estimated known
illegal entries
Estimated known
drive throughs
Estimated known turn
backs and got aways
Apprehension rate
of estimated known
entrants
Primary fence type (2015)
(number and percent of border zones) Number Percentage Number Number Percentage Percentage
No fence (15, 94%) 93,794 76 20 47,559 75 49
Legacy pedestrian partial coverage (1, 6%) 30,117 24 6 15,469 25 49
Total (16, 100%) 123,911 100 26 63,028 100 49
The Laredo sector contains brush covered rolling and steep hills as
well as several deep arroyos, washouts, and creeks that drain into
the Rio Grande River, which defines the entire international border.
Border cities include Laredo, TX (population 245,000) and Nuevo
Laredo, Mexico (population 380,000).
United States
Mexico
Brownsville
Matamoros
McAllen
Reynosa
Nuevo Laredo
Laredo
Piedras Negras
Ciudad
Acuña
El Paso
Sunland Park
Ciudad
Juarez
Las Cruces
Texas
Big Bend
Del Rio
Laredo
Rio Grande Valley
Legend
State line
Sector boundary
State name
Sector name
U.S. city
Mexican city
Border
Source: U.S. Customs and Border Protection; MapInfo (map). | GAO-17-331
River border
Land area
Border zones / interior zones
Primary fencing
Patrol roads
Agents assigned
Funds obligated for tactical infrastructure
operations and maintenance (FY 2015)
Percentage of total estimated known illegal
entries in southwest border zones recorded in
the Laredo sector (FYs 2013-2015)
171 miles
88,460 square miles
16 / 105
1 mile
144 miles
1,670
$1.4 million
9 percent
Sector prole Sector map
The one zone with border fencing in the Laredo sector is partially
covered by legacy pedestrian fencing. Border Patrol agents
recorded approximately 76 percent of illegal entries in the
sector in scal years 2013-2015 in the 15 border zones with no
fencing, where approximately half (49 percent) of entrants were
apprehended.
Estimated known illegal entries in border zones, by fencing type, design, and coverage, scal years 2013-2015
Percentage covered
0 20 40 60 80 100
Tertiary layer
Secondary layer
Primary layer
Source: GAO analysis of U.S. Customs and Border Protection data. | GAO-17-331
Legacy pedestrian
Modern pedestrian
Legacy vehicle
Modern vehicle
No fence
Percentage of sector border miles covered by
fencing, by layer, type, and design (September 2016)
Source: GAO analysis of U.S. Customs and Border Protection data. | GAO-17-331
Note: FY: Fiscal Year. Zone counts are as of Sept. 2015; miles and layers of
fencing, Sept. 2016; patrol roads, Nov. 2015; agents assigned, Sept. 2015.
Source: U.S. Customs and Border Protection. | GAO-17-331
Page 55
GAO-17-331 Tactical Infrastructure

Percentage of sector border miles covered by
fencing, by layer, type, and design (September 2016)
Fencing overview
Rio Grande Valley, Texas
Total estimated known
illegal entries
Estimated known
drive throughs
Estimated known turn
backs and got aways
Apprehension rate
of estimated known
entrants
Primary fence type (2015)
(number and percent of border zones) Number Percentage Number Number Percentage Percentage
No fence (8, 38%) 259,308 49 0 151,244 65 42
Modern pedestrian partial coverage (13, 62%) 272,011 51 0 82,345 35 70
Total (21, 100%) 531,319 100 0 233,589 100 56
The Rio Grande Valley sector contains terrain that varies from
rural farmland and ranchland to a large coastal shoreline and also
includes densely populated areas including Brownsville, Texas
(population 180,000), McAllen, Texas (population 135,000),
Matamoros, Mexico (population 490,000), and Reynosa, Mexico
(population 600,000). The Rio Grande River denes the entire
international border. Approximately 14 miles of the primary border
fencing in the sector is located between half a mile and a mile from
the border and an additional two miles of primary fencing is located
between one and one and a half miles from the border.
United States
Mexico
Brownsville
Matamoros
McAllen
Reynosa
Nuevo Laredo
Laredo
Piedras Negras
Ciudad
Acuña
El Paso
Sunland Park
Ciudad
Juarez
Las Cruces
Texas
Big Bend
Del Rio
Laredo
Rio Grande Valley
Legend
State line
Sector boundary
State name
Sector name
U.S. city
Mexican city
Border
Source: U.S. Customs and Border Protection; MapInfo (map). | GAO-17-331
River border
Land area
Border zones / interior zones
Primary fencing
Patrol roads
Agents assigned
Funds obligated for tactical infrastructure
operations and maintenance (FY 2015)
Percentage of total estimated known illegal
entries in southwest border zones recorded in
the Rio Grande Valley sector (FYs 2013-2015)
273 miles
18,580 square miles
21 / 38
55 miles
716 miles
3,056
$3.9 million
40 percent
Sector prole Sector map
Approximately eight percent of all miles of border fencing along
the southwest border are located in the Rio Grande Valley sector.
In scal years 2013-2015, Border Patrol agents in the sector
recorded 40 percent of all estimated known illegal entries on the
southwest border and apprehended approximately half (56 percent)
of those entrants. Estimated apprehension rates were higher in the
13 border zones that are partially covered by modern pedestrian
fencing (70 percent) than in zones without any fencing (42 percent).
Estimated known illegal entries in border zones, by fencing type, design, and coverage, scal years 2013-2015
Percentage covered
0 20 40 60 80 100
Tertiary layer
Secondary layer
Primary layer
Source: GAO analysis of U.S. Customs and Border Protection data. | GAO-17-331
Legacy pedestrian
Modern pedestrian
Legacy vehicle
Modern vehicle
No fence
Source: GAO analysis of U.S. Customs and Border Protection data. | GAO-17-331
Note: FY: Fiscal Year. Zone counts are as of Sept. 2015; miles and layers of
fencing, Sept. 2016; patrol roads, Nov. 2015; agents assigned, Sept. 2015.
Source: U.S. Customs and Border Protection. | GAO-17-331
Page 56
GAO-17-331 Tactical Infrastructure

Appendix II: Objectives, Scope and
M e thodology
Page 57 GAO-17-331 Tactical Infrastructure
This report examines U.S. Customs and Border Protection’s (CBP)
tactical infrastructure (TI) along the southwest border. Our objectives
were to review (1) border fencing’s intended contributions to border
security operations and the extent to which CBP has assessed these
contributions and (2) the extent that CBP has processes in place to
ensure sustainment
1
and deployment of TI along the southwest border
and challenges in doing so.
To examine border fencing’s intended contributions on border security
operations, and the extent to which CBP has assessed these
contributions, we analyzed relevant documentation, including Border
Patrol’s State of the Border Risk Methodology, which Border Patrol uses
to assess risk across the southwest border, and documents identifying
CBP mission goals and objectives, and related performance measures.
We also reviewed relevant acquisition documents that CBP developed for
the construction of TI across the southwest border. We interviewed
officials from Border Patrol’s Strategic Planning and Analysis (SPA)
Directorate, which is responsible for assessing risk along the southwest
border, and the Operational Requirements Management Division
(ORMD), which is responsible for deploying operational requirements,
including TI, to mitigate these risks. During these interviews we focused
on the intended contributions of TI in providing Border Patrol agents with
Foundational Operational Capabilities (FOC) and assisting Border Patrol
agents in executing their Mission Essential Tasks (METs).
2
We also
discussed the limitations associated with border fencing, including the
methods employed by illegal entrants in defeating border fencing,
including breaches. To analyze breaches by fence design, we obtained
pedestrian fence breach data from Border Patrol Facilities and Tactical
Infrastructure (BPFTI) for fiscal years 2010 through 2015.
3
To assess the
1
For the purposes of this report, sustainment refers to the maintenance, repair, and new
construction of TI.
2
Border Patrol defines FOCs as the essential combinations of resources (personnel,
training, equipment, technology, and infrastructure) that provide Border Patrol agents with
the fundamental operational means by which to conduct their Mission Essential Tasks
(METS). Border Patrol defines the METs as a sequential set of discreet or unique tasks in
which Border Patrol agents must be proficient to execute their duties in the furtherance of
border security operations.
3
For the purposes of this report, we refer to any fencing designs used prior to CBP
implementing requirements of the Secure Fence Act of 2006 (Pub. L. No. 109-367, 120
Stat. 2638) as “legacy” fencing and any fencing deployed subsequently as “modern”
fencing designs. In addition, all “landing mat” fencing—constructed of army surplus carbon
steel landing mats which were used to create landing s trips during the Vietnam War — is
considered “legacy” fencing design, regardless of when it was constructed.
Appendix II: Objectives, Scope and
Methodology

Appendix II: Objectives, Scope and
M e thodology
Page 58 GAO-17-331 Tactical Infrastructure
reliability of these data, we reviewed how CBP collects and maintains
breach data, and found the data to be sufficiently reliable for the purposes
of our report. We then analyzed the occurrences of breaches in modern
compared to legacy pedestrian fence designs. During our meetings with
ORMD and SPA, we also focused on CBP’s efforts to assess TI’s
contributions to border security operations, and the perceived challenges
involved in conducting such an assessment. We then compared these
efforts against criteria established in GAO’s past reporting on leading
practices for performance management.
4
To identify border fencing’s intended contributions to border security
operations at the sector level, we visited the El Paso, San Diego, and
Tucson sectors. We selected these sectors for site visits due to CBP’s
extensive investments in TI in each sector over the years. Combined,
these sectors contain approximately 65 percent of all primary pedestrian
and vehicle fencing along the southwest border. These three sectors also
contain 66 percent of all secondary and tertiary fencing across the
southwest border. During these site visits, we interviewed Border Patrol
sector headquarters officials and agents, as well as agents assigned to
various stations and zones within each sector.
5
Our interviews in each
sector focused on border fencing’s specific contributions within each
sector as well as the extent to which border fencing has provided Border
Patrol agents with the FOCs border fencing was intended to provide, and
the extent to which border fencing assists Border Patrol agents in
executing their METs. We also collected information on other perceived
benefits of border fencing not associated with the FOC or METs, including
agent safety, as well as perceived limitations of border fencing. While the
information we obtained from our visits cannot be generalized to all
Border Patrol sectors, it provided us with insights about border fencing’s
contribution to border security operations.
To examine the extent that CBP has processes in place to ensure
sustainment and deployment of TI along the southwest border and
challenges in doing so, we reviewed relevant documentation and
interviewed headquarters officials from BPFTI, which is responsible for
4
GAO, Managing for Results: Enhancing Agency Use of Performance Information for
Decision Making, GAO-05-927 (Washington, D.C.: Sept. 2009).
5
Each southwest border sector is divided into varying numbers of stations, with agents
assigned to patrol defined geographic areas, or zones, within each station. Of these,
zones that touch the international border are known as border zones, while zones that do
not touch the international border are known as interior zones.

Appendix II: Objectives, Scope and
M e thodology
Page 59 GAO-17-331 Tactical Infrastructure
sustaining TI along the southwest border. These documents included
CBP’s Comprehensive Tactical Infrastructure Maintenance and Repair
(CTIMR) contracts, which CBP uses to maintain and repair TI assets
across the southwest border. To assess how CBP manages the
deployment of TI across the southwest border, we reviewed relevant
documentation from Border Patrol’s ORMD, which is responsible for
executing Border Patrol’s requirements management process and
deploying TI, among other assets. These documents included Border
Patrol’s Capability Gap Analysis Process (CGAP) and the various outputs
of this process, including capability gaps and agent identified solutions.
We compared these documents against criteria outlined in Standards for
Internal Control in the Federal Government.
6
We also interviewed officials from BPFTI and ORMD. Our interviews with
BPFTI officials focused on the program’s CTIMR contracts and work
plans, BPFTI’s oversight of CTIMR contractors, the Work Management
System that BPFTI uses to track and oversee all TI related maintenance
and repair work, and any challenges BPFTI or contractors may face in
sustaining TI along the southwest border. Our interviews with ORMD
focused on Border Patrol’s process for identifying TI requirements,
prioritizing TI requirements, and ultimately allocating resources. During
our site visits, we interviewed relevant BPFTI and Border Patrol officials
responsible for overseeing the sustainment – maintenance and repair–of
CBP’s TI in the sector. In these meetings, we discussed fence
replacement projects and other TI repairs–as well as any challenges the
sector faces in sustaining the TI deployed there. We also toured each
sector’s TI inventory, which include pedestrian and vehicle fencing, gates,
roads, bridges, grates, and lighting. In the El Paso and Tucson sectors,
we also visited segments of legacy pedestrian fencing slated for
replacement with more modern pedestrian fencing within the coming
months.
The descriptive information in the sector profiles in Appendix I was
compiled from a variety of CBP sources. We obtained information on the
number of agents assigned to each sector from Border Patrol as of
September 2015. We obtained information on roads in each sector as of
November 2015 and on the extent of primary, secondary, and tertiary
6
GAO-14-704G.

Appendix II: Objectives, Scope and
M e thodology
Page 60 GAO-17-331 Tactical Infrastructure
fencing
7
in each sector as of September 2016 from CBP’s Facilities
Management and Engineering office (FM&E). Finally, we obtained the
geographic information on the number of sector zones and geographic
information included in sector maps from Border Patrol and located the
data geographically using Mapinfo.
To analyze the location of illegal entries in conjunction with border
fencing, we reviewed the types of data Border Patrol already collects,
including apprehension data from the Enforcement Integrated Database
(EID) and turn back, got away, and drive through data from the Border
Patrol Enforcement Tracking System (BPETS).
8
We assessed the
reliability of these data through interviews with knowledgeable Border
Patrol officials on the limitations of these data and digital testing of these
data. As a result of our data reliability assessment, we determined that
Border Patrol’s data were sufficiently reliable for our intended use.
However, Border Patrol has identified some limitations concerning drive
through, turn back, and got away data. To identify and report estimated
known illegal entries, Border Patrol agents use various sources of
information, including direct agent observation, referrals from credible
sources (such as local residents), camera monitoring, and detection of
physical evidence left by migrants (such as footprints).
9
Border Patrol’s
estimate of illegal entries does not include estimates of illegal entries for
which Border Patrol does not have reasonable support. As a result, the
estimated illegal entry data for a given period of time may not represent
all illegal entries across the southwest border during that period.
7
Up to three layers of fencing may run parallel to the border to support border operations.
The first layer, the primary fence, may include both pedestrian and vehicle fencing and is
the first fence encountered when moving north from the border; the secondary fence,
located behind the primary fence; and the third layer, or tertiary fence, is primarily used to
delineate property lines rather than deter pedestrian traffic.
8
EID is a DHS-shared common database repository for several DHS law enforcement and
homeland security applications. Data on apprehensions are held in the EID; data on turn
backs, got aways, drive throughs are held in BPETS.
9
Border Patrol defines estimated illegal entries as the total number of aliens who were
apprehended, in addition to the number of entrants who illegally crossed the border but
were not apprehended either because they crossed back to Mexico—”turn backs”—or
continued traveling to the U.S. interior and Border Patrol was no longer actively pursuing
them—”got aways.” “Drive throughs” are border crossings by a motor vehicle, often
carrying drugs. The individuals involved in a “drive through” are counted among
apprehensions, turn backs, or got aways if agents are able to ascertain the number of
individuals in the vehicle. We defined these illegal entries as estimated “known” illegal
entries to clarify that the estimates do not include illegal entrants for which Border Patrol
does not have reasonable indications of cross-border illegal activity.

Appendix II: Objectives, Scope and
M e thodology
Page 61 GAO-17-331 Tactical Infrastructure
Furthermore, according to Border Patrol officials, agents’ ability to obtain
accurate or consistent data using these identification sources depends on
various factors, such as terrain and weather. For example, data on turn
backs and got aways may be understated in areas with rugged mountains
and steep canyons that can hinder detection of illegal entries. In other
cases, data may be over or understated—for example, in cases where
the same turn-back identified by a camera is also identified by footprints.
Nonetheless, Border Patrol uses these data, among other data, to assign
risk scores to each sector, which informs resource deployments. Border
Patrol also uses these data to calculate the “Interdiction Effectiveness
Rate,” which is a performance metric used by the agency to evaluate
progress toward meeting its border security goal(s) consistent with the
Government Performance and Results Act (GPRA) of 1993, as updated
by the GPRA Modernization Act of 2010.
10
Border Patrol officials said that
they did not consider the data sufficiently reliable to compare results
across sectors due to various challenges in estimating known entries
such as differences in local demographics, geography, staffing, and
technology. However, according to Border Patrol, the data were
sufficiently reliable to compare zones within each sector, and to compare
sectors against a border-wide summation. Therefore, after interviewing
Border Patrol officials about these data and their possible limitations, we
determined the data were sufficiently reliable for the purposes of our
descriptive analysis.
We obtained data for fiscal years 2013 through 2015 for all southwest
border zones and developed four indicators.
11
These indicators
10
GPRA, Pub. L. No. 103-62, 107 Stat. 285 (1993), was updated by the GPRA
Modernization Act of 2010, Pub. L. No. 111-352, 124 Stat. 3866 (2011). CBP reports the
“Interdiction Effectiveness Rate” as a GPRA measure, and calculates this figure by
dividing apprehensions + turn backs, by apprehensions + turn backs + got aways. While
GPRA is applicable to the department or agency level, performance goals and measures
are important management tools applicable to all levels of an agency, including the
program, project, or activity level, consistent with leading practices and internal controls
related to performance monitoring.
11
We obtained apprehension data for fiscal years 2013 through 2015 from the
Enforcement Integrated Database - a DHS-shared common database repository for
several DHS law enforcement and homeland security applications. We obtained data on
turn backs, got aways, drive throughs from the Border Patrol Enforcement Tracking
System. Apprehension, turn back, and got away data for fiscal years 2013 through 2015
were queried (i.e. obtained from relevant databases) as of February 2016. We selected
these data for fiscal years 2013 through 2015 because beginning fiscal year 2013, Border
Patrol standardized how it collects and records got aways and turn backs, which improved
the reliability of these data.

Appendix II: Objectives, Scope and
M e thodology
Page 62 GAO-17-331 Tactical Infrastructure
specifically focus on pedestrian and vehicle fencing, and do not analyze
other types of TI, including: roads, lighting, boat launches, gates, grates,
culverts and drainage ditches. These indicators also do not account for
other assets that CBP deploys as part of its border security operations,
including manpower and surveillance technology, including integrated
fixed towers or remote video surveillance systems. The indicators are:
• Total estimated known illegal entries in southwest border zones with
varying coverage, types, and designs of border fencing and border
zones with no border fencing (apprehensions + turn backs + got
aways)
• Total estimated turn backs and got aways in southwest border zones
with varying coverage, types and designs of border fencing and
border zones with no border fencing (turn backs + got aways)
• Total estimated drive throughs in southwest border zones with varying
coverage, types, and designs of border fencing and border zones with
non-border fencing (drive throughs)
• Apprehension rates of estimated known illegal entries in southwest
border zones with varying coverage, types, and designs of border
fencing and border zones with no border fencing (apprehensions /
apprehensions + turn backs + got aways)
We then obtained sector data for the southwest border, current as of
December 2015, identifying the border zones in each sector from the
Office of Border Patrol and data identifying the location of legacy and
modern pedestrian and vehicle fencing along the border from BPFTI. To
assess the reliability of the sector fence data we obtained, we reviewed
for any inconsistencies in fence mileage in each sector, by type and
design. As a result of our data reliability assessment, we determined that
CBP’s sector fence data were sufficiently reliable for our intended use. To
identify the presence and extent of border fencing, by design and type, in
each border zone within the nine Border Patrol sectors along the
southwest border, we combined Border Patrol sector and border zone
data with data provided by BPFTI identifying the location of fence, by
design (pedestrian or vehicle) and type (legacy or modern), across the

Appendix II: Objectives, Scope and
M e thodology
Page 63 GAO-17-331 Tactical Infrastructure
southern border.
12
After combining these data, we created a single
dataset identifying border zones by the presence of border fencing, by
type, design, and coverage.
13
To further classify each border zone based
off of the presence and extent of border fencing, by design and type, we
developed the following categories:
• Border zones with No Fence
• Border zones with Modern Pedestrian Fence Complete Coverage
• Border zones with Modern Pedestrian Fence Partial Coverage
• Border zones with Legacy Pedestrian Fence Complete Coverage
• Border zones with Legacy Pedestrian Fence Partial Coverage
• Border zones with Mixed Modern/ Legacy Pedestrian Fence Complete
Coverage
• Border zones with Mixed Modern/ Legacy Pedestrian Fence Partial
Coverage
• Border zones with Modern Vehicle Fence Complete Coverage
• Border zones with Modern Vehicle Fence Partial Coverage
• Border zones with Legacy Vehicle Fence Complete Coverage
• Border zones with Legacy Vehicle Fence Partial Coverage
• Border zones with Mixed Modern/ Legacy Pedestrian/ Vehicle Fence
Complete Coverage
• Border zones with Mixed Modern/ Legacy Pedestrian/ Vehicle Fence
Partial Coverage
12
Pedestrian fencing is primarily intended to slow down and deter pedestrians from
crossing the border, while vehicle fencing is intended to resist vehicles engaged in drug
trafficking and alien smuggling operations. “Legacy” pedestrian fencing refers to fencing
constructed prior to the implementation of the Secure Fence Act of 2006 as well as any
“landing mat” fencing—constructed of army surplus carbon steel landing mats which were
used to create landing strips during the Vietnam War—deployed in any year; and
“modern” fencing refers to fencing first deployed as part of implementation of the Secure
Fence Act of 2006. For the purposes of this report, the term “zone coverage” refers to the
extent to which the border miles of a border zone are fenced. In our analysis, we classified
border zones as follows: Complete (100 percent) border fence coverage, partial border
fence coverage (less than 100 percent), or no border fence coverage.
13
For the purposes of this document, the term “zone coverage” refers to the extent to
which the border miles of a border zone are fenced. In our analysis, we classified border
zones as follows: Complete (100 percent) border fence coverage, partial border fence
coverage (less than 100 percent), or no border fence coverage.

Appendix II: Objectives, Scope and
M e thodology
Page 64 GAO-17-331 Tactical Infrastructure
After grouping each border zone within each sector along the southwest
border into the appropriate fence category listed above, we then
combined these data with data we received from Border Patrol identifying
total known illegal entries in southwest border zones for fiscal years 2013
through 2015, by sector and calculated each indicator for each fence
category grouping within each sector. The results of this analysis are
available in Appendix I. Because Border Patrol occasionally adjusts the
geometric shapes of zones, we requested map data as of January 2013,
December 2013, December 2014, and December 2015. We then
identified and measured the extent of each border zone modification over
these years. In instances where Border Patrol had modified within this
date range, we measured the percentage of each modification and re-
distributed border zone level apprehension, turn back, and got away data
to the appropriate adjacent zone, in equal proportion.
We conducted this audit from October 2015 to February 2017 in
accordance with generally accepted government auditing standards.
Those standards require that we plan and perform the audit to obtain
sufficient, appropriate evidence to provide a reasonable basis for our
findings and conclusions based on our audit objectives. We believe that
the evidence obtained provides a reasonable basis for our findings and
conclusions based on our audit objectives.

Appendix III: Comments from the Department
of Homeland Security
Page 65 GAO-17-331 Tactical Infrastructure
Appendix III: Comments from the
Department of Homeland Security

Appendix III: Comments from the Department
of Homeland Security
Page 66 GAO-17-331 Tactical Infrastructure

Appendix III: Comments from the Department
of Homeland Security
Page 67 GAO-17-331 Tactical Infrastructure

A
ppendix III: Comments from the Department
of Homeland Security
Page 68 GAO-17-331 Tactical Infrastructure

Appendix IV: GAO Contact and Staff
Acknowledgments
Page 69 GAO-17-331 Tactical Infrastructure
Rebecca Gambler, (202) 512-8777 or gamblerr@gao.gov
In addition to the contact named above, Jeanette Espinola (Assistant
Director); Bruce Crise, Eric Hauswirth, Brandon Jones, Krista Mantsch,
John Mingus, Sasan J. “Jon” Najmi, and Adam Vogt made contributions
to this report.
Appendix IV: GAO Contact and Staff
Acknowledgments
GAO Contact
Staff
Acknowledgments
(101237)

The Government Accountability Office, the audit, evaluation, and investigative
arm of Congress, exists to support Congress in meeting its constitutional
responsibilities and to help improve the performance and accountability of the
federal government for the American people. GAO examines the use of public
funds; evaluates federal programs and policies; and provides analyses,
recommendations, and other assistance to help Congress make informed
oversight, policy, and funding decisions. GAO’s commitment to good government
is reflected in its core values of accountability, integrity, and reliability.
The fastest and easiest way to obtain copies of GAO documents at no cost is
through GAO’s website (http://www.gao.gov). Each weekday afternoon, GAO
posts on its website newly released reports, testimony, and correspondence. To
have GAO e-mail you a list of newly posted products, go to http://www.gao.gov
and select “E-mail Updates.”
The price of each GAO publication reflects GAO’s actual cost of production and
distribution and depends on the number of pages in the publication and whether
the publication is printed in color or black and white. Pricing and ordering
information is posted on GAO’s website, http://www.gao.gov/ordering.htm.
Place orders by calling (202) 512-6000, toll free (866) 801-7077, or
TDD (202) 512-2537.
Orders may be paid for using American Express, Discover Card, MasterCard,
Visa, check, or money order. Call for additional information.
Connect with GAO on Facebook, Flickr, LinkedIn, Twitter, and YouTube.
Subscribe to our RSS Feeds or E-mail Updates. Listen to our Podcasts.
Visit GAO on the web at www.gao.gov and read The Watchblog.
Contact:
Website: http://www.gao.gov/fraudnet/fraudnet.htm
E-mail: fraudnet@gao.gov
Automated answering system: (800) 424-5454 or (202) 512-7470
Katherine Siggerud, Managing Director, siggerudk@gao.gov, (202) 512-4400,
U.S. Government Accountability Office, 441 G Street NW, Room 7125,
Washington, DC 20548
Chuck Young, Managing Director, youngc1@gao.gov, (202) 512-4800
U.S. Government Accountability Office, 441 G Street NW, Room 7149
Washington, DC 20548
James-Christian Blockwood, Managing Director, spel@gao.gov, (202) 512-4707
U.S. Government Accountability Office, 441 G Street NW, Room 7814,
Washington, DC 20548
GAO’s Mission
Obtaining Copies of
GAO Reports and
Testimony
Order by Phone
Connect with GAO
To Report Fraud,
Waste, and Abuse in
Federal Programs
Congressional
Relations
Public Affairs
Strategic Planning and
External Liaison
Please Print on Recycled Paper.
