Population/Sample Standard Deviation and Random Sampling
We selected Q3.2.20 (p.141) as an example of using StatCrunch to calculate population standard deviation and
randomly select sample data from the population data then calculate sample standard deviation.
Q3.2.20
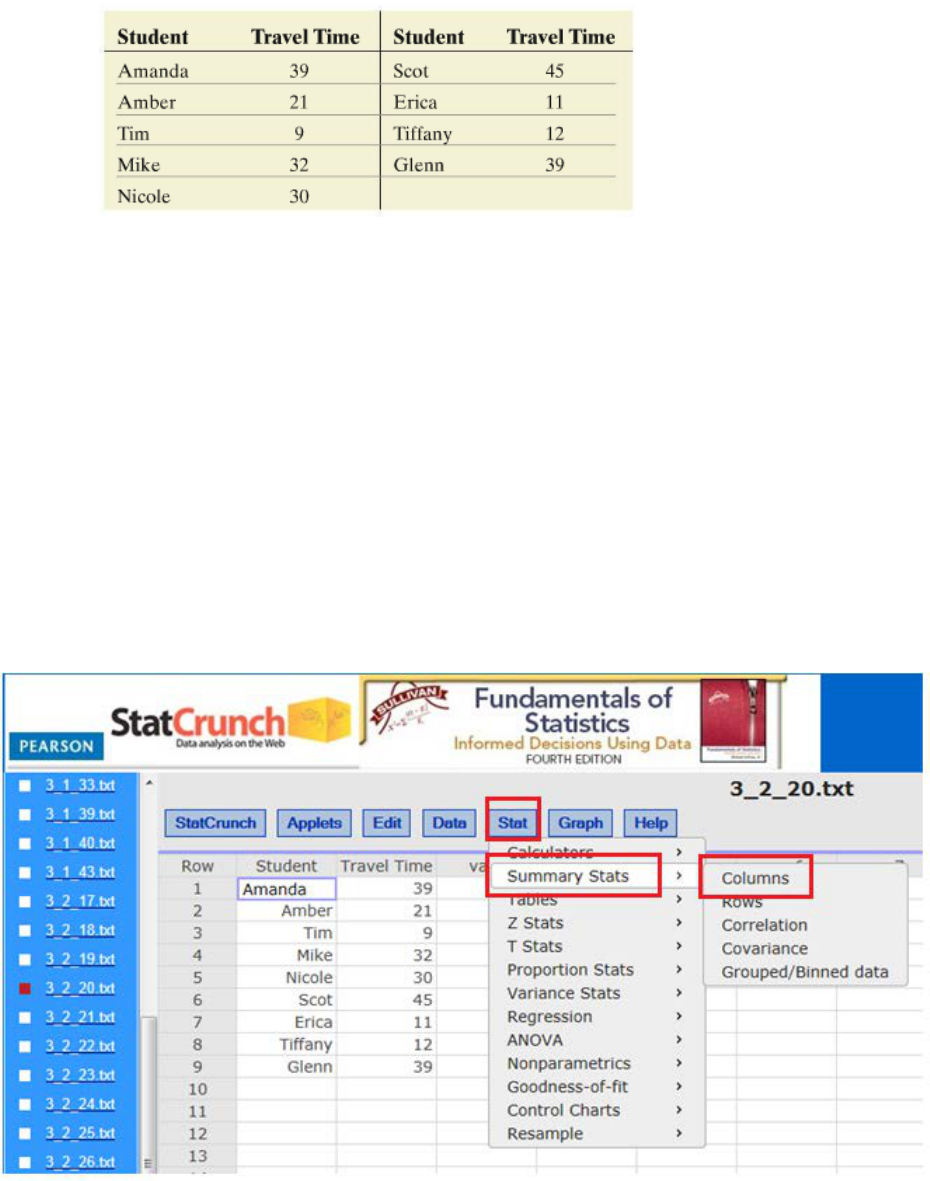
Travel Time The following data represent the travel time (in minutes) to school for nine students enrolled in
Sullivan’s College Algebra course. Treat the nine students as a population.
(a) Determine the population standard deviation.
(b) Find three simple random sample of size 4 and determine the sample standard deviation of
each sample.
(c) Which samples underestimate the population standard deviation? Which overestimate the
population standard deviation?
(a) Determine the population standard deviation.
Step 1: Download the data set.
Step 2: Click Stat → Summary Stats → Columns.
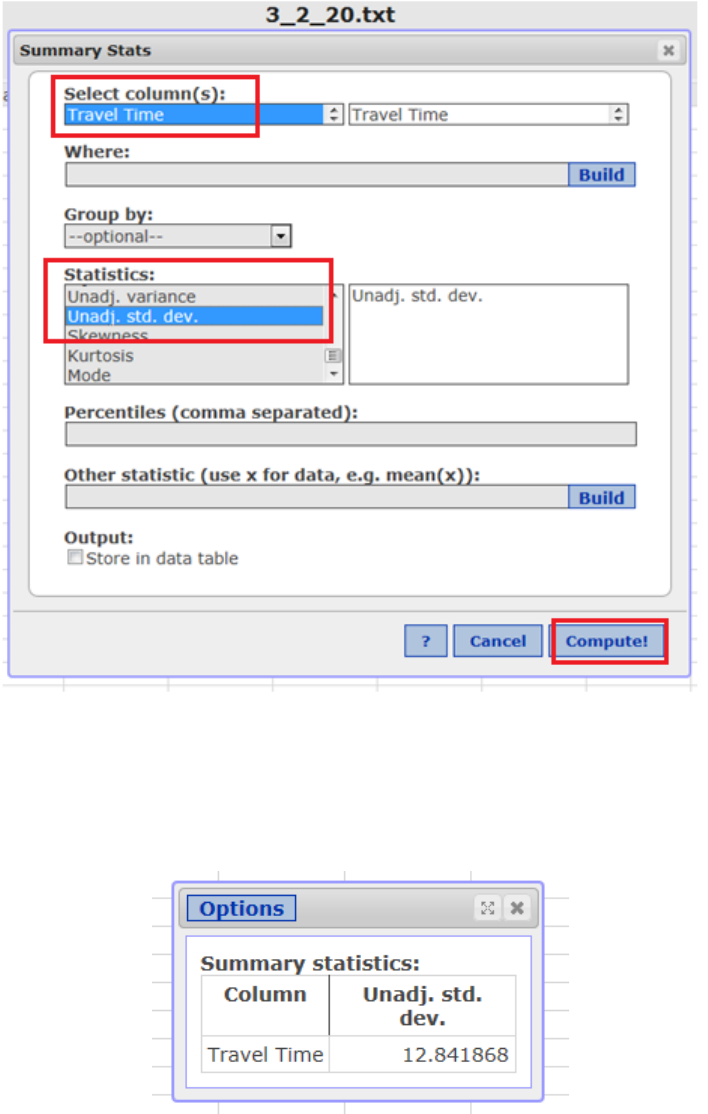
Step 3: 1) Click Travel Time under Select Column(s):
2) Choose Unadj. Std. dev. under Statistics:
(In StatCrunch, Unadj. Std. dev. is the population standard deviation)
3) Click Compute!
The population standard deviation is computed and shown below.
(b) Find three simple random sample of size 4 and determine the sample standard deviation of each sample.
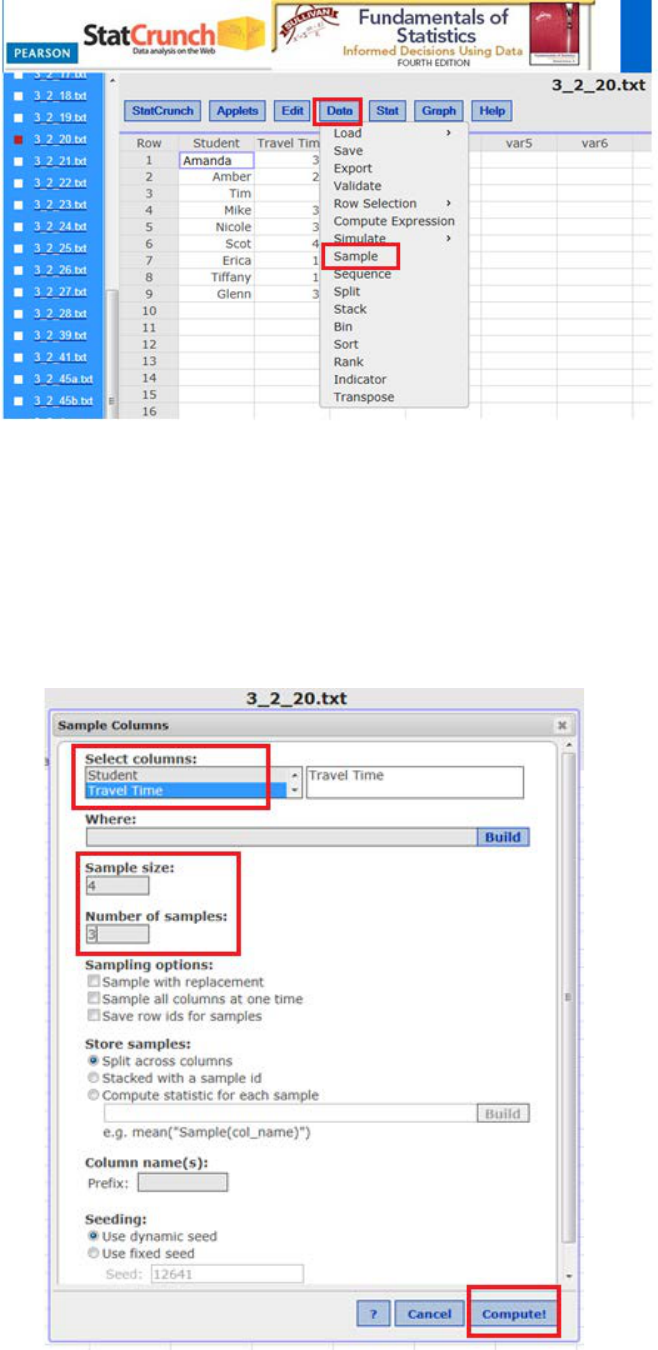
Step 1: To find the three simple random sample of size 4, click Data → Sample.
Step 2: 1) Click Travel Time under Select Columns:
2) Enter 4 for Sample Size: ---> 3 for Number of Samples:
(StatCrunch is randomly selecting the travel time of 4 people out of 9 people in the
population and repeat the experiment 2 more times.)
3) Click Compute!
Note: Since the sample data are randomly selected, each time you perform step 2, you will obtain
different sample data sets.
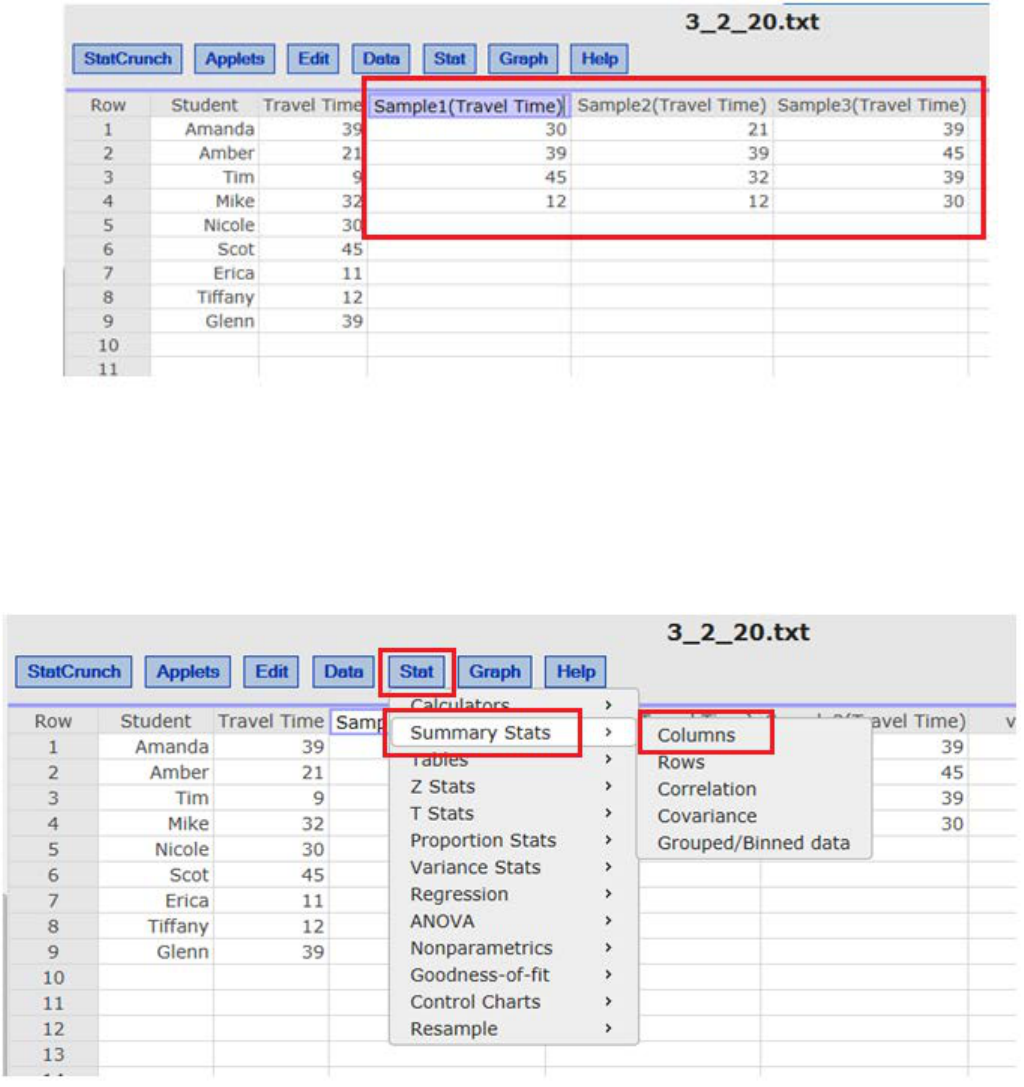
The three sample data sets are placed in three different columns.
Step 3: To find sample standard deviation, click Stat → Summary Stats → Columns.

Step 4: 1) Under Select column(s):, choose Sample1(Travel Time), Sample2(Travel Time), and
Sample3(Travel Time). (Click while holding the Ctrl key on the keyboard)
2) Choose Std. dev. under Statistics: (Use Std. dev. for sample standard deviation)
3) Click Compute!
The three sample standard deviations are computed and shown below.
(c) Which samples underestimate the population standard deviation? Which overestimate the population
standard deviation?
From part (b), sample standard deviation for Sample 1 is 14.39, for Sample 2 is 11.92, and for Sample 3
is 6.18. The population standard deviation, from part (a), is 12.84. Therefore, Sample 1 overestimates
and Sample 2 and 3 underestimate the population standard deviation.
