
1
The Linkage of National Center for Health Statistics Survey Data
to the National Death Index – 2019 Linked Mortality File (LMF): Linkage Methodology
and Analytic Considerations
Data Release Date: July 8, 2021
Document Version Date: June 2,2022
Division of Analysis and Epidemiology
National Center for Health Statistics
Centers for Disease Control and Prevention

2
Suggested Citation:
National Center for Health Statistics. The Linkage of National Center for Health Statistics Survey
Data to the National Death Index — 2019 Linked Mortality File (LMF): Linkage Methodology and
Analytic Considerations, June 2022. Hyattsville, Maryland.
Available at the following address:
https://www.cdc.gov/nchs/data-linkage/mortality-methods.htm
.
3
Table of Contents
1 Introduction .................................................................................................................................. 6
2 Data Sources ................................................................................................................................. 6
2.1 National Center for Health Statistics Survey Data ................................................................. 6
2.1.1 National Health Interview Survey (NHIS) ....................................................................... 6
2.1.2 National Health and Nutrition Examination Survey (NHANES) ...................................... 7
2.1.3 National Nursing Home Survey (NNHS) .......................................................................... 7
2.1.4 The Second Longitudinal Study of Aging (LSOA II) ......................................................... 8
2.2 National Death Index (NDI) ................................................................................................... 8
3 Linkage of NCHS Survey Data with the NDI .................................................................................. 8
3.1 Linkage Eligibility ................................................................................................................... 8
3.2 Overview of Linkage Methodology........................................................................................ 9
3.3 Linkage Rates ......................................................................................................................... 9
4 Analytic Considerations when using the Linked Mortality Files ................................................. 10
4.1 Linkage Eligibility Status ...................................................................................................... 10
4.2 Sample Weights ................................................................................................................... 11
4.2.1 Survey Sampling Weights ............................................................................................. 11
4.2.2 Eligibility-adjusted Sampling Weights .......................................................................... 11
4.2.3 NHIS Eligibility-adjusted Sampling Weights ................................................................. 11
4.2.4 Pooled Analyses of NCHS Linked Mortality Files: Pooling Survey Cycles and Estimating
Variance ................................................................................................................................. 12
4.3 Age Considerations .............................................................................................................. 12
4.3.1 Linkage of Survey Participants with Improbable Ages ................................................. 12
4.3.2 Inconsistencies in Reported Age .................................................................................. 13
4.4 Source of Mortality Information ......................................................................................... 13
4.5 Analytic Considerations with the Linked Mortality Files ..................................................... 13
4.6 Missing Information on Date of Death ................................................................................ 13
4.7 Negative Follow-up Time for the National Nursing Home Surveys ..................................... 13
4.8 1992 NHIS Hispanic Oversample ......................................................................................... 13
4.9 Restricted-Use Linked Mortality Files Variables .................................................................. 14
4.9.1 NDI Variables ................................................................................................................ 14
4.9.2 Death Certificate Information ...................................................................................... 14
4.9.3 Restricted-Use Linked Mortality Files Match Result Variables..................................... 14
4.10 Access to the Restricted-use Linked Mortality Files .......................................................... 15
4
4.11 Public-Use Linked Mortality Files ...................................................................................... 15
Appendix I: Detailed Description of the Linkage Methodology .................................................... 16
1 Submission File Creation ........................................................................................................ 16
1.1 NCHS Surveys ................................................................................................................... 16
1.2 NDI ................................................................................................................................... 16
2 Deterministic Linkage Using SSN ............................................................................................ 16
3 Probabilistic Linkage ............................................................................................................... 17
3.1 Blocking ........................................................................................................................... 17
3.2 Score Pairs ....................................................................................................................... 18
3.3 Estimate Probabilities ...................................................................................................... 20
3.4 Adjustment for SSN Agreement ...................................................................................... 20
3.5 Select Matches for Final File ............................................................................................ 21
Appendix II: Comparison of Current (2019) and Previously Released (2015) Linked Mortality Files
....................................................................................................................................................... 23
1 Background ............................................................................................................................. 23
2 Comparison of the 2019 and 2015 LMFs ................................................................................ 23
3 Comparison of the 2019 and 2015 LMF with External Data Sources ..................................... 26
4 Conclusions ............................................................................................................................. 27
Appendix III: Merging Restricted-use LMF Data and Public-use NCHS Survey Data ..................... 28
1 National Health Interview Survey (NHIS), 1986-2018 ............................................................ 28
1.1 NHIS 1986-1994 ............................................................................................................... 28
1.2 NHIS 1995-1996 ............................................................................................................... 29
1.3 NHIS 1997-2003 ............................................................................................................... 29
1.4 NHIS 2004 ........................................................................................................................ 30
1.5 NHIS 2005-2018 ............................................................................................................... 30
2 National Health and Nutrition Examination Surveys (NHANES) ............................................. 30
2.1 National Health and Nutrition Examination Survey (NHANES), 1999-2018 .................... 30
2.2 Third National Health and Nutrition Examination Survey (NHANES III) .......................... 31
2.3 NHANES I Epidemiologic Follow-up Study (NHEFS) ......................................................... 31
3 LSOA II ..................................................................................................................................... 31
References ..................................................................................................................................... 32
5
List of acronyms
CI, confidence interval
DVS, Division of Vital Statistics
EM, expectation maximization
ERB, Ethics Review Board
HICN, Health Insurance Claim Number
HR, hazard ratio
ICD, International Classification of Diseases, Injuries, and Causes of Death
IRB, institutional review board
LMF, linked mortality file
LSOA II, Second Longitudinal Study of Aging
MCOD, multiple cause of death
MEC, mobile examination center
MEPS, Medical Expenditure Panel Survey
NCHS, National Center for Health Statistics
NDI, National Death Index
NHANES, National Health and Nutrition Examination Survey
NHANES III, Third National Health and Nutrition Examination Survey
NHEFS, NHANES I Epidemiologic Follow-Up Study
NHIS, National Health Interview Survey
NNHS, National Nursing Home Survey
NVSS, National Vital Statistics System
PII, personally identifiable information
RDC, Research Data Center
SSA, Social Security Administration
SSN, Social Security Number
SSN9, nine-digit Social Security Number
SSN4, four-digit Social Security Number
UCOD, underlying cause of death
WTFA, public-use annual final basic weight

6
1 Introduction
The National Center for Health Statistics (NCHS) has a longstanding data linkage program that
integrates data collected from national population and provider surveys with key sources of
health outcomes and health care utilization information, including health care utilization and
cost data for Medicare and Medicaid beneficiaries, federal housing program assistance from the
Department of Housing and Urban Development, and mortality data from death certificates
from the National Death Index (NDI). The linkage between the NCHS survey data and the NDI is
intended to maximize the scientific value of NCHS survey data by adding information collected
from death certificates for deceased survey participants. These data, collectively referred to as
the Linked Mortality Files (LMF), include mortality follow-up data through December 31, 2019.
This report describes the most recent linkage conducted between selected NCHS surveys and
the NDI. A brief overview of the data sources, the methods used for linkage, descriptions of the
resulting linked data files, and analytic considerations are provided in this report. For more
information or questions about the LMF, please visit the data linkage website or contact the
NCHS Data Linkage Program at [email protected]
.
2 Data Sources
2.1 National Center for Health Statistics Survey Data
NCHS has recently linked the following surveys to the NDI data through December 31, 2019. The
data used in this linkage were from the following population-based and establishment surveys
and years:
• National Health Interview Survey (NHIS): 1986-2018
• Continuous National Health and Nutrition Examination Survey (NHANES): 1999-2018
• NHANES III (1988-1994)
• NHANES I Epidemiologic Follow-up Study (NHEFS)
• Second Longitudinal Study of Aging (LSOA II)
• National Nursing Home Survey (NNHS): 1985, 1995, 1997, 2004
A brief description of the NCHS surveys included in the NDI linkage and the NDI follows.
2.1.1 National Health Interview Survey (NHIS)
NHIS is a nationally representative, cross-sectional household interview survey that serves as an
important source of information on the health of the civilian, noninstitutionalized population of
the United States. It is a multistage sample survey with primary sampling units of counties or
adjacent counties, secondary sampling units of clusters of houses, tertiary sampling units of
households, and finally, persons within households. It has been conducted continuously since
1957 and the content of the survey is periodically updated. NHIS has been used as the sampling
frame for other NCHS surveys focusing on specialized populations, including LSOA II.
Prior to 2007, NHIS collected full nine-digit Social Security Numbers (SSN) from survey
participants. However, in attempt to address respondents’ increasing refusal to provide SSN and
consent for linkage, NHIS began, in 2007, to collect only the last four digits of SSN and added an
explicit question about linkage for those who refused to provide SSN. The implications of this
procedural change on data linkage activities are referenced in relevant sections of this report,
such as the match rate tables in section 3.3. For detailed information on the NHIS’s contents and
methods, refer to the NHIS website [1].
7
2.1.2 National Health and Nutrition Examination Survey (NHANES)
NHANES is a continuous, nationally representative survey designed to assess the health and
nutritional status of adults and children in the United States [2]. It is a nationally representative,
cross-sectional sample of the U.S. civilian noninstitutionalized population, consisting of about
5,000 persons from 15 different counties each year selected using a complex, multistage
probability design. The NHANES interview includes demographic, socioeconomic, dietary, and
health-related questions, while the examination, conducted in a mobile examination center
(MEC), consists of medical, dental, and physiological measurements, as well as laboratory tests.
The NHANES program began in the early 1960s and has been conducted as a series of surveys
focusing on different population groups or health topics. In 1999, the survey became a
continuous program that has a changing focus on a variety of health and nutrition
measurements, collected in two-year cycles [3]. NHANES cycles from 1999-2000 through 2017-
2018 were included in this linkage.
NHANES continued to collect full nine-digit SSN through the 2017-2018 survey cycle. Starting in
2017-2018, survey participants who consented to linkage but who refused to provide their full
nine-digit SSN were given the option to provide only the last four digits.
Prior to transitioning to a continuous survey in 1999, NHANES was conducted periodically, with
the last periodic survey, NHANES III, conducted in two phases between 1988 and 1994 [4].
NHANES III was designed to provide national estimates of the health and nutritional status of
the civilian noninstitutionalized population of the United States aged two months and older. It
was a nationwide probability sample of 39,695 persons. Similar to the continuous survey,
NHANES III included a standardized physical examination, laboratory tests, and questionnaires
that covered various health-related topics.
The NHANES I Epidemiologic Follow-Up Study (NHEFS) was a national longitudinal study jointly
initiated by the National Center for Health Statistics and the National Institute on Aging in
collaboration with other agencies of the Public Health Service [5]. The NHEFS cohort included all
persons 25-74 years of age who completed a medical examination as part of NHANES I in 1971-
75 (n=14,407). The NHEFS study design included four follow-up interviews, conducted in 1982-
84, 1986, 1987, and 1992, to investigate the relationships between clinical, nutritional, and
behavioral factors assessed at baseline, and subsequent morbidity, mortality, and
institutionalization. The NHEFS sample was included in the current linkage.
2.1.3 National Nursing Home Survey (NNHS)
NNHS provides information on nursing homes from two perspectives: that of the provider of
services and that of the recipient of care. Data for the surveys were obtained through personal
interviews with facility administrators and designated staff who used administrative records to
answer questions about the facilities, staff, services and programs, and medical records to
answer questions about the residents [6]. NNHS was first conducted in 1973-1974 and repeated
in 1977, 1985, 1995, 1997, 1999, and most recently in 2004. The 1985, 1995, 1997, and 2004
surveys were included in the current linkage.
8
2.1.4 The Second Longitudinal Study of Aging (LSOA II)
LSOA II was a collaborative effort of NCHS and the National Institute on Aging, conducted in
conjunction with the 1994 NHIS [7]. It was a prospective study of a nationally representative
sample of civilian, non-institutionalized persons 70 years of age and over at the time of their
1994 NHIS interview, which served as the baseline for the study. The LSOA II study design
included two follow-up telephone interviews, conducted in 1997-98 and 1999-2000. The LSOA II
provides information on changes in disability and functioning, individual health risks and
behaviors in the elderly, and use of medical care and services employed for assisted community
living.
2.2 National Death Index (NDI)
The NDI is a centralized database of United States death record information on file in state vital
statistics offices. Working with these state offices, NCHS established the NDI as a resource for
epidemiologists and other health and medical investigators to obtain mortality follow-up
information on their study participants [8]. The NDI became operational in 1981 and includes
death record information for persons who died in the U.S. or a U.S. territory from 1979 onward.
The records, which are compiled annually into the register, include detailed information on the
underlying and multiple causes of death.
The NDI contains identifying information for each death in order to conduct linkages. The
identifiers from the NDI that are used in the linkage with the survey data are SSN, first name,
middle initial, last name, father’s surname, month of birth, day of birth, year of birth, sex, race,
state or country of birth, and state of residence. This linkage with the NDI contains deaths from
January 1, 1979 through December 31, 2019.
3 Linkage of NCHS Survey Data with the NDI
3.1 Linkage Eligibility
The linkage of the NCHS survey data and the NDI was reviewed and approved by the NCHS
Research Ethics Review Board (ERB). The NCHS Research ERB, which functions similar to an
Institutional Review Board (IRB), is an appointed ethics review committee that ensures research
involving human participants and the welfare of study participants conform to federal
regulations. All survey participants with sufficient identifying data were eligible for mortality
linkage. Each survey participant’s record was screened to determine if it contained at least one
of the following combinations of identifying data elements:
1. SSN (nine digits, SSN9, or last four digits, SSN4), last name, first name
2. SSN (nine digits (SSN9) or last four digits (SSN4)), sex, month of birth, day of birth,
year of birth
3. Last name, first name, month of birth, year of birth
Any survey participant records that did not meet these minimum data requirements were
considered ineligible for record linkage. For NHIS 2015-2018, only sample adult and sample child
survey participants were eligible for mortality linkage.
Eligibility status for mortality follow-up is indicated by the variable ELIGSTAT. The available
values include 0 (ineligible) or 1 (eligible). All survey participants are included on the LMFs.

9
3.2 Overview of Linkage Methodology
The following section outlines steps used to link NCHS survey data to NDI death records through
2019. For more details, see Appendix I
.
The primary identifiers used in the linkages were: SSN9 or SSN4 (depending on the survey year
or cycle of the survey), first name, middle initial, last name or father’s surname, month of birth,
day of birth, year of birth, state of birth, state of residence, race, and sex.
The linkage between the NCHS survey data and the NDI was based on both deterministic and
probabilistic approaches. The probabilistic approach performs weighting and link adjudication
following the Fellegi-Sunter method [9]. The Fellegi-Sunter method is the foundational
methodology used for record linkage. It estimates the likelihood that each pair is a match before
selecting the most probable match between a survey record and NDI record. Following these
approaches, a selection process was implemented with the goal of selecting pairs believed to
represent the same individual between the data sources. The three main steps taken to link the
NCHS survey data to the NDI are as follows:
1. Deterministic linkage was conducted, joining on exact SSN, and validated by comparison of
other identifying fields.
2. Probabilistic linkage was conducted, identifying likely matches, or links, between all records.
All deterministic matched pairs (from Step 1) were assigned a probabilistic match probability
of 1; other records were linked and scored as follows (note that SSN is excluded from the
analysis for this step):
a. Pairs were formed via blocking.
b. Potential matches were scored based on the concurrence of first name, middle initial,
last name or father’s surname, year of birth, month of birth, day of birth, state of birth,
state of residence, race, and sex.
c. Match probabilities were estimated through a model which assigned the estimated
probability that pairs are matches.
3. Pairs were selected which were believed to represent the same individual between the data
sources. The pair having the highest estimated match probability was kept as long as it was
above the linkage cut-off (see Appendix I
).
The linkage algorithm was developed with custom code (using SAS 9.4) and was tailored to
perform these specific linkages, in order to produce high-quality matches with a low degree of
linkage error. More detailed descriptions of the linkage methodology can be found in Appendix I
of this report.
3.3 Linkage Rates
Tables 1 and 2 provide linkage eligibility rates and linkage results for adults 18 and over for NHIS
(1986-2018), NHANES III (1988-1994), and NHANES (1999-2018). For each of these linked NCHS
surveys, the tables present the total survey sample size, the sample size eligible for the NDI
linkage, the number of eligible survey participants linked to the NDI, and the match rate for both
the total survey sample and the eligible survey sample by age categories. Age was defined as the
survey participant’s age at interview. The eligible survey sample includes only survey
participants who were considered eligible for linkage as previously described. NHIS years were
separated into three groups for this analysis, 1986-1996, 1997-2006 and 2007-2018. As noted
earlier, starting in 2007, NHIS began to collect only the last four digits of SSN. As shown in Tables

10
1 and 2, linkage rates (the percent linked out of the eligible sample) for NHIS and NHANES varied
by survey years/cycles and age groups.
Table 1. 1986-2018 NHIS Linked Mortality Files (with follow-up through 2019): Sample Sizes
for Adults 18 and Over and Unweighted Percentages by Survey Year and Age at Interview
Survey
Total
sample
size
Eligible for
linkage
%
Eligible
out of
total
Linked
to NDI
%
Linked
out of
eligible
Total
851,361
834,619
98.0
290,682
34.8
NHIS 1986-1996
18-64
708,491
694,004
98.0
161,104
23.2
65 and over
142,870
140,615
98.4
129,578
92.2
Total
687,200
613,421
89.3
120,424
19.6
NHIS 1997-2006
18-64
579,430
515,774
89.0
51,912
10.1
65 and over
107,770
97,647
90.6
68,512
70.2
Total
675,729
650,062
96.2
48,401
7.4
NHIS 2007-2018*
18-64
550,674
528,747
96.0
16,142
3.1
65 and over
125,055
121,315
97.0
32,259
26.6
*For 2015-2018 NHIS only sample adults are included
Table 2. NHANES III and 1999-2018 NHANES Linked Mortality Files (with follow-up through
2019): Sample Sizes for Adults 18 and Over and Unweighted Percentages by Survey Year/Cycle
and Age at Interview
Survey
Total
sample
size
Eligible
for
linkage
% Eligible
out of
total
Linked
to NDI
% Linked
out of
eligible
Total
19,618
19,599
99.9
8,623
44.0
NHANES III (1988-1994)
18-64
14,366
14,350
99.9
3,606
25.1
65 and over
5,252
5,249
99.9
5,017
95.6
Total
59,204
59,064
99.8
9,249
15.7
NHANES 1999-2018
18-64
45,153
45,038
99.7
2,688
6.0
65 and over
14,051
14,026
99.8
6,561
46.8
4 Analytic Considerations when using the Linked Mortality Files
This section summarizes general considerations and guidelines for analysis when using the 2019
LMFs. These considerations are specific to the LMF and do not replace the guidance for
analyzing data solely from the NCHS surveys or the NDI. This is not an exhaustive list of the
analytic issues that researchers may encounter while using the LMFs. This document will be
updated as additional analytic issues are identified and brought to the attention of the NCHS
Data Linkage Team (datalinkage@cdc.gov
).
4.1 Linkage Eligibility Status
All participants with sufficient identifying data were eligible for mortality follow-up. Each record
was screened to determine if it contained at least one of the combinations of identifying data
elements required for linkage eligibility
as noted in Section 3.1. Any survey participant record
that did not meet the minimum data requirements was ineligible for record linkage. Eligibility
status for mortality follow-up is indicated by the variable ELIGSTAT. For analyses using the LMFs,
11
analysts should limit their analysis to those survey records with a value of ELIGSTAT = 1. Across
all surveys included in this linkage, 94.8% of the survey participants were eligible for the
mortality follow-up. As shown in Tables 1 and 2, eligibility in NHIS and NHANES was greater than
99.5% for the different survey years/cycles.
4.2 Sample Weights
4.2.1 Survey Sampling Weights
The sample weights provided in the NCHS survey data files adjust for oversampling of specific
subgroups and differential nonresponse and are post-stratified to annual population totals for
specific population domains to provide nationally representative estimates. The use of sampling
weights and sample design variables is recommended to account for the complex survey design
of the NCHS surveys. Failure to account for the complex survey design may produce biased
estimates and overstated significance levels.
4.2.2 Eligibility-adjusted Sampling Weights
The properties of the survey sample weights for linked data files with incomplete linkage, due to
ineligibility for linkage, are unknown. In addition, methods for using the survey weights for some
longitudinal analyses require further research. Because this is an important and complex
methodological topic, ongoing work is being done at NCHS and elsewhere to examine the use of
survey weights for linked data in multiple ways. One approach is to analyze linked data files
using adjusted sample weights. The sample weights available on NCHS population health survey
data files can be adjusted for linkage eligibility (nonresponse), using standard weighting domains
to reproduce population counts within these domains: sex, age, and race and ethnicity
subgroups. These counts are called “control totals” and are estimated from the full survey
sample.
Eligibility-adjusted weights are provided for NHIS. For analyses using the 2019 LMF for other
surveys, researchers may consider adjusting the original sampling weight to account for linkage
ineligibility due to insufficient identifying data. Depending on the number of ineligible survey
participants, ignoring linkage ineligibility may lead to biased mortality estimates.
A model-based calibration approach developed within the SUDAAN software package
(WTADJUST procedure) allows auxiliary information to be used to adjust the statistical weights
for non-response. Additional information on using Procedure WTADJUST to adjust sample
weights for linkage eligibility, including sample SUDAAN code, is available from the NCHS Data
Linkage Program [10].
4.2.3 NHIS Eligibility-adjusted Sampling Weights
The NCHS Data Linkage Program has provided eligibility-adjusted weights for the 1987-2018
NHIS for use with the 2019 LMFs. Treating the linkage-eligible sample from the NHIS as a
subsample of the original NHIS sample allows for the original post-stratification adjustment
method to be used to inflate the sampling weights. The tacit assumption is that the adjustment
cells used will mitigate estimation bias due to using only the eligible sample.
Because there are no eligibility-adjusted sample weights for the 1986 NHIS, NCHS recommends
using the public-use annual final basic weight (WTFA) for that survey year. For the 1987-2018
12
NHIS, participants classified as eligible for mortality follow-up had their original NHIS sampling
weight adjusted to account for linkage ineligibility due to insufficient identification data. The
new eligibility-adjusted sample weights provided on the 2019 LMFs are recommended for use,
rather than the original NHIS sample weights, to prevent biased mortality estimates. A recent
NCHS report assessed linkage eligibility bias for various sociodemographic groups and health-
related variables for the 2000–2013 NHIS and supported that much of the bias was mitigated
with weight adjustments [11]. The 2019 LMFs include three eligibility-adjusted sample weights
for the NHIS: (1) person-level for NHIS years 1987-2014 (WGT_NEW); (2) sample adult in NHIS
years 1997-2018 (SA_WGT_NEW); and (3) sample child in NHIS years 1997-2018
(SC_WGT_NEW). The 1987-1996 NHIS did not include sample adult or sample child files, and
therefore only person-level adjusted weights are provided for these years. Similarly, only sample
adults and children were eligible for linkage for NHIS 2015-2018, and therefore there are no
person-level adjusted weights for these years.
4.2.4 Pooled Analyses of NCHS Linked Mortality Files: Pooling Survey Cycles and Estimating
Variance
To increase the sample size for many types of analyses, analysts may wish to pool several survey
years (or cycles). When survey years (cycles) are combined, the estimates will be representative
of the population at the midpoint of the combined survey period. Analysts should refer to the
specific surveys (e.g., NHIS, NHANES) regarding how to adjust sample weights when pooling
years. A simple, valid weight adjustment procedure that NCHS recommends is to divide each
sample weight in the pooled dataset by the number of years that are being pooled. For example,
divide by 2 when two years (cycles) of survey data are combined, divide by 3 when three years
of data are combined, etc. Please note that when combining survey years (cycles) it is the data
user’s responsibility to examine possible changes in variable names and locations of the data
files. Differences in study design variables may also be an issue when pooling survey years
within a specific survey.
NHIS has provided analysts with guidance for variance estimation for pooled analyses of NHIS
years [12-15]. NHANES also provides tutorials on pooling years of NHANES data, including
construction of appropriate pooled sample weights [16].
4.3 Age Considerations
4.3.1 Linkage of Survey Participants with Improbable Ages
The 2019 LMFs include records where the calculated age for participants presumed alive at the
end of mortality follow-up is 100 years or more. For these cases, there was no valid NDI record
match or other source of mortality information. The NDI only includes deaths that occurred in
the United States or a U.S. territory and therefore may not include death information for some
deceased survey participants if they left the U.S. prior to death. Given the probabilistic nature of
the mortality ascertainment and the lower likelihood of being alive at 100 years or older,
analysts may wish to consider these cases as lost to follow-up and exclude them from the
analysis.
A practical method for determining an age cutoff at which participants should be considered lost
to follow-up is to use the probability of a member in a particular population dying at, or living to,
a particular age. The Social Security Administration (SSA) published a report in 2005 containing
projections of mortality for cohorts of births in decennial years 1900 through 2100 [17]. Based

13
on these cohort life tables NCHS has calculated probabilities of death, conditional on year of
birth and sex, but not adjusted for last known alive year (typically the year of survey response).
These probabilities are available for researchers upon request by contacting
.
4.3.2 Inconsistencies in Reported Age
Misreporting or discrepancies between reported age at interview and the date of birth may
result in values for age at death that are inconsistent with baseline age when date of death and
date of birth are used to calculate the age at death. The number of cases where this occurs is
small, but analysts should be aware and make appropriate adjustments to the data.
4.4 Source of Mortality Information
The primary determination of mortality for eligible participants is based upon matching the
survey data to the NDI, although additional sources of mortality information are also
incorporated. These sources include data collection and ascertainment of death certificates for
NCHS follow-up surveys (e.g., NHEFS). Source of mortality information is indicated by the
variables MORTSRCE_NDI, MORTSRCE_DCL, and MORTSRCE_DC. The variable MORTSTAT
indicates the vital status of a participant. If a participant was linkage-eligible and considered
deceased by linkage to the NDI, MORTSTAT is set to a value of 1. If the participant was linkage-
eligible and considered deceased via data collection or death certification ascertainment and did
not link to the NDI, MORTSTAT is set to a value of 2. Those with a MORTSTAT value of 0 are
linkage eligible and assumed alive and those with a value of missing are not eligible for linkage.
4.5 Analytic Considerations with the Linked Mortality Files
Analysis of the 2019 LMF presents certain analytic considerations due to the potential for
differential follow-up times and censoring bias. An overview of these issues when working with
survey data can be found in “Statistical Issues in Analyzing the NHANES I Epidemiologic Followup
Study” report [18].
4.6 Missing Information on Date of Death
Some NDI records have missing information for the month or day of death. In the 2019 LMF,
there are instances when the month or day of death are missing for survey participant records
linked to the NDI. Analysts may consider imputing these values or dropping the records from
their analysis.
4.7 Negative Follow-up Time for the National Nursing Home Surveys
Some linked survey participants from the National Nursing Home Surveys may have a date of
death prior to date of discharge, resulting in negative follow-up time. Linked participants with
negative follow-up times of up to 30 days were retained as matches for these surveys. Analysts
should consider how they will assess these records for their analyses.
4.8 1992 NHIS Hispanic Oversample
The 1992 NHIS included a special oversample of the Hispanic population. The oversample was
created by re-contacting Hispanic survey participants from the 1991 NHIS. Researchers planning
to pool these two years of survey data should use the special 1992 NHIS file that excludes the
participants who were also interviewed in 1991. For more information, please refer to the NHIS
public-use data documentation supplement [19]. In addition, if researchers exclude the 1992

14
Hispanic oversample from pooled analyses, they should create new adjusted sample weights to
properly adjust for linkage-ineligible survey participants. Guidance for the construction of new
weights can be found in Appendix III of the “Linkage of NCHS Population Health Surveys to
Administrative Records From Social Security Administration and Centers for Medicare &
Medicaid Services” series report [10].
4.9 Restricted-Use Linked Mortality Files Variables
4.9.1 NDI Variables
The 2019 LMF contains information about date of birth, date of interview and date of death.
These variables can be used to calculate follow up time. In addition, the 2019 LMF includes
information about fact of death (MORTSTAT) and cause of death. The file includes an indicator
noting if cause of death information is available (CAUSEAVL). There are some instances where a
record matched the NDI but there is no cause of death information available. This is relatively
rare.
Underlying and multiple causes of death are categorized using the International Classification of
Diseases, Injuries, and Causes of Death (ICD), Ninth Revision (ICD–9) and, from 1999 onwards,
the 10th Revision (ICD–10). The underlying cause of death code (UCOD) is coded according to
the ICD-9 for deaths occurring through 1998. The UCOD is coded according to the ICD-10 for
deaths occurring between 1999 and 2019. The variables with these codes are ICD_9REV and
ICD_10REV. In addition, the ICD-9 UCODs are grouped in 282, 72 and 34 recodes and the ICD-10
UCODs are grouped into 358, 113, 39 recodes.
Lastly, the 2019 LMF includes three indicators if there was a specific condition listed as a
multiple cause of death (MCOD). These indicators are diabetes, hip fracture, and hypertension.
4.9.2 Death Certificate Information
Additional death certificate data are also made available to researchers using the restricted-use
LMF. These variables are prefixed with DVS and are populated for different death years. Not all
variables are available for all death years, and availability by year varies for each variable. The
data dictionary on the Restricted Use Linked LMF webpage, Death Certificate and NDI Match
Variables, contains the complete list of variable names, labels, and other metadata [20]. The
Division of Vital Statistics (DVS) has published data dictionaries that further provide information
on all variables prefixed with DVS that are present in the LMFs. If more information (e.g.,
definition of values) is sought about these variables, please refer to the National Vital Statistics
System (NVSS) Public Use Data [21, 22].
4.9.3 Restricted-Use Linked Mortality Files Match Result Variables
Data linkages include some uncertainty over which pairs represent true matches. For the survey
data linked to the NDI, the probabilistic cut-off values used to determine which record pairs
were considered a link (an inferred match) were set at a point that minimized both the type I
error (false positives, or survey participants identified as deceased but actually alive) and the
type II error (false negatives, or survey participants who are actually deceased but identified as
alive due to non-linkage) or 0.85, whichever was higher (see Appendix I
for more detail).
For each candidate pair, the probability of match validity (PROBVALID) was computed based on
the within-block pair weight and the number of identifiers in agreement (see Appendix I
for

15
details). The PROBVALID cutoff is the threshold that produces the lowest total error (both type I
and type II) or 0.85, whichever was higher. Researchers can request access to PROBVALID to
adjust linkage certainty or to conduct sensitivity analyses of vital status.
4.10 Access to the Restricted-use Linked Mortality Files
To ensure confidentiality of the linked data, NCHS provides safeguards including the removal of
all direct personal identifiers from analytic files. Additionally, the linked data files are made
available in secure facilities for approved research projects. Researchers who want to access the
restricted-use 2019 LMF must submit a research proposal to the NCHS Research Data Center
(RDC) to obtain permission to access the restricted use files. All researchers must submit a
research proposal to determine if their project is feasible and to gain access to these restricted
data files. The proposal provides a framework which allows RDC staff to identify potential
disclosure risks. More information regarding the RDC and instructions for submitting an RDC
proposal are available on the RDC website [23].
Within the RDC, the 2019 LMF can be merged with NCHS restricted (if needed) and public-use
survey data files using unique survey person identification numbers (see Appendix III
for
merging based on PUBLICID).
4.11 Public-Use Linked Mortality Files
Public use LMFs with data through December 31, 2019, were released in May 2022 for 1986-
2018 NHIS, 1999-2018 NHANES, and NHANES III. These public-use LMFs include a limited set of
variables for adult participants only and were subjected to data perturbation techniques to
reduce participant disclosure risk. Synthetic data were substituted for follow-up time or
underlying cause of death for select records. Information regarding vital status was not
perturbed [24].

16
Appendix I: Detailed Description of the Linkage Methodology
1 Submission File Creation
To prepare records for linkage, standardized files for NDI and survey data were created. These
files are referred to as “submission files.” The submission files were created by performing basic
data cleaning, removing records missing essential information, and creating alternate records
for certain situations. The primary purpose of creating alternate submission records was to
increase the likelihood of returning a correct death record for those linkage eligible NCHS survey
participants who were, in fact, deceased. Alternate submission records were created for several
reasons, including to account for multiple name renderings. Specific conditions for which
alternate records were created are detailed below.
1.1 NCHS Surveys
The NCHS survey data submission file was created using records for linkage eligible survey
participants. First and last names were cleaned by removing foreign characters, pseudonyms,
and initials. SSN was also assessed to remove invalid values. A US or foreign birth indicator was
created from a variable based on state of birth. Alternate records were created for the following
conditions:
• Sex was missing. Two alternate records (one with male sex and the other with female)
were created.
• State of residence was missing, but ZIP code was present. An alternate record with
imputed state of residence based on ZIP code was created.
• First or last name had multiple parts. Alternate submission records were created that
used components of multi-part names both separately and together.
• Middle name had a common Hispanic or Asian surname. Alternate submission records
were created that moved these surnames to the last name and father’s surname fields.
• First name was recognized as a nickname that has a formal equivalent (e.g., reporting a
nickname like “Beth” for a formal name like “Elizabeth”). Alternate submission records
were created that used a nickname to proper name conversion process.
1.2 NDI
The NDI submission file was created using death records with a date of birth in 1865 or later and
a known year of death. First and last names were cleaned by removing foreign characters,
pseudonyms, and initials. Invalid values for date of birth fields, race, sex, and state of birth and
residence, and SSN were removed. A US or foreign birth indicator was created from a variable
based on state of birth. Alternate records were created for the conditions detailed above in
Section 1.1
above.
2 Deterministic Linkage Using SSN
The linkage process began with a deterministic linkage for all survey records with a valid format
SSN or an SSN extracted from a Medicare Health Insurance Claim Number (HICN). The
deterministic links were produced by pairing records with exactly the same SSN and comparing
the remaining identifiers – first name, middle initial, last name, month of birth, day of birth, year
of birth, and state of birth or residence (for records that do not have state of birth) – in order to
ensure that the paired records are a valid match. If the ratio of matching identifiers to non-
missing identifiers was at least 50% (for records with SSN9) or 65% (for records with SSN4), the
pair was retained as a deterministic match. In cases where this resulted in multiple matches for
17
a single participant, the record with the highest number of matching fields was retained. The
collection of pairs resulting from the deterministic match was referred to as the truth deck.
3 Probabilistic Linkage
In order to infer that a pair is a match, the linkage algorithm first identifies potential match pairs
(links) and then evaluates their probable validity (i.e., that they do represent the same
individual). The following sections describe these steps in detail. This linkage methodology
closely follows the Fellegi-Sunter paradigm, the foundational methodology used for record
linkage. The method estimates the likelihood that each pair is a match – using formulaic pair
weights computed for each identifier in the pair – before selecting the most probable match
between two records.
3.1 Blocking
The first step in the probabilistic matching process was to identify potential matches. This step is
commonly referred to as “blocking” [25], which is a key step in the record linkage process. It
identifies a smaller set of potential candidate pairs without having to compare every single pair
in the full comparison space (i.e., the Cartesian product). According to Christen (2012), blocking
or indexing “splits each database into smaller blocks according to some blocking criteria” [26].
Intuitively developed rules can be used to define the blocking criteria; however, for this linkage,
data were used to inform the development of a set of blocking passes that efficiently join the
datasets together (i.e., multiple overlapping blocking passes are run each using a different
blocking key). By using the data to create an efficient blocking scheme (or set of blocking passes)
a high percentage of true positive links were retained while significantly reducing the number of
false positive links. The ten variables that could be used for blocking were:
• Last name
• Father’s surname
• First name
• Year of birth
• State of birth
• State of residence
• Day of birth
• Month of birth
• Race
• Sex
3.1.1 Calculate M- and U- Probabilities
The next step was to calculate the M and U probabilities. The M-probability – the probability
that identifiers from the paired records agree, given that records represent the same person –
were estimated separately within each individual blocking pass. M-probabilities were calculated
for each of the identifiers not used in the blocking key. Within the blocking pass, pairs with non-
missing and agreeing (defined as 8 or more digits being the same) SSN were used to calculate
the M-probabilities, as these are assumed to represent the same individual.
Several additional comparison measures were created for first and last name identifiers in the
calculation of M-probabilities:
• First/last initial agreement – used in the scoring process when only an initial was
present in the name field

18
• Jaro-Winkler similarity levels – this process is explained in greater detail later in the
Appendix
• Last name is conditional on sex – because women frequently change their maiden
name to their spouse’s last name after marriage (or may change back to maiden in
event of divorce/widowing), this resulted in a lower agreement last name M-
probabilities for the female population and was taken into consideration when
computing corresponding agreement and non-agreement weights.
The U-probability – the probability that the two values for an identifier from paired records
agreed given that they were NOT a match. With the exception of first and last names, these
probabilities were calculated within each block, using records where non-missing SSNs were not
in agreement (i.e., less than 5 digits are the same).
Similar to the M-probabilities, U-probabilities were only calculated for the non-blocking
variables. However, for this linkage, the U-probabilities were calculated for each value (level) of
a variable. However, for first and last name, the U-probabilities were not calculated exactly in
the same manner, and the method used for them is described in the next section.
3.1.2 M and U Probabilities for First and Last Names
Similar to the M-probability, Jaro-Winkler levels (0.85, 0.90, 0.95, and 1.00) were calculated for
use in the U-probability computation. Because agreement levels fall over a range, first and last
name U-probabilities were computed for each Jaro-Winkler score level. Since there are a
plethora of possible values for first and last name (i.e., one for each possible name), it was
impractical to compute U- probabilities specific name for each blocking pass (i.e., there would
not be enough records available for it to be done accurately). Instead, U-probabilities were
estimated using pairs generated by the Cartesian product of unique names in the NCHS survey
submission file and the NDI submission file.
Complete name tallies (separately, for first and last names) were then produced for the NCHS
survey submission file. For each level of name on the file, names were selected from the NDI
submission file to compare to it. Comparisons were made based on the Jaro-Winkler distance
metric at four different levels: 1.00 (Exact Agreement), 0.95, 0.90, and 0.85. The number of
names in agreement from the NDI names that agreed at that level for each name were then
tallied [27-29].
3.2 Score Pairs
After identifying possible candidate pairs, each possible matched pair was scored using an
approach based on a framework described by Ivan Fellegi and Alan Sunter [9]. The framework
specifies the functional relationship between agreement probabilities and agreement and
disagreement weights for each identifier used in the linkage process. The relative likelihood that
a pair of records from two data files is a true match can be estimated by a match weight, the
sum of agreement weights A and disagreement weights D:

19
across match variables i
where m
i
= Prob(variable i agrees | true match), the rate of agreement among true matches,
u
i
= Prob(variable i agrees | non-match), the rate of agreement among non-matches,
the comparison weight for variable i
w
i
= A
i
if variable i agrees, the agreement weight, and
= D
i
if variable i disagrees, the disagreement weight
which sum across variables to w =
∑
, the match weight for the record pair (pair weight).
Summing the A and D weights across variables for a pair of records, analogous to multiplying
probabilities, assumes independence of the variables’ probabilities of agreement. This sum, the
pair’s match weight w, represents a relative rather than an absolute likelihood in the sense that
a higher weight simply signifies a greater probability of a match compared to a lower weight.
That is, the pairs with the highest match weight are most likely to be true matches.
Full pair weight and within-block pair weight scores were calculated for each candidate pair. The
full pair weight score was calculated as the sum of the comparison weight for all variables, while
the within-block pair weight was determined by summing the comparison weights for all
variables, excluding specifically the variables used to define each block (e.g., if blocking is by first
name and last name, then those two comparison weights were not used to calculate the within-
block pair weight score). Comparison weights were calculated for the following identifiers:
• Last name or last initial
1
• Father’s surname
2
• First name or first initial
3
• Decade of birth
• Year of birth
4
• US/foreign birth
• State/country of birth
5
• State of residence
• Day of birth
• Month of birth
• Race
• Sex
6
• Middle initial
Within-block pair weights were used to estimate the match probabilities, while the full pair
weights were used to adjust the match probability for SSN agreement. Both processes are
described in more detail below.
1
The larger pair weight between the two NDI last name comparisons (to survey record last name vs. to
father’s surname). Note that the M-probability was divided by 2 and the U-probability was multiplied by 2
if multiple comparisons were made.
2
The larger pair weight between the two NDI father’s surname comparisons (to survey record last name
vs. to father’s surname). Note that the M-probability is divided by 2 and the U-probability is multiplied by
2 if multiple comparisons are made.
3
If first name disagreed but first initial agreed with middle initial, then first name disagreement weight
was set to zero.
4
This was calculated conditionally based on agreement of decade of birth.
5
This was calculated conditionally based on agreement of US/foreign birth.
6
If sex and first name agreed, then sex agreement weight was set to zero.
20
Agreement and disagreement weights for each identifier of each record were computed from
the M-probability for the identifier and the U-probability for the value of the identifier from the
NDI record, using the formulas from the Fellegi-Sunter method described above. Agreement
weights were assigned for identifiers that had agreeing values, and disagreement weights were
assigned for identifiers that have disagreeing values. A disagreement weight will always be
negative and reduce the total weight for the candidate pair or the pair weight.
The pair weight was calculated for each record pair within a block by summing all the identifier-
specific comparison weights (agreement and disagreement weights) that were not used to
define the block. Therefore, if the identifier
• agreed, the identifier-specific agreement weight was added to the pair weight;
• disagreed, the identifier-specific disagreement weight (negative value) was added to the
pair weight; or
• was missing in either record, nothing was added to the pair weight.
3.3 Estimate Probabilities
The probability that a given pair within a block is a true match was estimated by a partial
expectation–maximization (EM) algorithm. It is considered partial because the within-block pair
weights are taken as given, rather than estimated iteratively. The partial EM algorithm
calculates a probability by making use of three facts:
1. The pair weight is the log (base 2) of an odds and can be converted to a probability. For
example, a pair weight of 3 is an odds of 2
3
= 8, and 8-to-1 odds is a probability of 0.889.
2. The sum of probabilities across all candidate pairs in a block equals the number of expected
matches in the block.
3. The proportion of matches in a block is the probability that any pair in the block is a match.
This value, converted to log odds, is an adjustment that is added to the within-block pair
weight before converting it to the probability that the pair is a match.
The only unknown is the number of matches in the block. This value is estimated by iteratively
summing the adjusted probabilities and re-calculating the adjustment. After enough iterations,
the summed probabilities (the estimated number of matches) does not change, the adjustment
can be considered accurate, and it can be applied to the within-block pair weight of each pair in
the block. The adjusted pair weight, being a log odds, is then converted to a probability that the
pair is a match.
3.4 Adjustment for SSN Agreement
Up to this point, every pair generated through the probabilistic routine was assigned a value
that estimates its probability of being a match. However, this estimate did not take SSN
agreement into account. This was conducted as a separate step because, for the other
comparison variables, M-probabilities were estimated based on probable matches that were
determined based on SSN agreement. Clearly, this was not feasible for SSN itself.
To remedy this, before the algorithm adjudicated the matches against the probability threshold,
one final adjustment was made to the match probabilities (for probabilistic pairs). For pairs that
had an SSN on both the survey and NDI record, the estimated probability was adjusted based on
21
whether SSN agreed. This allows for more accurate adjudication of links where other personally
identifiable information (PII) may not provide a clear indication of match status.
When SSN agreed:
When SSN did not agree:
The M-probability for SSN is estimated as the rate of SSN agreement for records with high
estimated match probabilities (i.e., those with the highest full pair weight scores). The U-
probability represents the random chance that SSN will agree between two records that are not
a true match. It was estimated by calculated the percentage of candidate pairs with the lowest
full pair weight scores that had agreeing SSNs. For SSN9, the SSNs were considered to agree if at
least 7 of the 9 digits matched between the SSNs in the two records. For SSN4, all 4 digits had to
match.
For pairs that did not have an SSN on either the NCHS survey or NDI record or came from
deterministic linkage, no adjustment was made. So, for these pairs:
3.5 Select Matches for Final File
Up to this point, matches have been identified using deterministic linkage and candidate pairs
that were developed based on the blocking criteria and the scoring within block. The process
has assigned probabilities to each candidate pair that represent its probability of being a true
match, with and without consideration of SSN similarity. The deterministic matches were
automatically assigned a probability value of 1, while the candidate pairs have been assigned
probabilities between 0 and 1 (non-inclusive).
The next step is to determine a probability threshold that best minimizes errors in classifying
pairs as true matches or non-matches. For this step, the probability assigned to each candidate
pair by partial EM (excluding any consideration of SSN similarity) is used. For a given probability
threshold, the candidate pairs with an estimated probability meeting a given threshold were
compared to the truth deck to identify those that were selected and are in fact true matches.
(For survey records linked to multiple NDI records, the pair with the highest probability is
selected.) Based on this comparison, the following were estimated:
• the false positivity rate, which is the percentage of candidate pairs with non-matching
SSNs, and
• the percentage of true matches (the truth deck) found by using the linkage process.

22
One goal of the record linkage was to have the lowest linkage errors possible. However, as more
pairs were accepted, pairs that were less certain to be matches as links increase the Type I error
(among pairs that are linked, what percentage of them were not true matches) and decrease
Type II error (among true matches, how many were not linked). And as fewer pairs were
accepted, pairs that were more certain to be matches as links decrease the Type I error and
increase Type II error. The optimal trade-off between Type I error and Type II error was not
known, and likely this depends on the type of analysis to be conducted with the linked data, but
it is assumed that it is not far from optimality when the sum of Type I and Type II error is at a
minimum. For this reason, Type I and Type II error are estimated at various probability cut
points and the one that showed the lowest estimate of total error was selected.
These two error rates combined were then used to estimate the total error. A probability cutoff
of 0.99 was selected for matches from 1986-2018 NHIS, NHANES III, and 1999-2018 NHANES,
and a cutoff of 0.9998 was used for NHEFS and LSOA II. These were the thresholds that
minimized total error for those surveys. The cutoff for the National Nursing Home Surveys was
0.85. Although 0.85 did not minimize the total error for these surveys, it was chosen because
there are concerns that using pairs with low PROBVALID might be inappropriate for certain
analyses of linked records, therefore PROBVALID = 0.85 was established as the lowest threshold
that will be used for the acceptance of links into datasets made available for external
researchers [30, 31]. The table below notes the estimated Type I and Type II errors based on the
surveys.
Table. Error rates and threshold by survey
Survey
Type I
Type II
Total Error
Threshold
1986-2018 NHIS
2%
1%
3%
0.99
NHANES III and 1999-2018 NHANES
1%
1%
2%
0.99
NHEFS and LSOA II
0.2%
<0.0001%
0.2%
0.9998
NNHS (1985, 1995, 1997, 2004)
0.6%
9%
9.6%
0.85
Finally, using the adjusted probability estimate that incorporated SSN similarity, the pairs that
exceeded the probability threshold were determined to be links. All pairs with an adjusted
probability that fell below the set probability threshold were not linked.
Following link determination, the algorithm selected the best link for each NCHS survey
participant (if more than one link existed). The algorithm carried out this process by selecting
the link with the highest match probability. In the event that there was a tie for the top match
probability, the algorithm selected the link with the best matching SSN. If a tie still remained,
the algorithm then randomly selected one of the links.

23
Appendix II: Comparison of Current (2019) and Previously Released (2015) Linked Mortality Files
1 Background
To account for changes in the data collection process for some NCHS surveys and potential
demographic shifts among survey participants, an enhanced linkage methodology was adopted
to link the survey and NDI data for the production of the 2019 LMF. The algorithms used for
previous linkages were based on the methods described in Appendix A of the “National Death
Index User’s Guide,” with slight modifications made by the Data Linkage Program at NCHS [32].
While this methodology appeared suitable for survey data collected prior to 2007, changes in
survey sample design and in the collection of PII and linkage consent suggested an enhanced
linkage methodology should be assessed. As noted in the survey description section of this
report, in 2007 NHIS started collecting only the last four digits of SSN (SSN4) or no SSN with
consent to link as part of the linkage consent process. This resulted in less complete survey
participant PII that was available for linkage and this, in turn, had an impact on the linkage
process as well as the quality of the resulting linked files. This led to the need for the
development of a more rigorous methodology for linking data.
Additionally, over time researchers began to note inconsistencies by race and ethnicity in
survival analyses and declines in linkage quality when analyzing the previous LMFs [33, 34].
These issues may be at least partially attributed to the data sources originally used to calibrate
the previously utilized NDI linkage algorithm [32]. The NHANES I Epidemiologic Follow-up study
(NHEFS), used for calibration of the previous NDI linkage algorithm, was a longitudinal study
conducted in the 1980s and early 1990s with a modest sample size (n=14,407). As part of the
follow up survey, NHEFS collected death certificates for survey participants identified as
deceased [18]. The death certificate data were used to establish a “truth” source when the NDI
linkage algorithm was initially developed. The algorithm relied on grouping potential matches
into five categories (called classes) based on the amount of PII available and in agreement. Final
match status was assigned through the use of recommended cutoff scores developed for each
class. Since the NDI linkage algorithm had not been re-calibrated for use with more recent
survey data, the NCHS Data Linkage Program began to explore ways to enhance the algorithm to
improve the quality of matches and to minimize linkage error.
2 Comparison of the 2019 and 2015 LMFs
As noted in Appendix I
of this report, the algorithm used in the production of the 2019 LMF used
both deterministic and probabilistic techniques, similar to those described by Fellegi and Sunter
[9]. While this approach differed from the previous mortality linkage algorithms, the overall
linkage results were similar (particularly for records with SSN9 available) when comparing
results from the 2019 LMF and the 2015 LMF. When both datasets were limited to the same
follow up time (December 31, 2015), the 2019 LMF captured about 94.0% of the previously
linked records in the 2015 LMFs for all NCHS surveys included in both linkages. The enhanced
algorithm had the most impact in the NHIS years when only SSN4 or no SSN was collected.
Specifically pertaining to the NHIS, from 2007-2014 (the years when the collection of SSNs
changed) the 2019 LMF captured 83.3% of the previously linked records. However, in the prior
years when SSN9 was collected, 1986-2006 NHIS, the 2019 LMF captured 94.0% of the
previously linked records. Of note, for the 1999-2014 NHANES where the collection of SSN9
continued to be part of the data collection process, the 2019 LMF captured 92.5% of the
previously linked records.

24
To further understand the differences in the quality of the matches we assessed the proportion
classified as low or high certainty matches for the matches on the off diagonals (those in the
2015 LMF and not the 2019 LMF and those in the 2019 LMF and not in the 2015 LMF). Of the
matches identified only in the 2015 LMF, 94.2% were lower certainty matches (Class 3 or 4) [32].
Of the records that were only identified in the 2019 LMF, 99.2% were considered high certainty
matches, 7.1% were from the deterministic linkage step (see Appendix I
) and an additional
92.2% had PROBVALID scores greater than 0.99.
Next, in order to assess the impact of the updated linkage methodology on secondary data
analysis, Cox proportional hazards models were fitted with data from both the 2015 and 2019
LMF for 1999-2014 NHIS and 1999-2014 NHANES to compare hazard ratios (HRs) for all-cause
mortality. To make the samples comparable in terms of follow-up time, only deaths from the
2019 LMF occurring on or before December 31, 2015, were treated as deceased to enable
comparison of the results. Follow-up time was calculated for both versions of the NHIS and
NHANES LMFs using complete date of interview and date of death (month, day, and year) or
December 31, 2015, for participants assumed alive. Both models (2015 LMF and 2019 LMF)
included a standard set of sociodemographic characteristics as reported at the time of
interview: age (in continuous years), sex, race and ethnicity (non-Hispanic White, non-Hispanic
Black, or Hispanic for NHIS and Mexican-American for NHANES), educational attainment (less
than high school, high school diploma or GED, some college, or college degree or more), marital
status (widowed, divorced or separated, never married, or married), and, for NHIS, region of the
country (South, Midwest, Northeast, or West). Survey participants under age 25, those who
responded, “don’t know,” refused to answer, or had missing data for any of these covariates,
and those with a sample weight of zero were excluded from the analytic sample. Sample
weights (adjusted person weights for the NHIS) and the design variables were used to account
for the complex design of the surveys. The HRs for all-cause mortality using the 2015 and the
2019 LMFs, as well as their 95% confidence intervals (CI), are displayed in Tables 3 and 4.

25
Table 3. Hazard ratios for demographic and socioeconomic characteristics obtained from the
2015 and 2019 LMFs, NHIS 1999-2014
2019 LMF
2015 LMF
HR
95% CI
HR
95% CI
Age (Years)
1.09
1.09, 1.09
1.09
1.09, 1.09
Sex
Male
1.59
1.57, 1.62
1.58
1.56, 1.61
Female
Ref.
Race/Ethnicity
Hispanic
0.63
0.61, 0.65
0.90
0.88, 0.93
Non-Hispanic Black
1.02
0.99, 1.05
1.06
1.03, 1.09
Non-Hispanic White
Ref.
Education level
Less than high school
1.98
1.93, 2.04
2.01
1.96, 2.06
High school/GED
1.59
1.55, 1.63
1.59
1.55, 1.63
Some college
1.43
1.40, 1.47
1.42
1.39, 1.46
College or above
Ref.
Marital status
Single
1.70
1.64, 1.76
1.66
1.61, 1.72
Widowed
1.33
1.31, 1.37
1.35
1.32, 1.38
Divorced/Separated
1.49
1.45, 1.52
1.40
1.37, 1.43
Married
Ref.
Region
Midwest
1.04
1.01, 1.07
1.03
1.01, 1.06
Northeast
0.95
0.93, 0.98
0.95
0.93, 0.98
South
1.12
1.10, 1.15
1.10
1.07, 1.12
West
Ref.
For NHIS, the direction of association of the HRs for all characteristics remained unchanged for
the 2019 LMF compared to the 2015 LMF, and there were no changes in statistical significance
between HRs estimated using the two files, except for non-Hispanic Black individuals.
Furthermore, the 95% confidence intervals overlapped for all characteristics except age (95%
CI=1.092-1.094 for the 2019 LMF vs. 1.085-1.086 for the 2015 LMF (note that the numbers in
the table have been rounded to two digits, but three digits are presented here to illustrate the
non-overlap)) and Hispanic ethnicity (95% CI=0.61-0.65 for the 2019 LMF vs. 0.88-0.93 for the
2015 LMF). The 2015 LMF tended to have younger ages and a larger percentage of Hispanics
matching to a death certificate record than the 2019 LMF which may account for some of the
differences noted by the non-overlapping confidence intervals.

26
Table 4. Hazard ratios for demographic and socioeconomic characteristics obtained from the
2015 and 2019 LMFs, NHANES 1999-2014
2019 LMF
2015 LMF
HR
95% CI
HR
95% CI
Age (Years)
1.09
1.09, 1.10
1.09
1.09, 1.09
Sex
Male
1.76
1.63, 1.89
1.71
1.58, 1.84
Female
Ref.
Race/Ethnicity
Mexican American
0.67
0.59, 0.76
1.00
0.89, 1.12
Non-Hispanic Black
1.05
0.96, 1.15
1.07
0.98, 1.17
Non-Hispanic White
Ref.
Education level
Less than high school
1.63
1.47, 1.81
1.65
1.49, 1.83
High school/GED
1.28
1.17, 1.39
1.28
1.17, 1.39
Some college or above
Ref.
Marital status
Unmarried
1.67
1.55, 1.80
1.62
1.50, 1.74
Married
Ref.
For 1999-2014 NHANES, the direction of association of the HRs for nearly all characteristics
remained unchanged for the 2019 LMF compared to the 2015 LMF, and the 95% confidence
intervals overlapped for all characteristics except Mexican-American ethnicity (95% CI=0.59-0.76
for the 2019 LMF vs. 0.89-1.12 for the 2015 LMF). Furthermore, there were no changes in
statistical significance between HRs estimated using the two files except for Mexican-American
ethnicity.
3 Comparison of the 2019 and 2015 LMF with External Data Sources
External sources also supported the results of the updated linkage algorithm and highlight
improvements to linkage quality. A concordance analysis was conducted using survey-collected
death data from Medical Expenditure Panel Survey (MEPS), which follows selected NHIS
participants over time [35]. During data collection, MEPS interviewers may ascertain information
on survey participant’s vital status and date of death (if deceased). MEPS is designed such that
its survey participants was also previously part of the NHIS sample and therefore the NHIS LMFs
could be used to assess concordance of vital status with data collected in MEPS. Cohen’s Kappa
statistic was used to measure agreement between vital status as determined by linkage of NHIS
to the NDI and survey collected vital status as collected in MEPS. Concordance with the survey
participant’s vital status obtained from MEPS was calculated for both the 2015 LMF and 2019
LMF. Similar to the hazard ratio analysis, for this analysis, only deaths from the 2019 LMF
occurring on or before December 31, 2015 were treated as deceased to enable comparison of
the results. The standard range of the Kappa statistic is 0 for no agreement and 1 for complete
agreement, albeit values from -1 to 0 are possible and would indicate negative correlation.
Landis and Koch [36] suggest the following interpretation for the Kappa statistic: < 0 as poor, 0–
0.20 as slight, 0.21–0.40 as fair, 0.41–0.60 as moderate, 0.61–0.80 as substantial, and 0.81–1 as
almost perfect agreement. The Kappa statistic was used to account for agreement by chance.
27
For this report, MEPS follow up information for 1997-2012 NHIS participants who were also
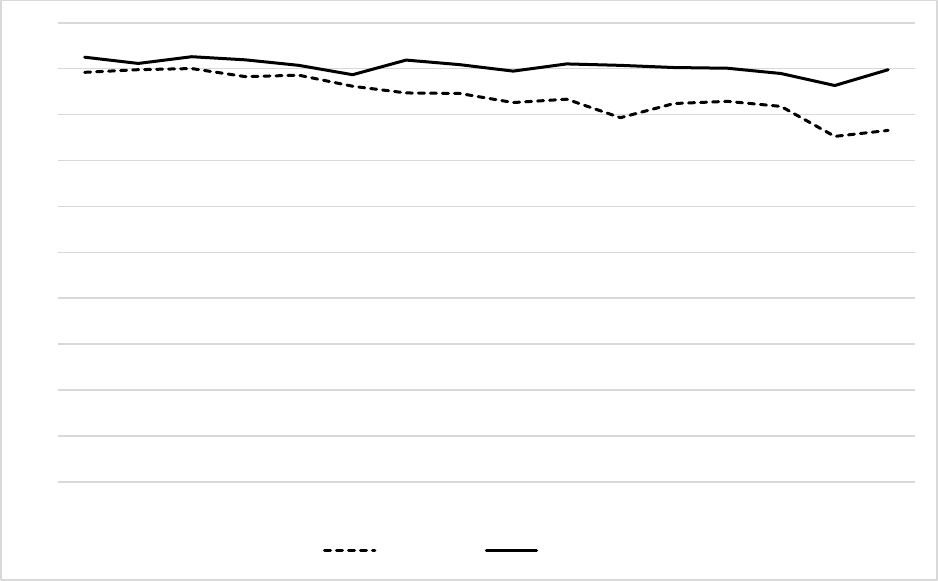
sampled in MEPS was used. The Kappa statistic resulting from the comparison of the 2019 LMF
results to the data collected in MEPS was greater than 0.90 for 11 out of 16 NHIS years, and
greater than 0.85 for all survey years. This was an improvement over the 2015 LMF, which saw
the Kappa statistic decline from approximately 0.93 to 0.83 between NHIS 1996 and 2005 and
remain below 0.83 for the remainder of the time period. Of note, the Kappa statistics, based on
the 2015 LMF, decline in the years where NHIS began collecting SSN4 or no SSN.
Figure 1. Kappa statistics for concordance of mortality status with MEPS for the 2015 and 2019
LMFs, NHIS 1997-2012
4 Conclusions
In summary, enhancements have been made to the algorithm used to link the NCHS survey and
NDI data. These enhancements are designed to account for changes in the survey data
collection process and address the need for an updated linkage algorithm. Comparisons have
been made between the 2015 LMF and the 2019 LMF. Overall, the results are similar when SSN9
was collected as part of the survey data collection. This is noted by the overlap of those
identified as deceased and the similar HRs for all-cause mortality. An external data source was
used to assess the quality of the 2015 LMF and 2019 LMF. Based on the analysis, the 2019 LMF
shows a slightly higher concordance with the external benchmark than the 2015 LMF, especially
during the years when only SSN4 was collected. These analyses show that the new algorithm has
improved linkage accuracy. The NCHS Data Linkage Program continually works to improve the
algorithms used to link data and create robust datasets that can be used to address a wide-
range of research and health-policy objectives.
0
0.1
0.2
0.3
0.4
0.5
0.6
0.7
0.8
0.9
1
1997 1998 1999 2000 2001 2002 2003 2004 2005 2006 2007 2008 2009 2010 2011 2012
2015 LMF 2019 LMF

28
Appendix III: Merging Restricted-use LMF Data and Public-use NCHS Survey Data
The data provided on the 1994-2018 NHIS, 1999-2018 NHANES, NHANES III, and the NNHS LMFs
can be merged with the NCHS restricted- and public-use survey data files using the unique
survey-specific public identification number (PUBLICID/SEQN/RESNUM).
At this time the 2019 LMFs are only available for research use through the NCHS restricted
access data center (RDC). Approved RDC researchers may choose to provide their own analytic
files created from public use survey files to the RDC. Therefore, it is important for researchers to
include survey-specific public identification number on any analytic files sent to the RDC. The
RDC will merge data (using PUBLICID, SEQN or RESNUM) from the 2019 LMF to the analyst’s file.
The merged file will be held at the RDC and made available for analysis.
Information on how to construct the NCHS survey-specific PUBLICID, SEQN, or RESNUM is
provided below.
1 National Health Interview Survey (NHIS), 1986-2018
1.1 NHIS 1986-1994
Public-use
Variable Location Length Description
YEAR 3-4 2 Year of interview
QUARTER 5 1 Calendar quarter of interview
PSUNUMR 6-8 3 Random recode of PSU
WEEKCEN 9-10 2 Week of interview within quarter
SEGNUM 11-12 2 Segment number
HHNUM 13-14 2 Household number within quarter
PNUM 15-16 2 Person number within household
Concatenate all variables to get the unique person identifier.
SAS example:
length publicid $14;
PUBLICID = ((put(YEAR,2.)) || (put(QUARTER,1.)) || PSUNUMR || (put(WEEKCEN,z2.)) || SEGNUM ||
HHNUM || PNUM);
Stata example:
egen PUBLICID = concat(YEAR QUARTER PSUNUMR WEEKCEN SEGNUM HHNUM PNUM) (Note
that this will convert the variables to string variables.)

29
1.2 NHIS 1995-1996
Public-use
Variable Location Length Description
YEAR 3-4 2 Year of interview
HHID 5-14 10 Household ID number
PNUM 15-16 2 Person number within household
Concatenate all variables to get the unique person identifier.
SAS example:
length publicid $14;
PUBLICID = trim(left(YEAR||HHID||PNUM));
Stata example:
egen PUBLICID = concat(YEAR HHID PNUM)
(Note that this will convert the variables to string variables.)
1.3 NHIS 1997-2003
Public-use
Variable Location Length Description
SRVY_YR 3-6 4 Year of interview
HHX 7-12 6 Household number
FMX 13-14 2 Family number
PX 15-16 2 Person number within household
Concatenate all variables to get the unique person identifier. The person identifier was called PX in the
1997-2003 NHIS and FPX in the 2004 (and later) NHIS; users may find it necessary to create an FPX
variable in the 2003 and earlier datasets (or PX in later datasets).
SAS example:
length publicid $14;
PUBLICID = trim(left(SRVY_YR||HHX|| FMX||PX));
Stata example:
egen PUBLICID = concat(SRVY_YR HHX FMX PX)
(Note that this will convert the variables to string variables.)

30
1.4 NHIS 2004
Public-use
Variable Location Length Description
SRVY_YR 3-6 4 Year of interview
HHX 7-12 6 Household number
FMX 13-14 2 Family number
FPX 15-16 2 Person number within household
Concatenate all variables to get the unique person identifier.
SAS example:
length publicid $14;
PUBLICID = trim(left(SRVY_YR||HHX||FMX||FPX));
Stata example:
egen PUBLICID = concat(SRVY_YR HHX FMX FPX)
(Note that this will convert the variables to string variables.)
1.5 NHIS 2005-2018
Public-use
Variable Location Length Description
SRVY_YR 3-6 4 Year of interview
HHX 7-12 6 Household number
FMX 16-17 2 Family number
FPX 18-19 2 Person number within household
Concatenate all variables to get the unique person identifier.
SAS example:
length publicid $14;
PUBLICID = trim(left(SRVY_YR||HHX||FMX||FPX));
Stata example:
egen PUBLICID = concat(SRVY_YR HHX FMX FPX)
(Note that this will convert the variables to string variables.)
2 National Health and Nutrition Examination Surveys (NHANES)
2.1 National Health and Nutrition Examination Survey (NHANES), 1999-2018
Item Length Description
SEQN 6 Participant identification number
All of the NHANES public-use data files are linked with the common survey participant identification
number (SEQN). Merging information from multiple NHANES files to the 2019 LMFs using this variable
ensures that the appropriate information for each survey participant is merged correctly.

31
2.2 Third National Health and Nutrition Examination Survey (NHANES III)
Item Length Description
SEQN 5 Participant identification number
All of the NHANES III public-use data files are linked with the common survey participant
identification number (SEQN). Merging information from multiple NHANES III files to the 2019 LMF
using this variable ensures that the appropriate information for each survey participant is merged
correctly.
2.3 NHANES I Epidemiologic Follow-up Study (NHEFS)
Item Length Description
SEQN 5 Participant identification number
All of the NHEFS public-use data files are linked with the common survey participant identification
number (SEQN). Merging information from multiple NHEFS files to the 2019 LMF using this variable
ensures that the appropriate information for each survey participant is merged correctly.
3 LSOA II
Public-use
Variable Location Length Description
YEAR 3-4 2 Year of interview
QUARTER 5 1 Calendar quarter of interview
PSUNUMR 6-8 3 Random recode of PSU #
WEEKCEN 9-10 2 Week of interview within quarter
SEGNUM 11-12 2 Segment number
HHNUM 13-14 2 Household number within quarter
PNUM 15-16 2 Person number within household
Concatenate all variables to get the unique person identifier.
SAS example:
length publicid $14;
PUBLICID = trim(left(YEAR||QUARTER||PSUNUMR||WEEKCEN||SEGNUM||HHNUM||PNUM));
Stata example:
egen PUBLICID = concat(YEAR QUARTER PSUNUMR WEEKCEN SEGNUM HHNUM PNUM)
(Note that this will convert the variables to string variables.)

32
References
1. National Center for Health Statistics. National Health Interview Survey. [cited 2021 April 19];
Available from: https://www.cdc.gov/nchs/nhis/index.htm
.
2. National Center for Health Statistics. About the National Health and Nutrition Examination
Survey. [cited 2020 September 10]; Available from:
https://www.cdc.gov/nchs/nhanes/about_nhanes.htm
.
3. National Center for Health Statistics. Continuous NHANES. [cited 2020 September 10]; Available
from: https://wwwn.cdc.gov/nchs/nhanes/continuousnhanes/default.aspx
.
4. National Center for Health Statistics. NHANES III (1988-1994). [cited 2020 September 10];
Available from: https://wwwn.cdc.gov/nchs/nhanes/nhanes3/default.aspx
.
5. National Center for Health Statistics. Epidemiologic Followup Study (NHEFS). [cited 2020
September 10]; Available from: https://wwwn.cdc.gov/nchs/nhanes/nhefs/Default.aspx
.
6. National Center for Health Statistics. National Nursing Home Survey. [cited 2020 September 10];
Available from: https://www.cdc.gov/nchs/nnhs/index.htm
.
7. National Center for Health Statistics. The Second Longitudinal Study of Aging (LSOA II). [cited
2020 September 10]; Available from: https://www.cdc.gov/nchs/lsoa/lsoa2.htm
.
8. National Center for Health Statistics. National Death Index. [cited 2020 September 10];
Available from: https://www.cdc.gov/nchs/ndi/index.htm
.
9. Fellegi, I.P. and A.B. Sunter, A Theory for Record Linkage. Journal of the American Statistical
Association, 1969. 64(328): p. 1183-1210.
10. Golden, C., et al., Linkage of NCHS Population Health Surveys to Administrative Records From
Social Security Administration and Centers for Medicare Medicaid Services. Vital Health Stat 1,
2015(58): p. 1-53.
11. Aram, J., et al., Assessing Linkage Eligibility Bias in the National Health Interview Survey. Vital
Health Stat 2, 2021(186): p. 1-28.
12. National Center for Health Statistics, Variance estimation for the 1985-94 NHIS public use person
data.
13. National Center for Health Statistics, Variance estimation for the NHIS public use person data,
1995 & 1996. 2009.
14. National Center for Health Statistics, Variance Estimation and Other Analytic Issues in the 1997-
2005 NHIS. 2009.
15. National Center for Health Statistics, Variance Estimation Guidance, NHIS 2006-2015. 2016.
16. National Center for Health Statistics. Module 3: Weighting. [cited 2020 September 28];
Available from: https://wwwn.cdc.gov/nchs/nhanes/tutorials/Module3.aspx
.
17. Bell, F.C. and M.L. Miller, Life Tables for the United States Social Security Area 1900-2100. 2005,
Social Security Administration.
18. Ingram, D.D. and D.M. Makuc, Statistical issues in analyzing the NHANES I Epidemiologic
Followup Study. Series 2: Data evaluation and methods research. Vital Health Stat 2, 1994(121):
p. 1-30.
19. National Center for Health Statistics, National Health Interview Survey public use data release
1992 core files - version without Hispanic oversample. 2006.
20. National Center for Health Statistics. 2019 Restricted-Use Linked Mortality Files. [cited 2020
September 24]; Available from:
https://www.cdc.gov/nchs/data-linkage/mortality-
restricted.htm.
21. National Center for Health Statistics, 2014 Documentation Initial Release: Mortality Multiple
Cause-of-Death Public Use Record. National Center for Health Statistics: Hyattsville, MD.

33
22. National Center for Health Statistics, 2016 Documentation Initial Release: Mortality Multiple
Cause-of-Death Public Use Record. National Center for Health Statistics: Hyattsville, MD.
23. National Center for Health Statistics. Research Data Center (RDC). [cited 2020 September 24];
Available from: https://www.cdc.gov/rdc/
.
24. National Center for Health Statistics, Public-use Linked Mortality File. May 2022. Available from:
https://www.cdc.gov/nchs/data/datalinkage/public-use-linked-mortality-file-description.pdf
.
25. Michelson, M. and C. Knoblock, Learning Blocking Schemes for Record Linkage. Vol. 1. 2006.
26. Christen, P., Data Matching: Concepts and Techniques for Record Linkage, Entity Resolution, and
Duplicate Detection. Data-Centric Systems and Applications, ed. M.J. Carey and S. Ceri. Vol. 1.
2012, New York: Springer-Verlag Berlin Heidelberg.
27. Jaro, M.A., Advances in Record-Linkage Methodology as Applied to Matching the 1985 Census of
Tampa, Florida. Journal of the American Statistical Association, 1989. 84(406): p. 414-420.
28. Resnick, D.M., Mirel, L.B., Roemer, M.I., Campbell, S.R. Adjusting Match Weights to Partial
Levels of String Agreement in Data Linkage. in Joint Statistical Meetings. 2020. Alexandria, VA.
29. Winkler, W., String Comparator Metrics and Enhanced Decision Rules in the Fellegi-Sunter Model
of Record Linkage. Proceedings of the Section on Survey Research Methods, 1990.
30. National Center for Health Statistics, The Linkage of the 2014 National Hospital Care Survey to
the 2014/2015 Centers for Medicare & Medicaid Services Master Beneficiary Summary File:
Methodology Overview and Analytic Considerations. 2019.
31. National Center for Health Statistics, The Linkage of the 2016 National Hospital Care Survey to
the 2016/2017 Centers for Medicare & Medicaid Services Medicare Enrollment,
Claims/Encounters and Assessment Data: Matching Methodology and Analytic Considerations.
2020.
32. National Center for Health Statistics, National Death Index user’s guide. 2013, National Center
for Health Statistics: Hyattsville, MD.
33. Lariscy, J.T., Black–White Disparities in Adult Mortality: Implications of Differential Record
Linkage for Understanding the Mortality Crossover. Population Research and Policy Review,
2017. 36(1): p. 137-156.
34. Lariscy, J.T., R.A. Hummer, and M.D. Hayward, Hispanic older adult mortality in the United
States: new estimates and an assessment of factors shaping the Hispanic paradox. Demography,
2015. 52(1): p. 1-14.
35. Agency for Healthcare Research and Quality. Survey Background. [cited 2021 April 19]; Available
from: https://www.meps.ahrq.gov/mepsweb/about_meps/survey_back.jsp
.
36. Landis, J.R. and G.G. Koch, The measurement of observer agreement for categorical data.
Biometrics, 1977. 33(1): p. 159-74.
